| Param | Original file | Final file |
|---|---|---|
| Filename | modeM0/AS1A05_204T01_9000002856_19317cztM0_level2.evt | modeM0/AS1A05_204T01_9000002856_19317cztM0_level2_quad_clean.evt |
| Size (bytes) | 1,223,392,320 | 130,435,200 |
| Size | 1.1 GB | 124.4 MB |
| Events in quadrant A | 5,812,023 | 829,018 |
| Events in quadrant B | 5,907,107 | 837,847 |
| Events in quadrant C | 5,788,741 | 803,194 |
| Events in quadrant D | 18,708,843 | 624,150 |
| Mode M0 | |||
|---|---|---|---|
| Quadrant | BADHDUFLAG | Total packets | Discarded packets |
| A | 0 | 25261 | 2 |
| B | 0 | 25361 | 2 |
| C | 0 | 25106 | 2 |
| D | 0 | 64165 | 2 |
| Mode M9 | |||
|---|---|---|---|
| Quadrant | BADHDUFLAG | Total packets | Discarded packets |
| A | 0 | 14 | 0 |
| B | 0 | 14 | 0 |
| C | 0 | 14 | 0 |
| D | 0 | 14 | 0 |
| Mode SS | |||
|---|---|---|---|
| Quadrant | BADHDUFLAG | Total packets | Discarded packets |
| A | 0 | 250 | 0 |
| B | 0 | 250 | 0 |
| C | 0 | 250 | 0 |
| D | 0 | 250 | 0 |
| Quadrant | Total seconds | Saturated seconds | Saturation percentage |
|---|---|---|---|
| A | 12359 | 108 | 0.873857% |
| B | 12360 | 124 | 1.003236% |
| C | 12359 | 143 | 1.157052% |
| D | 12359 | 4314 | 34.905737% |
Noise dominated data is calculated using 1-second bins in cleaned event files. If a bin has >2000 counts, and if more than 50% of those come from <1% of pixels, then it is considered to be noise-dominated and hence unusable.
| Quadrant | # 1 sec bins | Bins with >0 counts | Bins with >2000 counts | High rate bins dominated by noise | Noise dominated (total time) | Noise dominated (detector-on time) | Marked lightcurve |
|---|---|---|---|---|---|---|---|
| A | 13709 | 12359 | 2 | 2 | 0.01% | 0.02% | 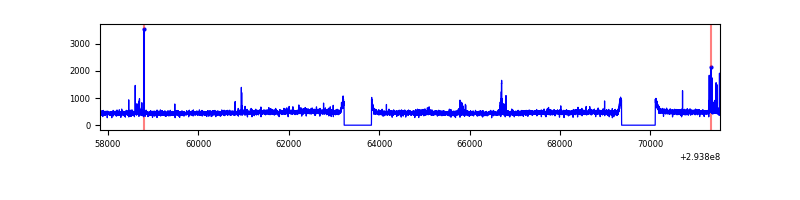 |
| B | 13710 | 12360 | 2 | 2 | 0.01% | 0.02% | 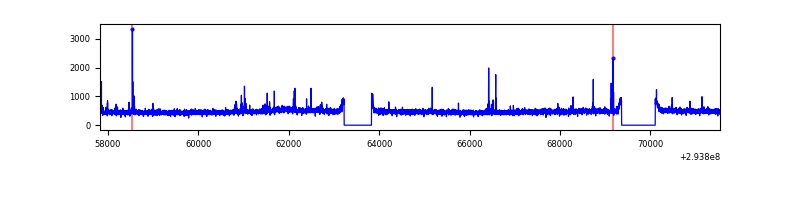 |
| C | 13709 | 12360 | 0 | 0 | 0.00% | 0.00% | 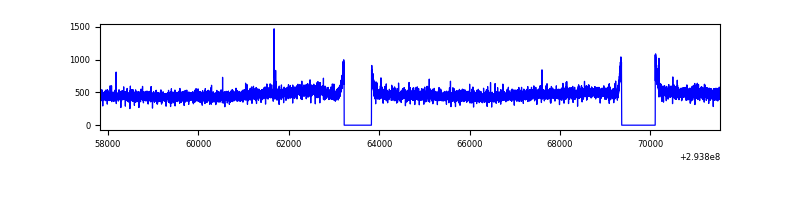 |
| D | 13709 | 12359 | 3721 | 3721 | 27.14% | 30.11% | 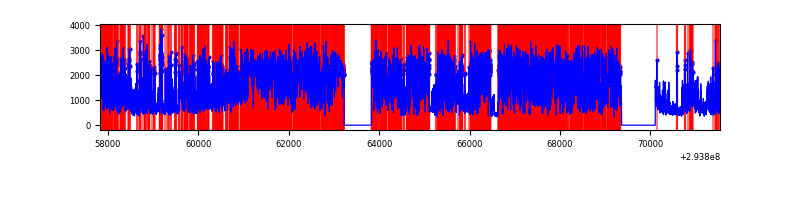 |
Top three noisy pixels from each quadrant. If the there are fewer than three noisy pixels in the level2.evt file, extra rows are filled as -1
| Pixel properties | Quadrant properties | ||||||
|---|---|---|---|---|---|---|---|
| Quadrant | DetID | PixID | Counts | Sigma | Mean | Median | Sigma |
| A | 5 | 16 | 88379 | 291.47 | 1477 | 1444 | 298.3 |
| A | 11 | 29 | 35347 | 113.67 | 1477 | 1444 | 298.3 |
| A | 13 | 254 | 14445 | 43.59 | 1477 | 1444 | 298.3 |
| B | 3 | 64 | 44686 | 153.26 | 1468 | 1426 | 282.3 |
| B | 10 | 247 | 39406 | 134.55 | 1468 | 1426 | 282.3 |
| B | 0 | 198 | 38640 | 131.84 | 1468 | 1426 | 282.3 |
| C | 14 | 238 | 218823 | 651.18 | 1413 | 1416 | 333.9 |
| C | 3 | 233 | 58666 | 171.48 | 1413 | 1416 | 333.9 |
| C | 13 | 61 | 10035 | 25.81 | 1413 | 1416 | 333.9 |
| D | 10 | 66 | 11534036 | 36999.04 | 1271 | 1232 | 311.7 |
| D | 1 | 52 | 1434563 | 4598.35 | 1271 | 1232 | 311.7 |
| D | 7 | 238 | 631763 | 2022.84 | 1271 | 1232 | 311.7 |
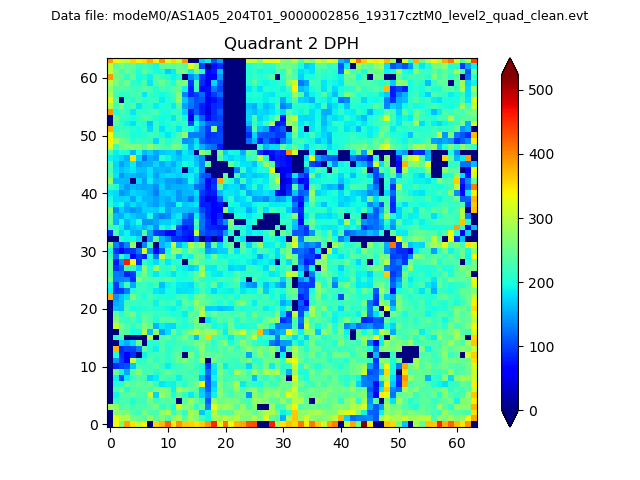
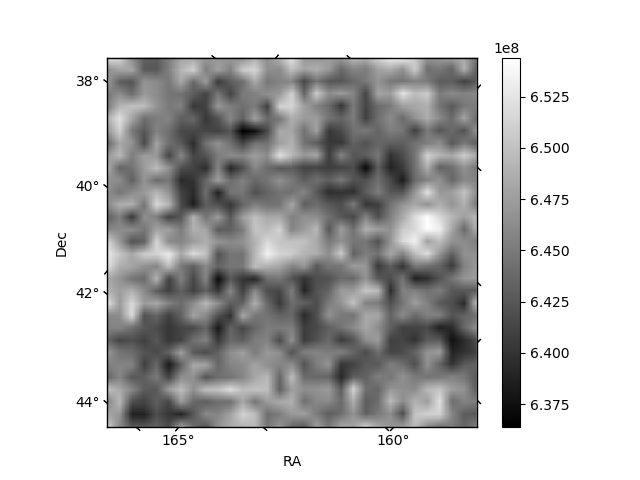
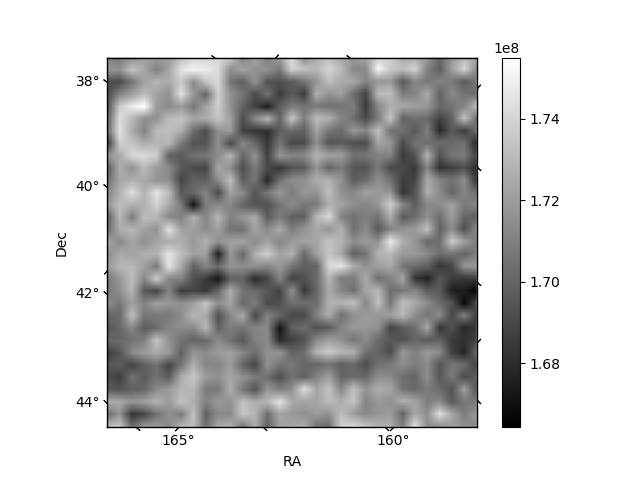
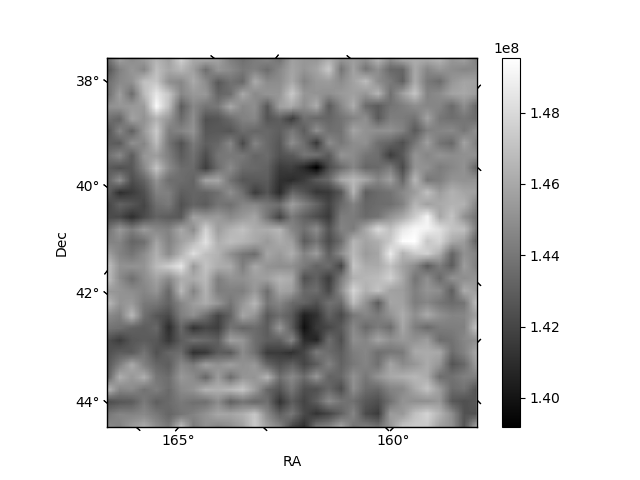
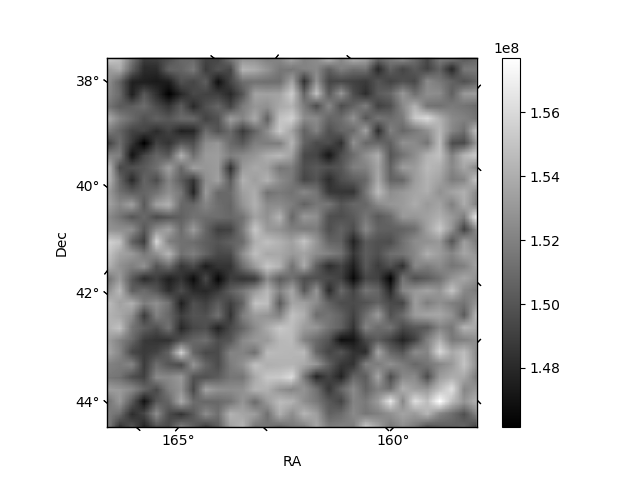
Histogram calculated using DETX and DETY for each event in the final _common_clean file
| Quadrant A | 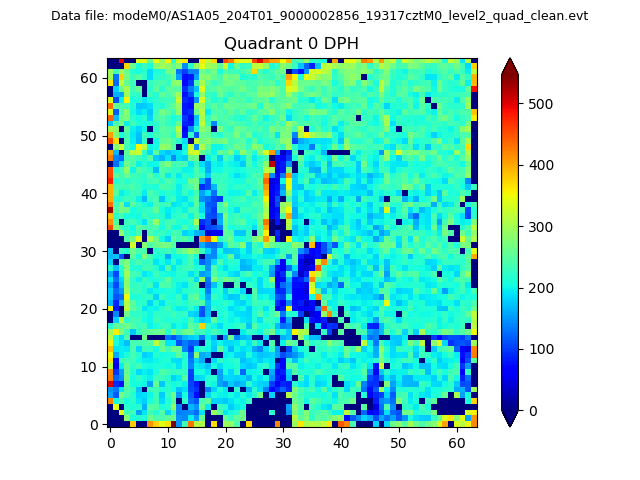 |
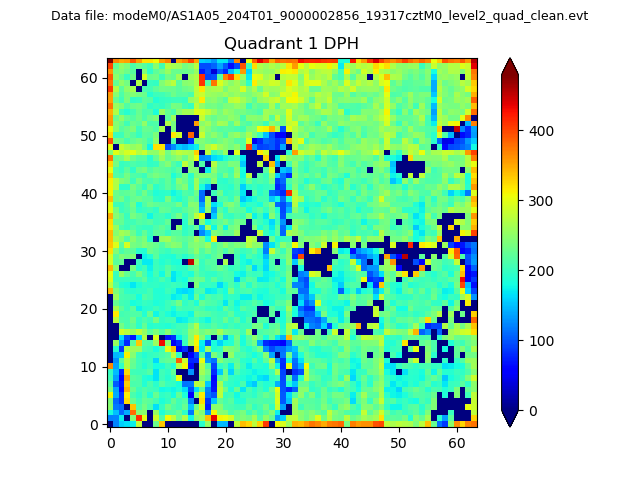 |
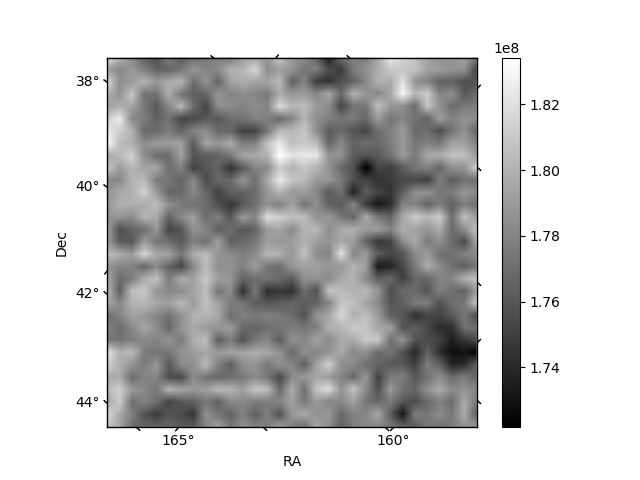
Quadrant B |
|---|---|---|---|
| Quadrant D | 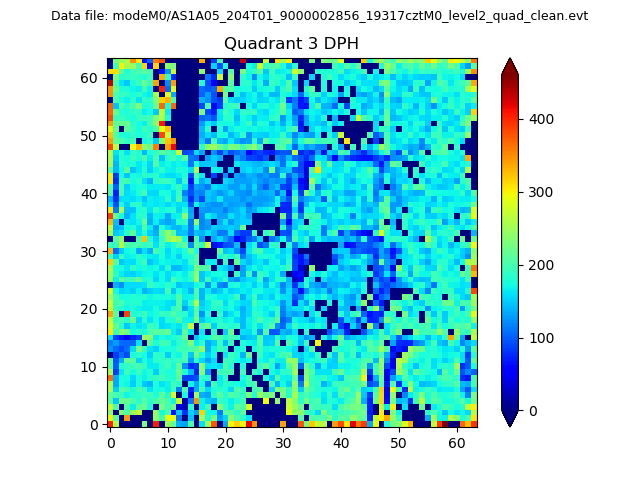 |
 |
Quadrant C |
| Plot type | Count rate plots | Images |
|---|---|---|
| Comparison with Poisson distribution Blue bars denote a histogram of data divided into 1 sec bins. Red curve is a Poisson curve with rate = median count rate of data. |
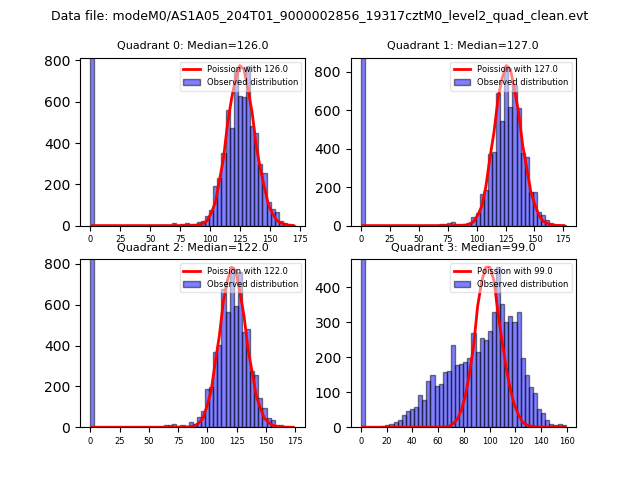 |
 |
| Quadrant-wise count rates Data is divided into 100 sec bins |
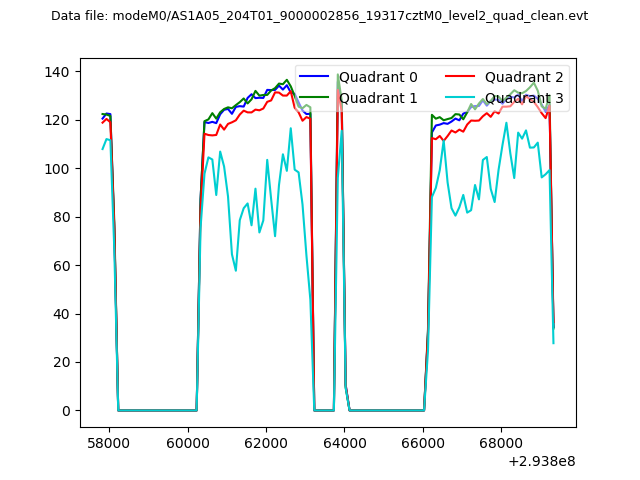 |
|
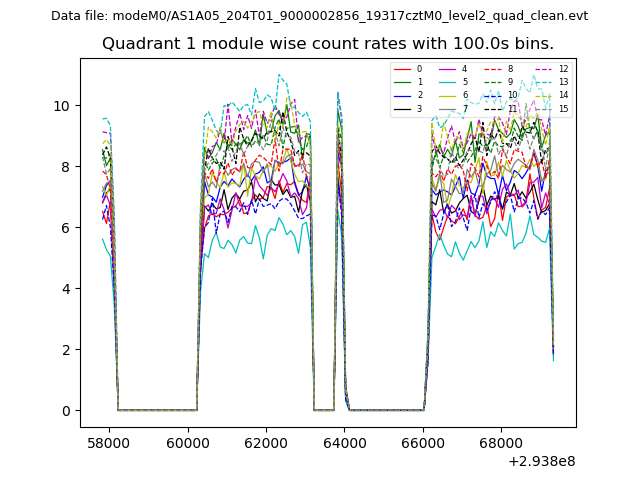
| Module-wise count rates for Quadrant A Data is divided into 100 sec bins |
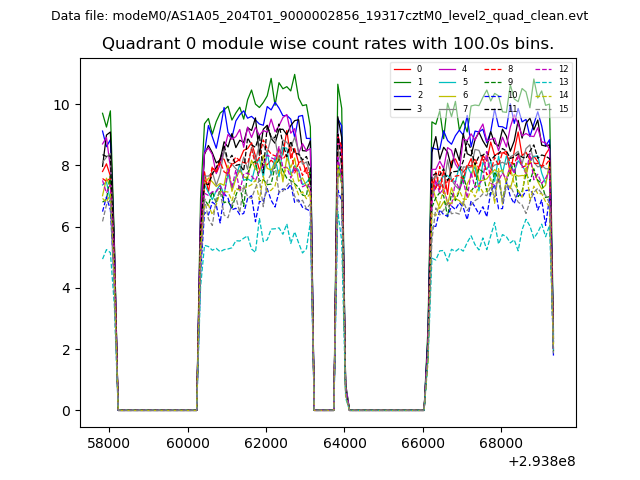 |
 |
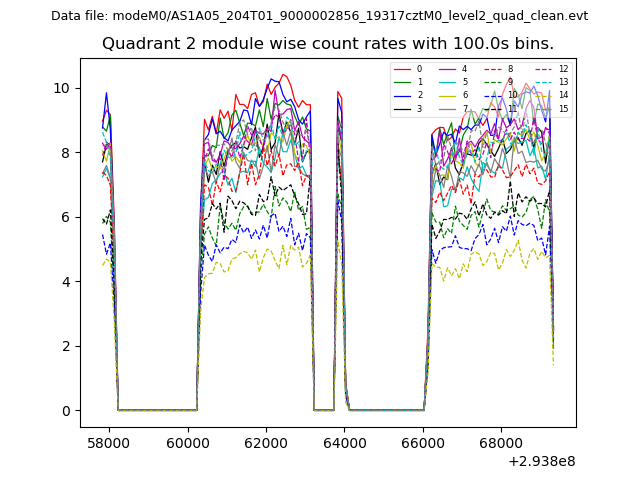
| Module-wise count rates for Quadrant B Data is divided into 100 sec bins |
 |
 |
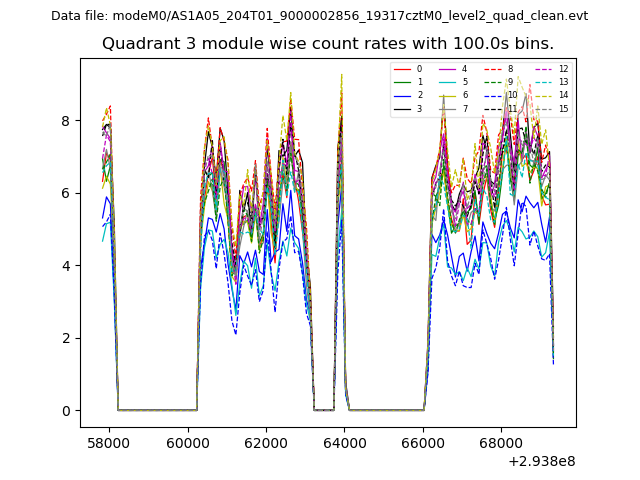
| Module-wise count rates for Quadrant C Data is divided into 100 sec bins |
 |
 |
| Module-wise count rates for Quadrant D Data is divided into 100 sec bins |
 |
 |
| Parameter | Plot |
|---|---|
| CZT HV Monitor | 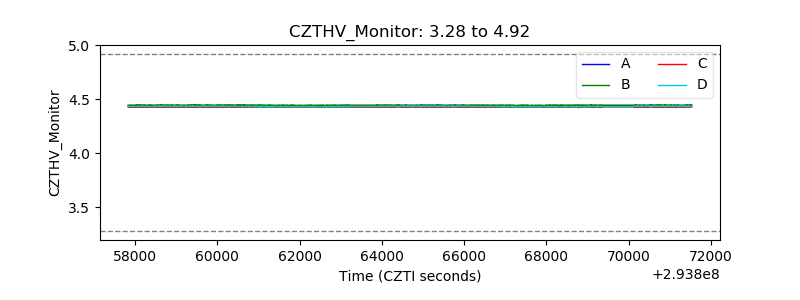 |
| D_VDD |  |
| Temperature 1 |  |
| Veto HV Monitor | 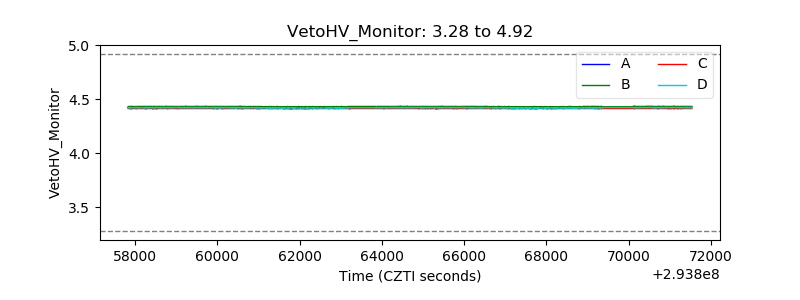 |
| Veto LLD | 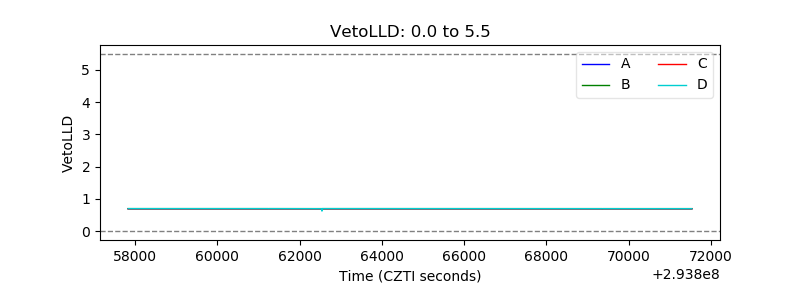 |
| Alpha Counter | 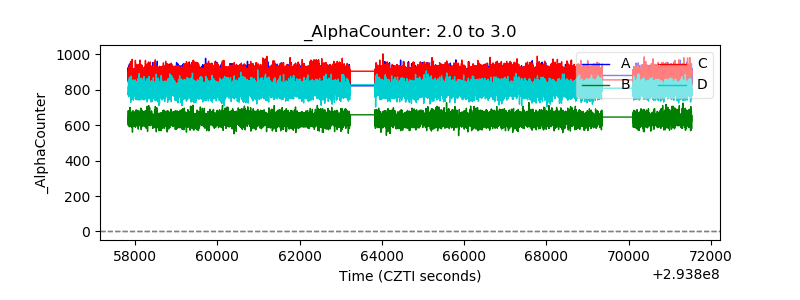 |
| _CPM_Rate | 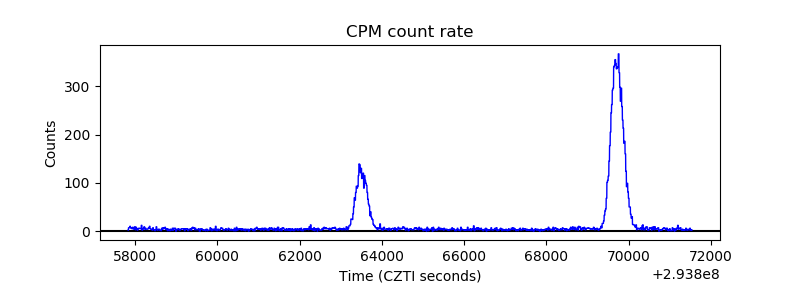 |
| CZT Counter | 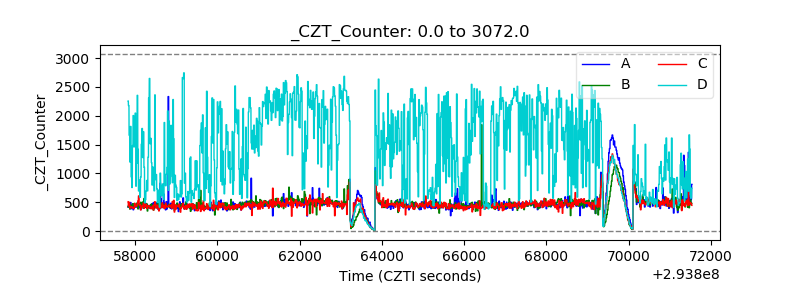 |
| +2.5 Volts monitor |  |
| +5 Volts monitor | 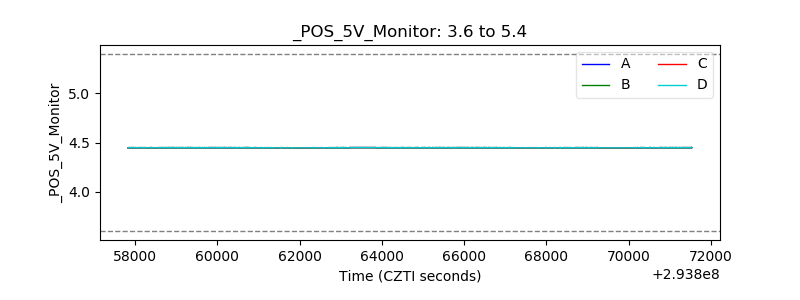 |
| _ROLL_ROT | 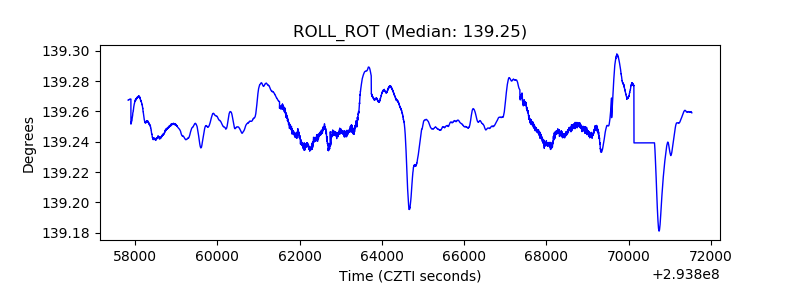 |
| _Roll_DEC | 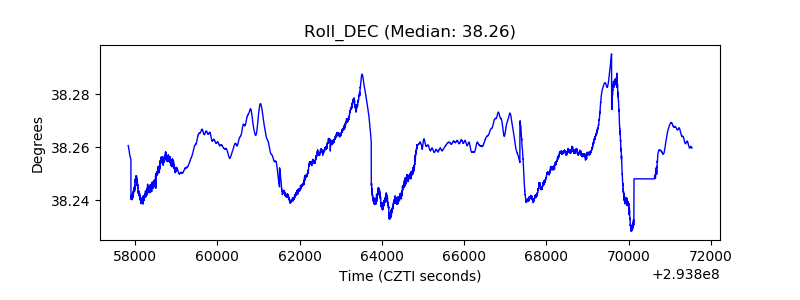 |
| _Roll_RA | 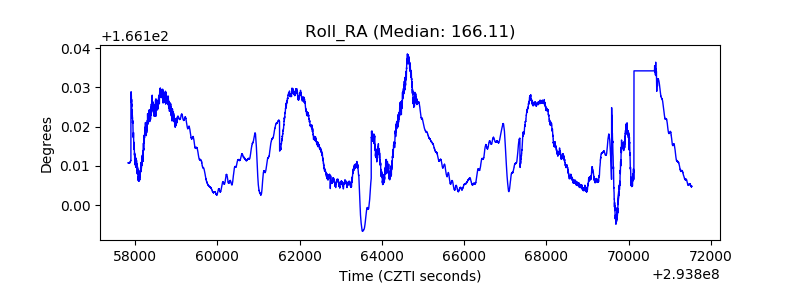 |
| Veto Counter | 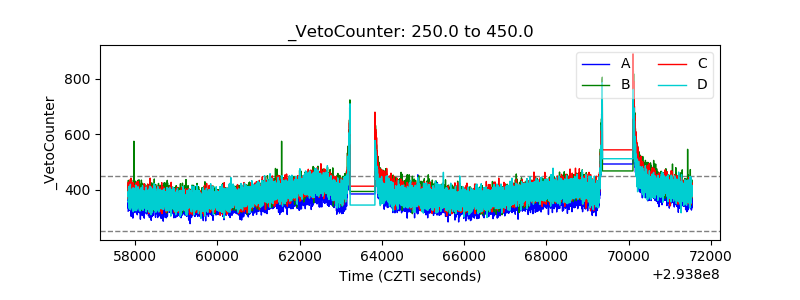 |