| Param | Original file | Final file |
|---|---|---|
| Filename | modeM0/AS1A05_204T01_9000002856_19321cztM0_level2.evt | modeM0/AS1A05_204T01_9000002856_19321cztM0_level2_quad_clean.evt |
| Size (bytes) | 538,660,800 | 96,765,120 |
| Size | 513.7 MB | 92.3 MB |
| Events in quadrant A | 3,441,722 | 640,241 |
| Events in quadrant B | 3,544,238 | 643,411 |
| Events in quadrant C | 3,393,461 | 608,714 |
| Events in quadrant D | 5,491,449 | 583,108 |
| Mode M0 | |||
|---|---|---|---|
| Quadrant | BADHDUFLAG | Total packets | Discarded packets |
| A | 0 | 14477 | 2 |
| B | 0 | 14789 | 2 |
| C | 0 | 14193 | 2 |
| D | 0 | 20817 | 2 |
| Mode M9 | |||
|---|---|---|---|
| Quadrant | BADHDUFLAG | Total packets | Discarded packets |
| A | 0 | 21 | 0 |
| B | 0 | 22 | 0 |
| C | 0 | 22 | 0 |
| D | 0 | 22 | 0 |
| Mode SS | |||
|---|---|---|---|
| Quadrant | BADHDUFLAG | Total packets | Discarded packets |
| A | 0 | 132 | 0 |
| B | 0 | 132 | 0 |
| C | 0 | 132 | 0 |
| D | 0 | 132 | 0 |
| Quadrant | Total seconds | Saturated seconds | Saturation percentage |
|---|---|---|---|
| A | 6524 | 94 | 1.440834% |
| B | 6524 | 104 | 1.594114% |
| C | 6524 | 122 | 1.870018% |
| D | 6524 | 794 | 12.170448% |
Noise dominated data is calculated using 1-second bins in cleaned event files. If a bin has >2000 counts, and if more than 50% of those come from <1% of pixels, then it is considered to be noise-dominated and hence unusable.
| Quadrant | # 1 sec bins | Bins with >0 counts | Bins with >2000 counts | High rate bins dominated by noise | Noise dominated (total time) | Noise dominated (detector-on time) | Marked lightcurve |
|---|---|---|---|---|---|---|---|
| A | 7724 | 6524 | 2 | 2 | 0.03% | 0.03% | 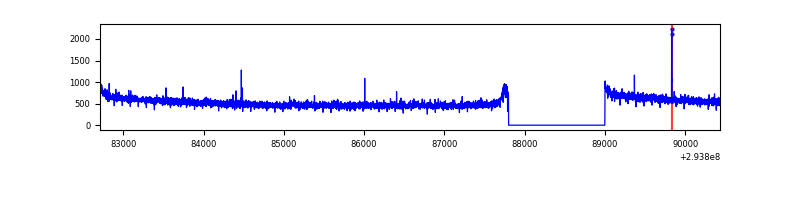 |
| B | 7724 | 6524 | 10 | 10 | 0.13% | 0.15% | 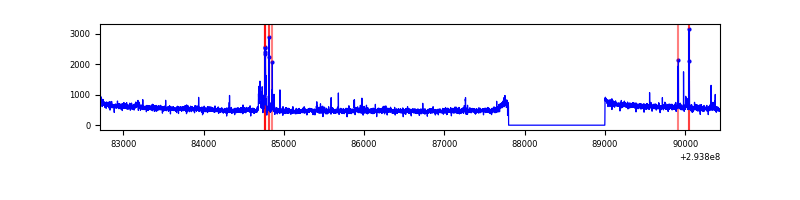 |
| C | 7724 | 6524 | 0 | 0 | 0.00% | 0.00% | 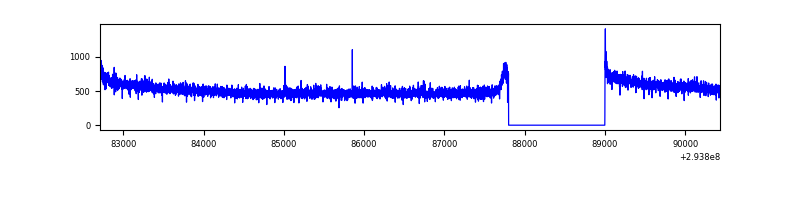 |
| D | 7724 | 6524 | 638 | 638 | 8.26% | 9.78% | 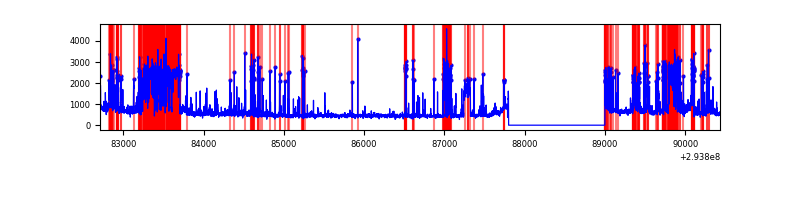 |
Top three noisy pixels from each quadrant. If the there are fewer than three noisy pixels in the level2.evt file, extra rows are filled as -1
| Pixel properties | Quadrant properties | ||||||
|---|---|---|---|---|---|---|---|
| Quadrant | DetID | PixID | Counts | Sigma | Mean | Median | Sigma |
| A | 11 | 29 | 14917 | 80.26 | 884 | 867 | 175.1 |
| A | 13 | 254 | 8094 | 41.28 | 884 | 867 | 175.1 |
| A | 0 | 226 | 7903 | 40.19 | 884 | 867 | 175.1 |
| B | 0 | 190 | 84850 | 519.59 | 864 | 844 | 161.7 |
| B | 0 | 230 | 27568 | 165.29 | 864 | 844 | 161.7 |
| B | 0 | 229 | 24031 | 143.42 | 864 | 844 | 161.7 |
| C | 14 | 238 | 132395 | 685.21 | 828 | 834 | 192.0 |
| C | 3 | 233 | 31571 | 160.09 | 828 | 834 | 192.0 |
| C | 13 | 61 | 5827 | 26.01 | 828 | 834 | 192.0 |
| D | 7 | 238 | 1287802 | 6646.74 | 806 | 782 | 193.6 |
| D | 1 | 52 | 799496 | 4124.91 | 806 | 782 | 193.6 |
| D | 11 | 176 | 293278 | 1510.58 | 806 | 782 | 193.6 |
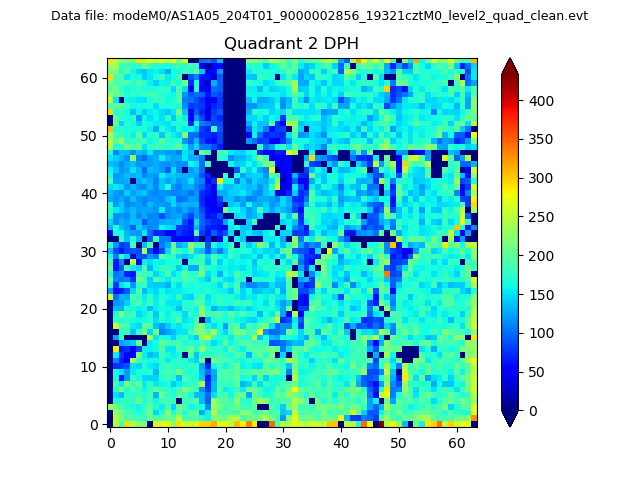
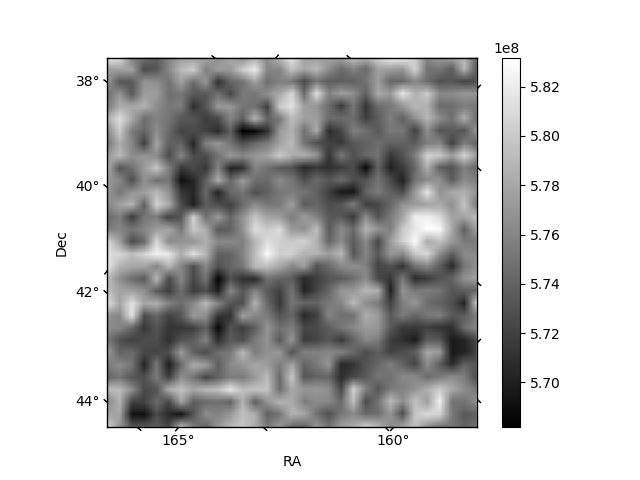
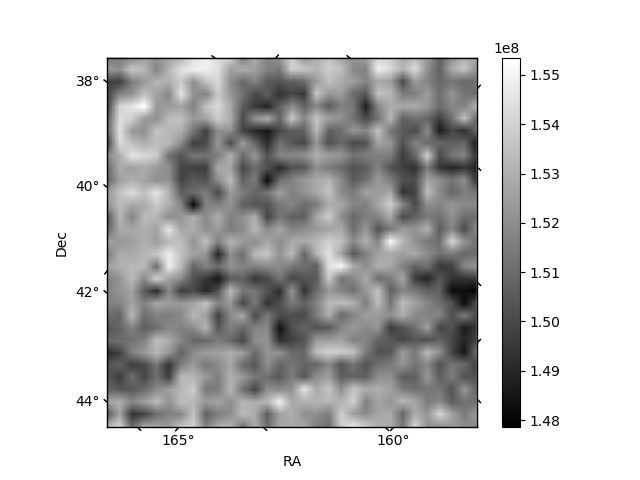
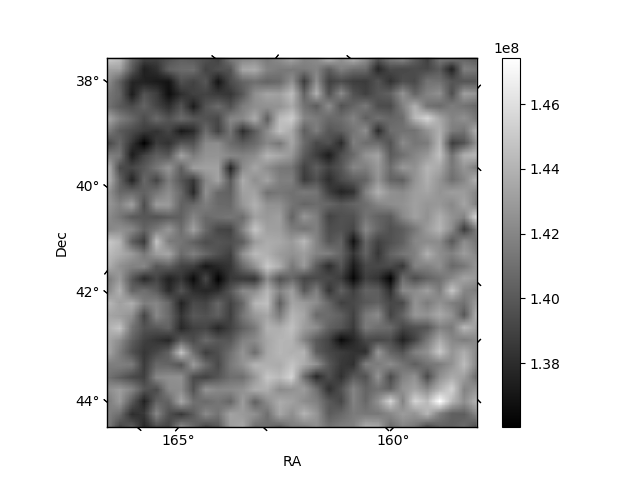
Histogram calculated using DETX and DETY for each event in the final _common_clean file
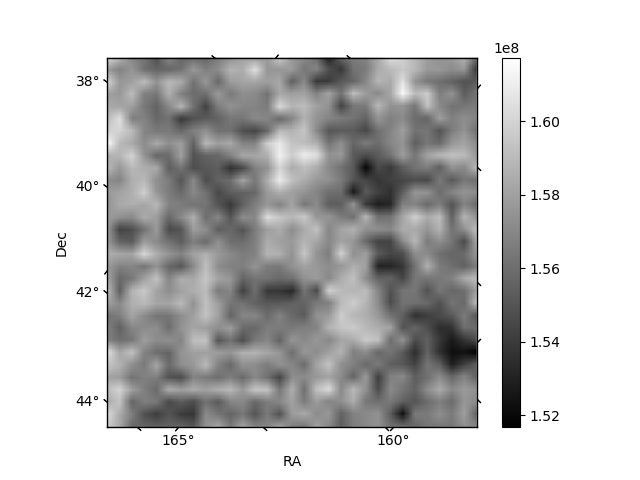
| Quadrant A | 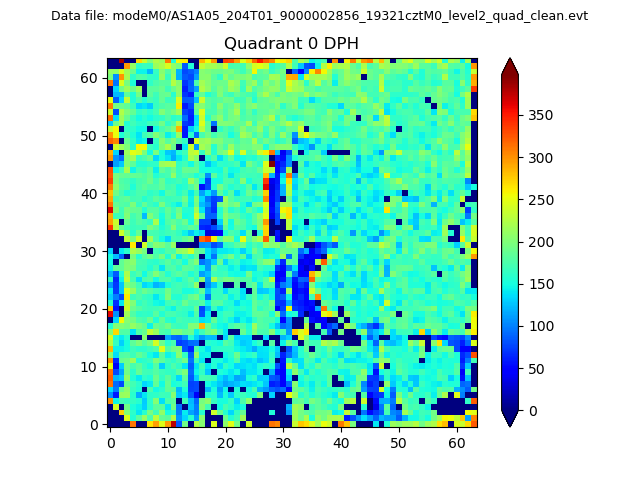 |
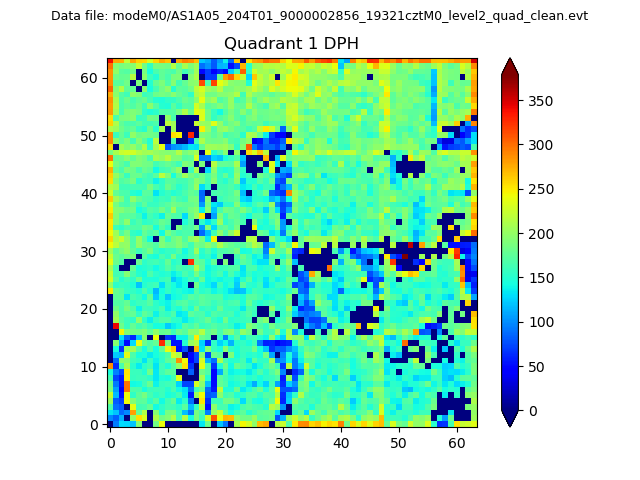 |
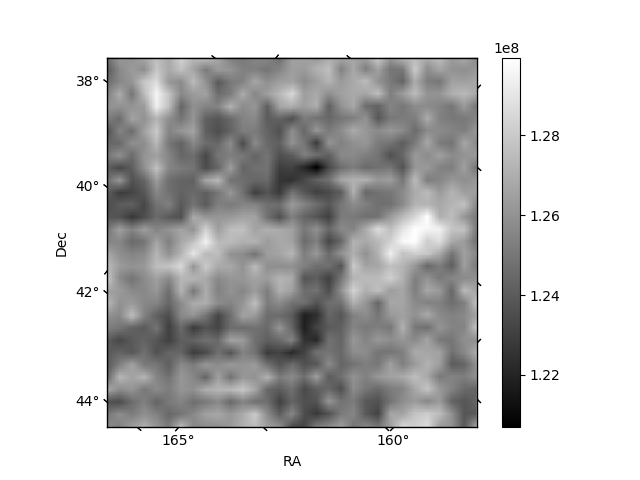
Quadrant B |
|---|---|---|---|
| Quadrant D | 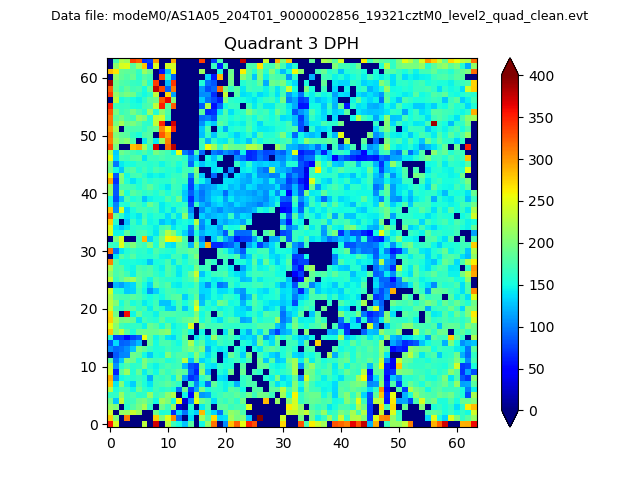 |
 |
Quadrant C |
| Plot type | Count rate plots | Images |
|---|---|---|
| Comparison with Poisson distribution Blue bars denote a histogram of data divided into 1 sec bins. Red curve is a Poisson curve with rate = median count rate of data. |
 |
 |
| Quadrant-wise count rates Data is divided into 100 sec bins |
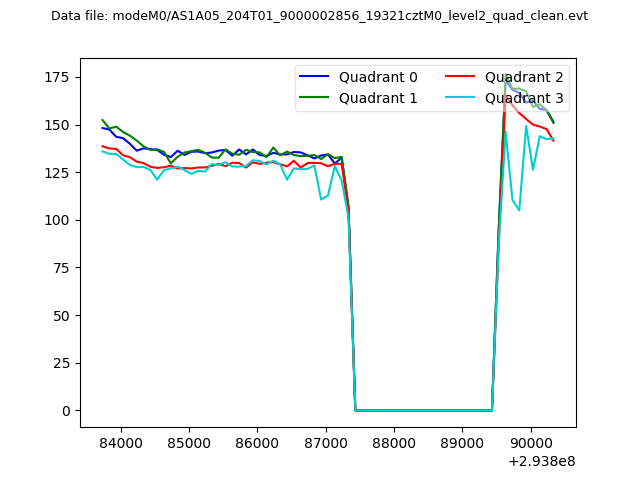 |
|
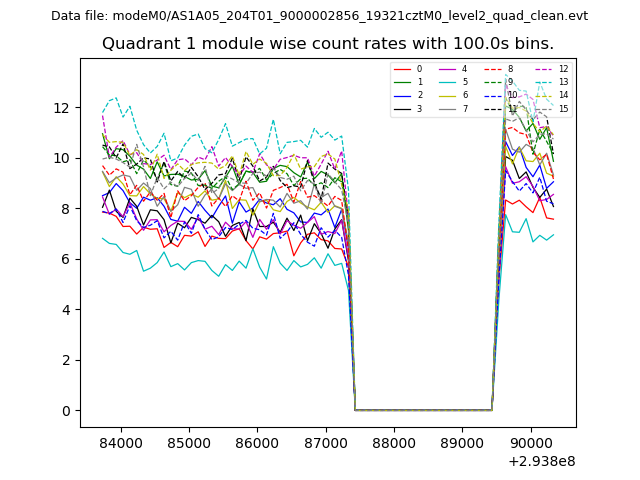
| Module-wise count rates for Quadrant A Data is divided into 100 sec bins |
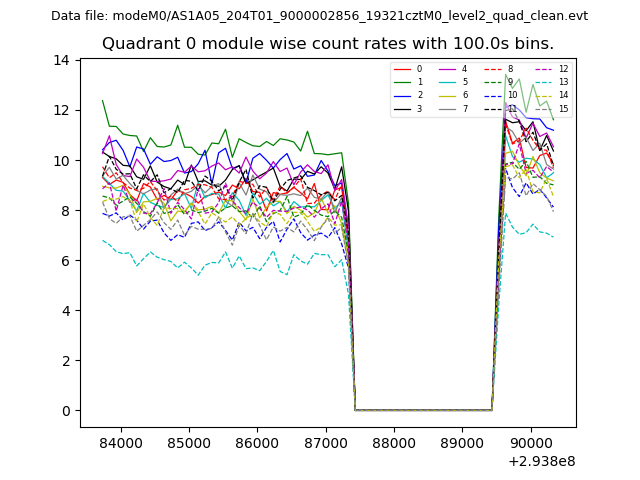 |
 |
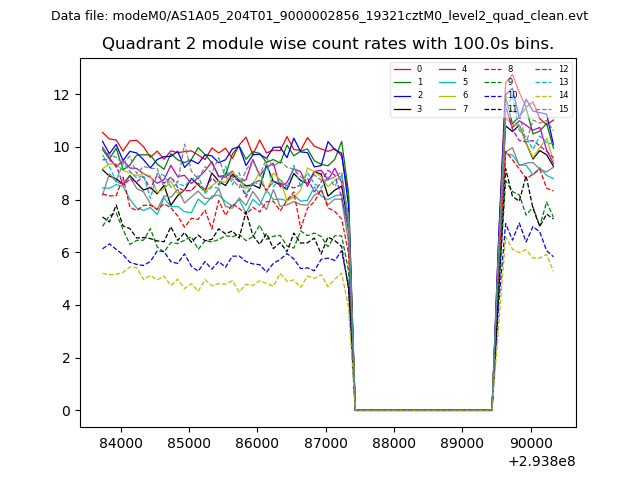
| Module-wise count rates for Quadrant B Data is divided into 100 sec bins |
 |
 |
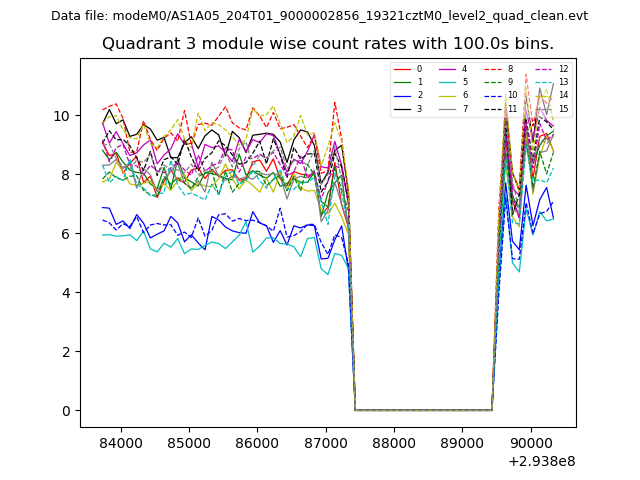
| Module-wise count rates for Quadrant C Data is divided into 100 sec bins |
 |
 |
| Module-wise count rates for Quadrant D Data is divided into 100 sec bins |
 |
 |
| Parameter | Plot |
|---|---|
| CZT HV Monitor | 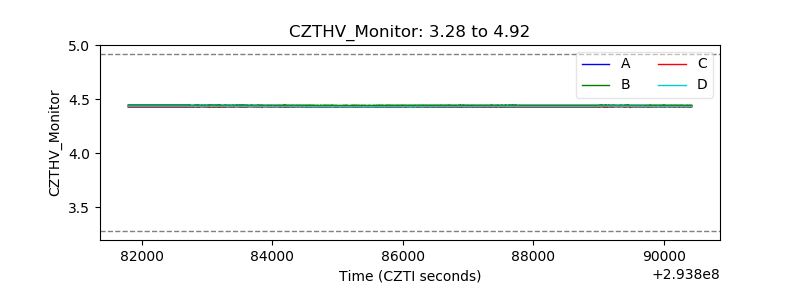 |
| D_VDD | 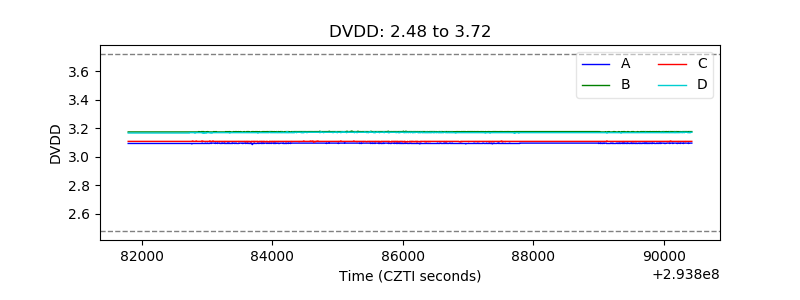 |
| Temperature 1 |  |
| Veto HV Monitor | 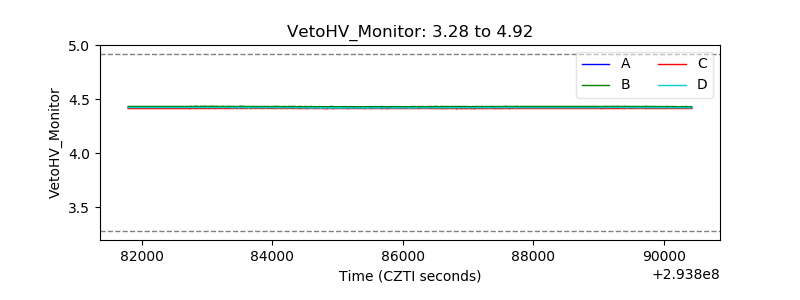 |
| Veto LLD | 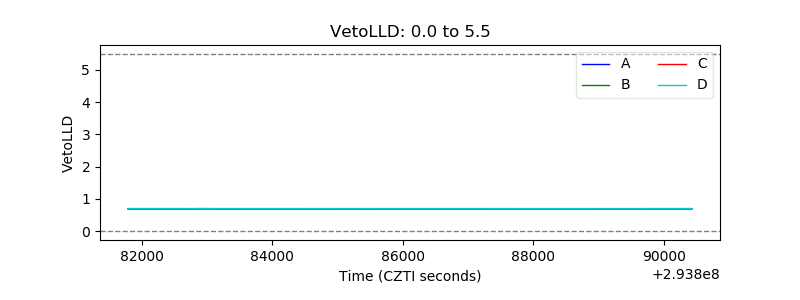 |
| Alpha Counter | 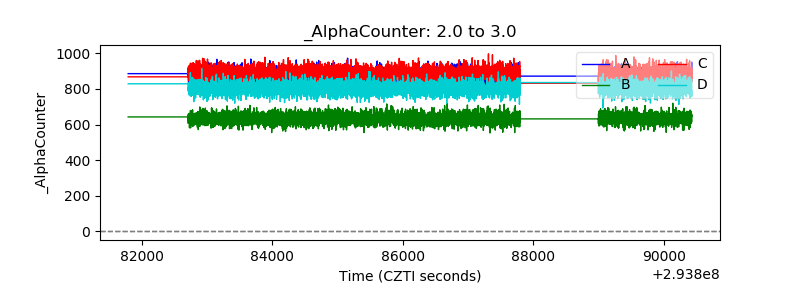 |
| _CPM_Rate | 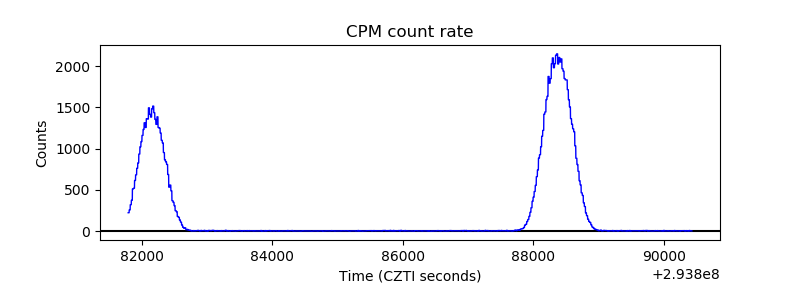 |
| CZT Counter | 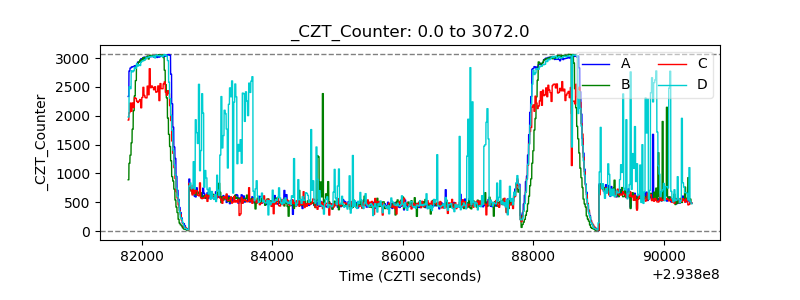 |
| +2.5 Volts monitor |  |
| +5 Volts monitor | 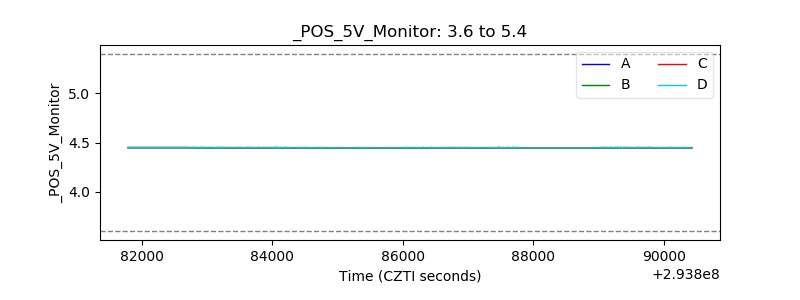 |
| _ROLL_ROT |  |
| _Roll_DEC |  |
| _Roll_RA | 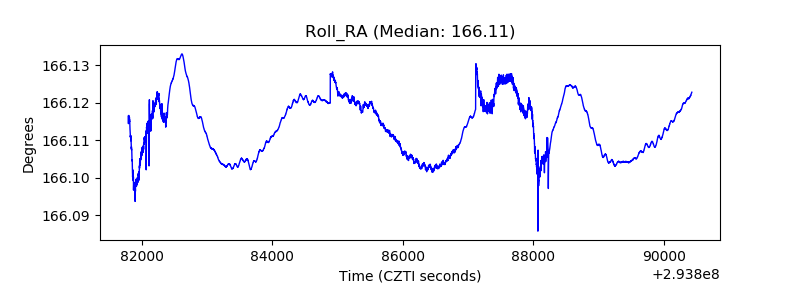 |
| Veto Counter | 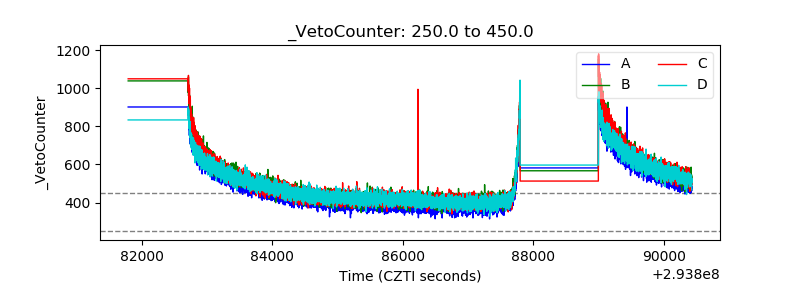 |