| Param | Original file | Final file |
|---|---|---|
| Filename | modeM0/AS1A05_204T01_9000002856_19322cztM0_level2.evt | modeM0/AS1A05_204T01_9000002856_19322cztM0_level2_quad_clean.evt |
| Size (bytes) | 530,389,440 | 110,329,920 |
| Size | 505.8 MB | 105.2 MB |
| Events in quadrant A | 3,475,727 | 756,088 |
| Events in quadrant B | 3,563,048 | 757,390 |
| Events in quadrant C | 3,419,721 | 715,792 |
| Events in quadrant D | 5,174,685 | 670,123 |
| Mode M0 | |||
|---|---|---|---|
| Quadrant | BADHDUFLAG | Total packets | Discarded packets |
| A | 0 | 14478 | 2 |
| B | 0 | 14770 | 2 |
| C | 0 | 14200 | 2 |
| D | 0 | 19649 | 2 |
| Mode M9 | |||
|---|---|---|---|
| Quadrant | BADHDUFLAG | Total packets | Discarded packets |
| A | 0 | 18 | 0 |
| B | 0 | 19 | 0 |
| C | 0 | 19 | 0 |
| D | 0 | 19 | 0 |
| Mode SS | |||
|---|---|---|---|
| Quadrant | BADHDUFLAG | Total packets | Discarded packets |
| A | 0 | 128 | 0 |
| B | 0 | 128 | 0 |
| C | 0 | 128 | 0 |
| D | 0 | 128 | 0 |
| Quadrant | Total seconds | Saturated seconds | Saturation percentage |
|---|---|---|---|
| A | 6335 | 86 | 1.357537% |
| B | 6335 | 94 | 1.483820% |
| C | 6335 | 117 | 1.846882% |
| D | 6335 | 749 | 11.823204% |
Noise dominated data is calculated using 1-second bins in cleaned event files. If a bin has >2000 counts, and if more than 50% of those come from <1% of pixels, then it is considered to be noise-dominated and hence unusable.
| Quadrant | # 1 sec bins | Bins with >0 counts | Bins with >2000 counts | High rate bins dominated by noise | Noise dominated (total time) | Noise dominated (detector-on time) | Marked lightcurve |
|---|---|---|---|---|---|---|---|
| A | 7625 | 6335 | 6 | 6 | 0.08% | 0.09% | 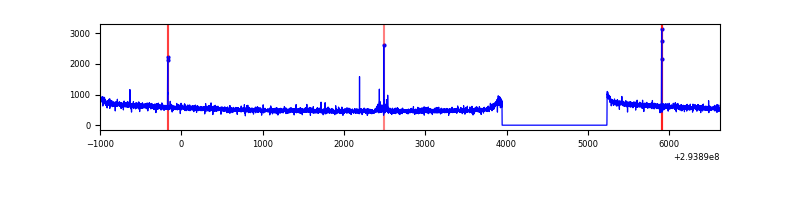 |
| B | 7625 | 6335 | 13 | 13 | 0.17% | 0.21% | 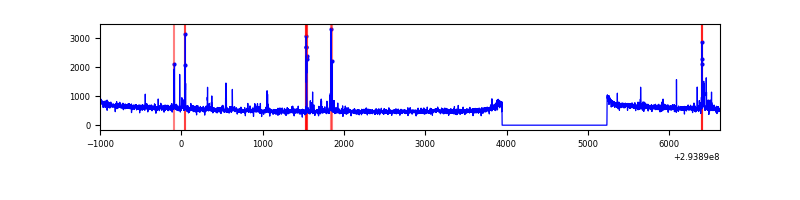 |
| C | 7625 | 6335 | 0 | 0 | 0.00% | 0.00% | 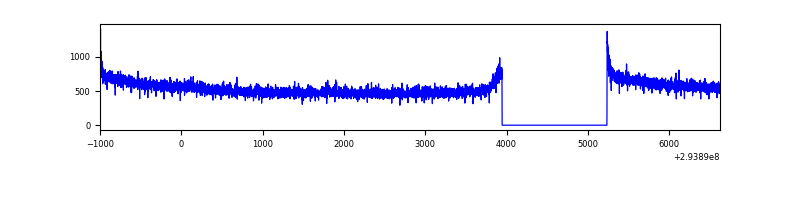 |
| D | 7625 | 6335 | 621 | 621 | 8.14% | 9.80% | 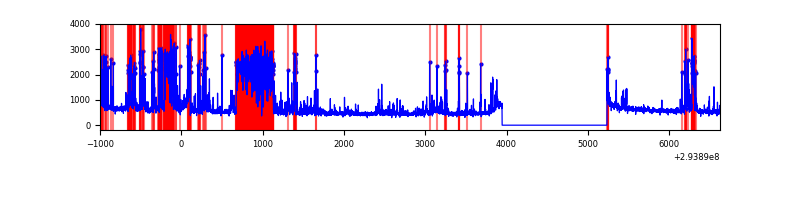 |
Top three noisy pixels from each quadrant. If the there are fewer than three noisy pixels in the level2.evt file, extra rows are filled as -1
| Pixel properties | Quadrant properties | ||||||
|---|---|---|---|---|---|---|---|
| Quadrant | DetID | PixID | Counts | Sigma | Mean | Median | Sigma |
| A | 5 | 16 | 16678 | 89.87 | 890 | 874 | 175.8 |
| A | 11 | 29 | 12926 | 68.54 | 890 | 874 | 175.8 |
| A | 9 | 143 | 11191 | 58.67 | 890 | 874 | 175.8 |
| B | 3 | 64 | 34680 | 209.65 | 866 | 847 | 161.4 |
| B | 0 | 190 | 28172 | 169.32 | 866 | 847 | 161.4 |
| B | 0 | 229 | 27543 | 165.42 | 866 | 847 | 161.4 |
| C | 14 | 238 | 133561 | 692.3 | 835 | 842 | 191.7 |
| C | 3 | 233 | 32543 | 165.36 | 835 | 842 | 191.7 |
| C | 13 | 61 | 5874 | 26.25 | 835 | 842 | 191.7 |
| D | 1 | 52 | 1226895 | 6206.5 | 821 | 798 | 197.6 |
| D | 7 | 238 | 525572 | 2656.4 | 821 | 798 | 197.6 |
| D | 11 | 176 | 276982 | 1398.04 | 821 | 798 | 197.6 |
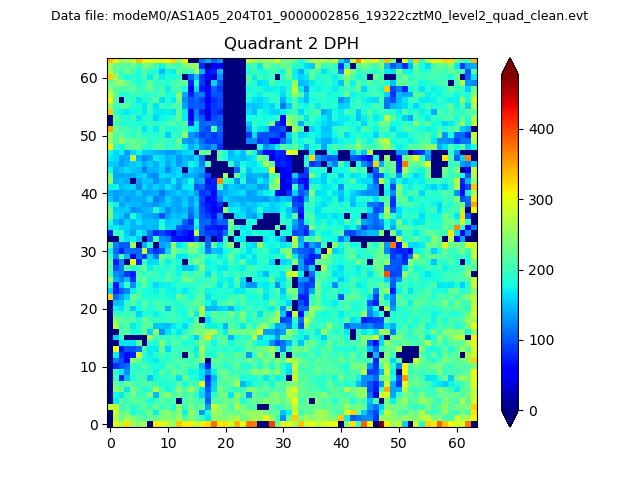
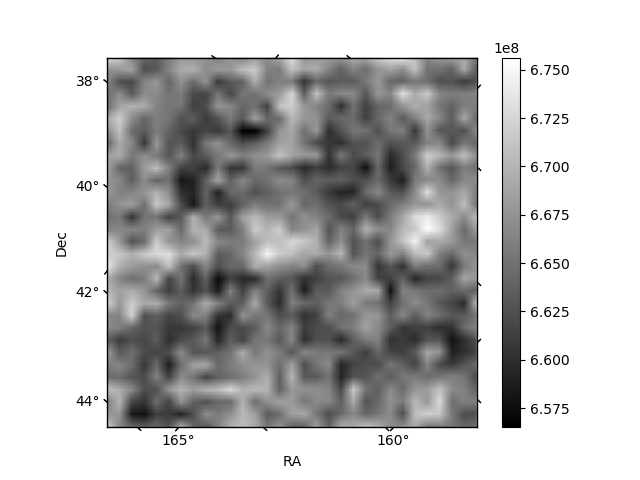
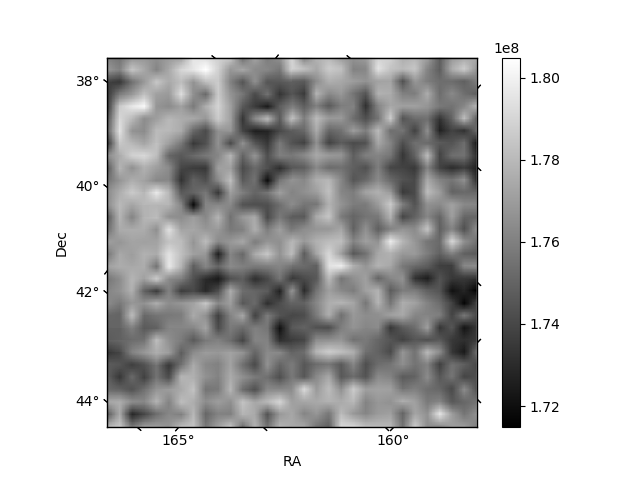
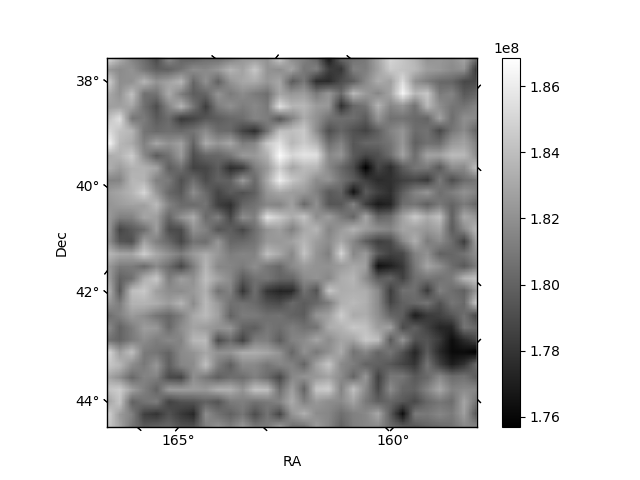
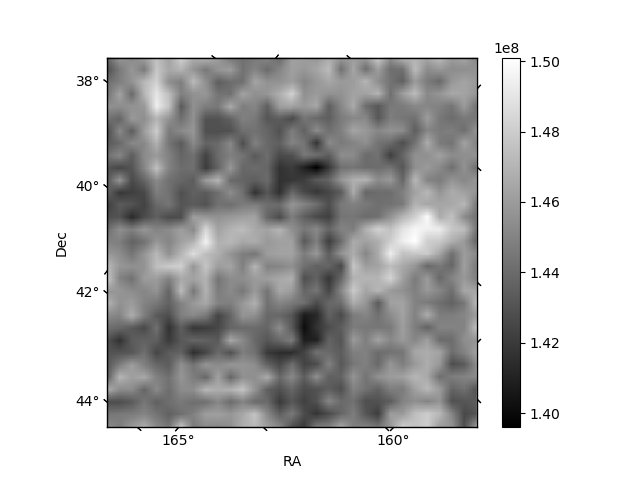
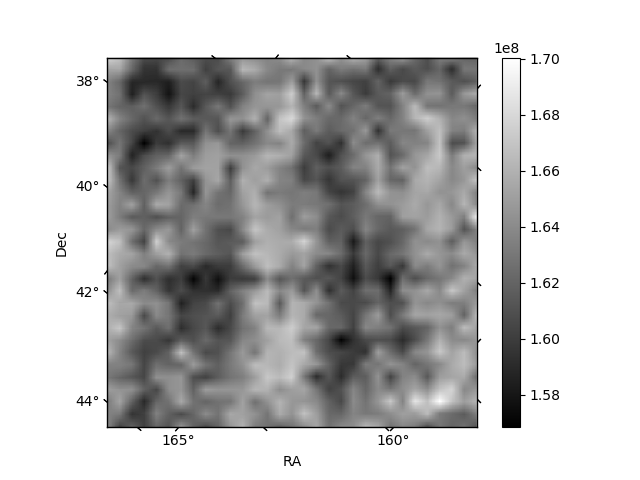
Histogram calculated using DETX and DETY for each event in the final _common_clean file
| Quadrant A | 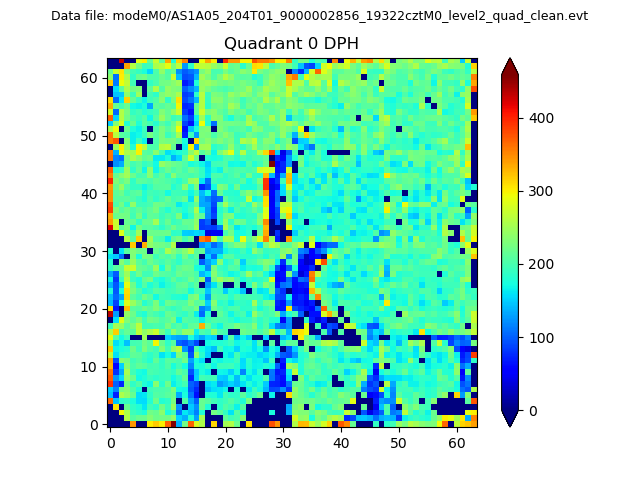 |
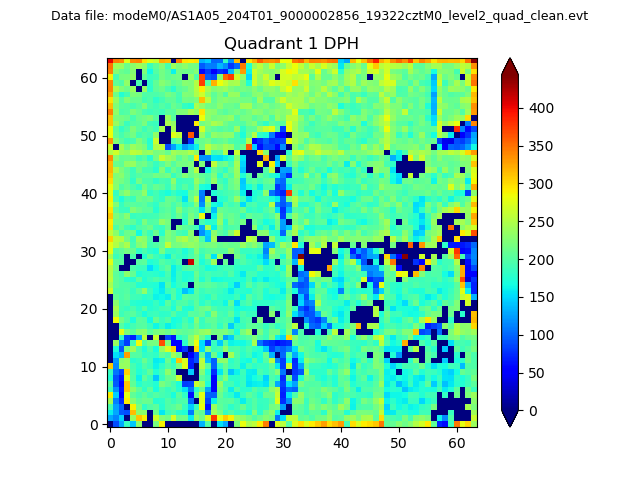 |
Quadrant B |
|---|---|---|---|
| Quadrant D | 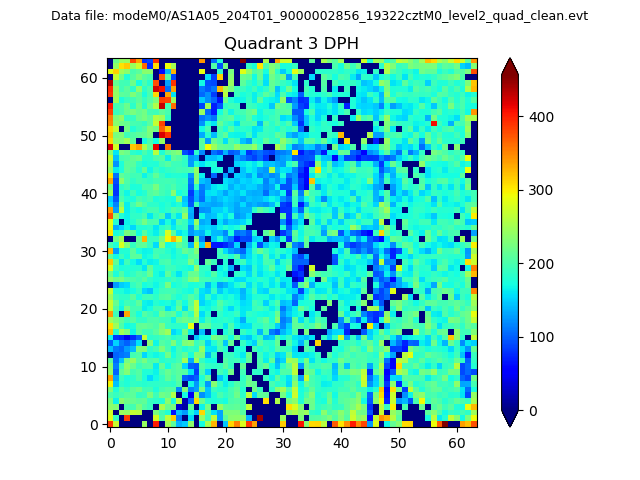 |
 |
Quadrant C |
| Plot type | Count rate plots | Images |
|---|---|---|
| Comparison with Poisson distribution Blue bars denote a histogram of data divided into 1 sec bins. Red curve is a Poisson curve with rate = median count rate of data. |
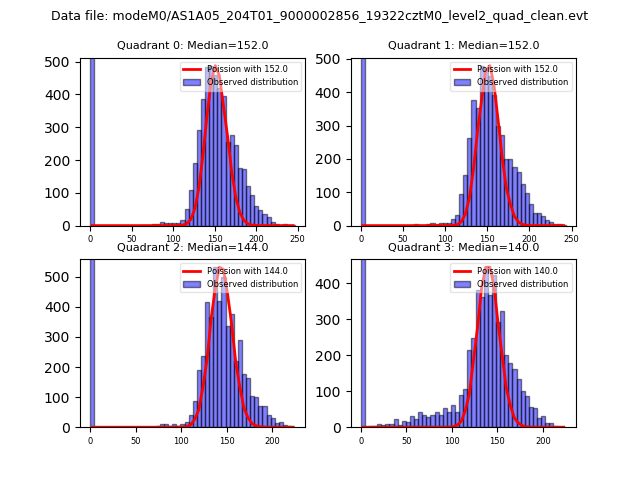 |
 |
| Quadrant-wise count rates Data is divided into 100 sec bins |
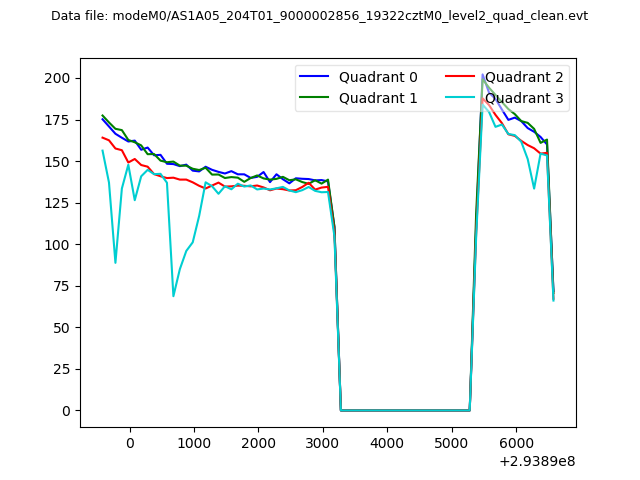 |
|
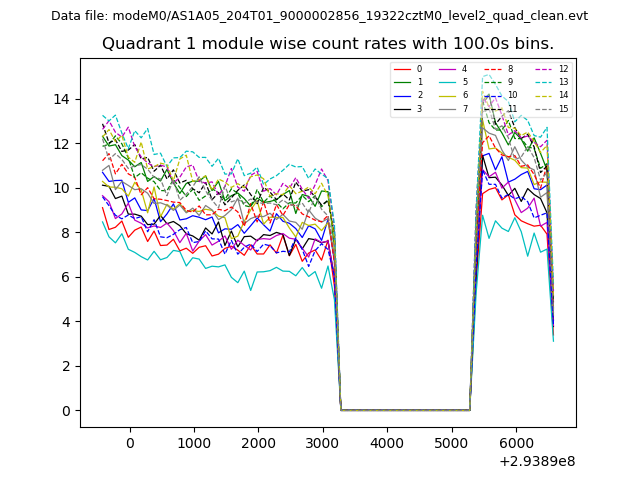
| Module-wise count rates for Quadrant A Data is divided into 100 sec bins |
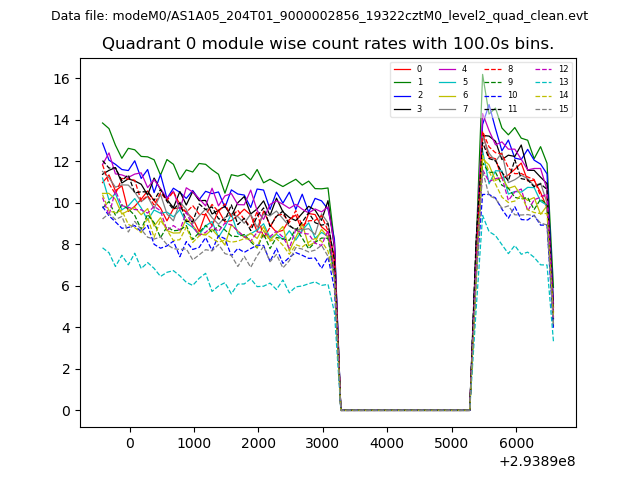 |
 |
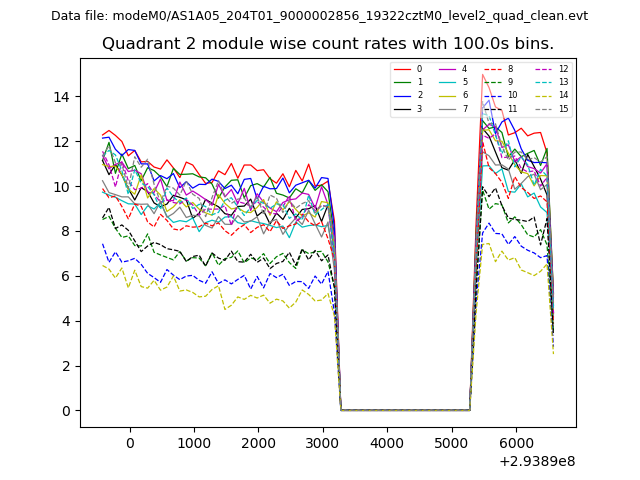
| Module-wise count rates for Quadrant B Data is divided into 100 sec bins |
 |
 |
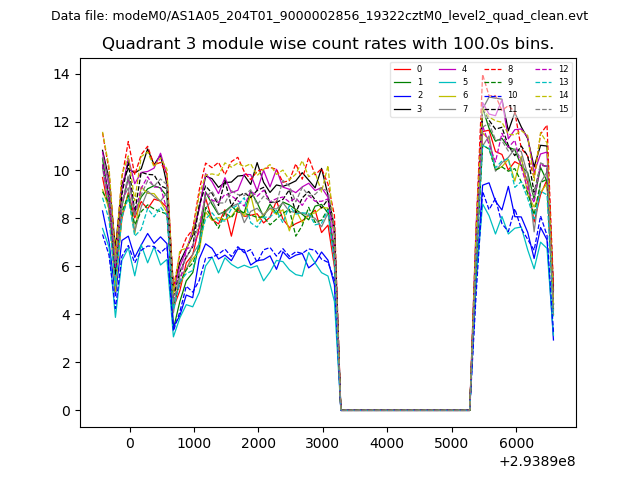
| Module-wise count rates for Quadrant C Data is divided into 100 sec bins |
 |
 |
| Module-wise count rates for Quadrant D Data is divided into 100 sec bins |
 |
 |
| Parameter | Plot |
|---|---|
| CZT HV Monitor | 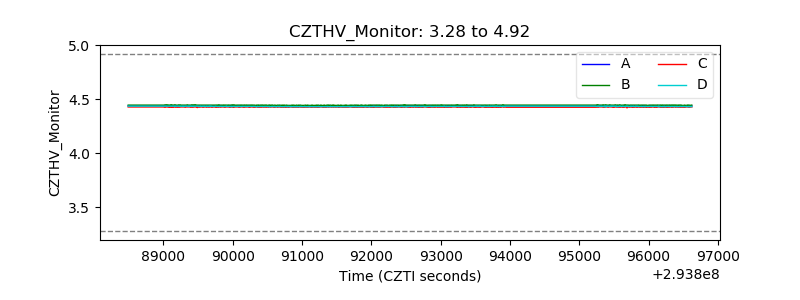 |
| D_VDD | 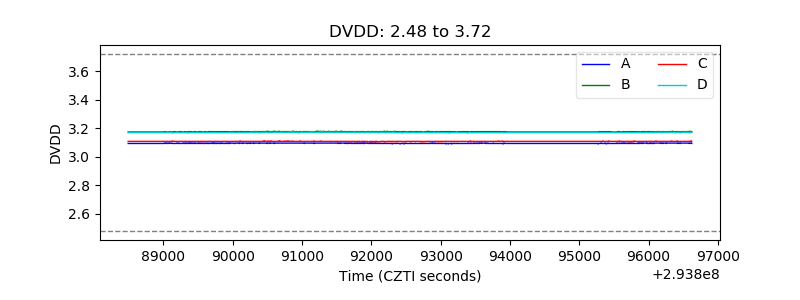 |
| Temperature 1 | 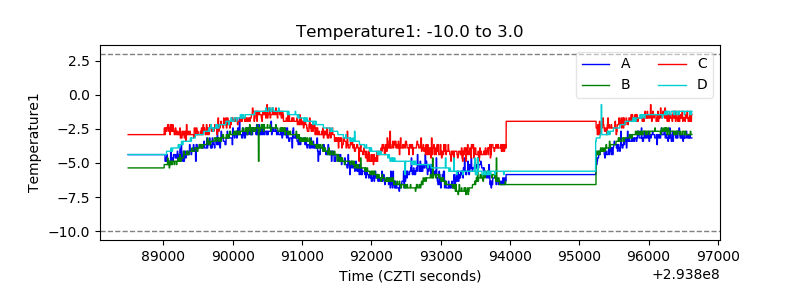 |
| Veto HV Monitor | 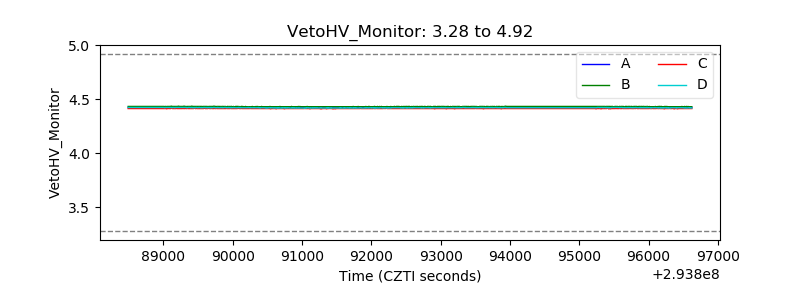 |
| Veto LLD | 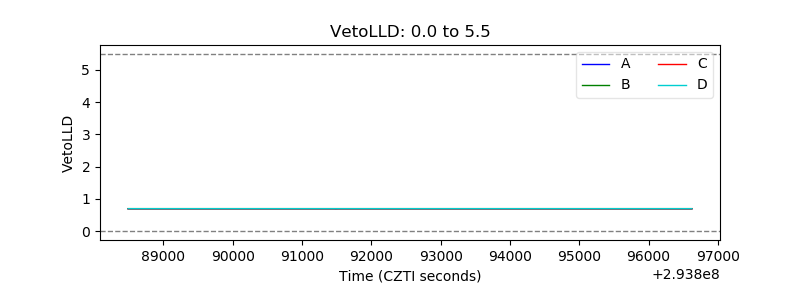 |
| Alpha Counter | 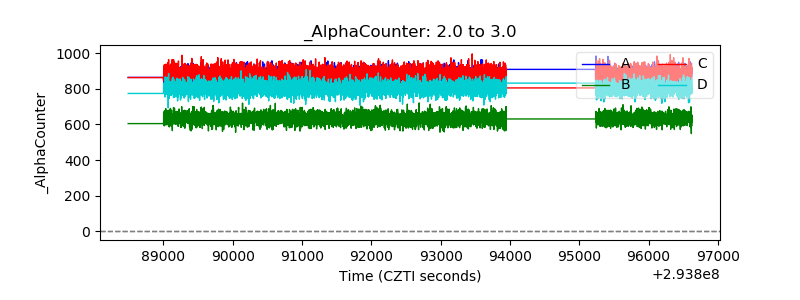 |
| _CPM_Rate | 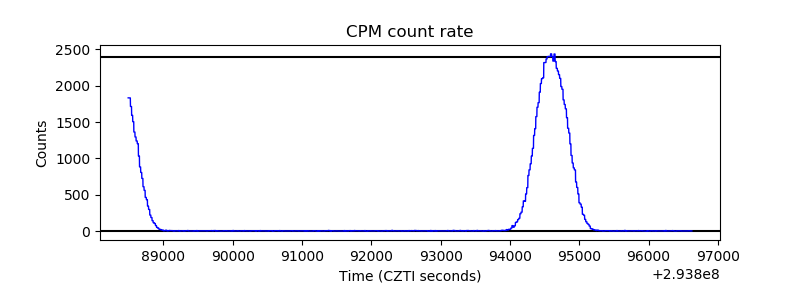 |
| CZT Counter | 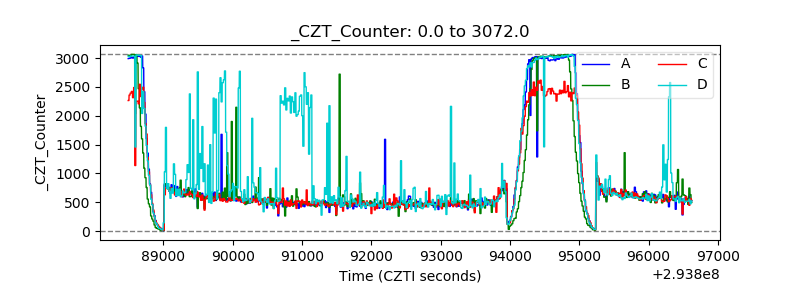 |
| +2.5 Volts monitor |  |
| +5 Volts monitor |  |
| _ROLL_ROT | 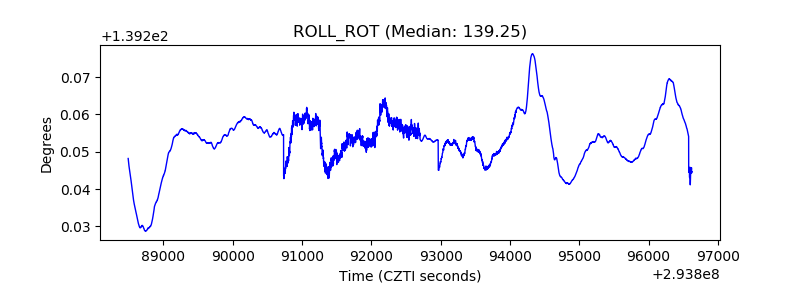 |
| _Roll_DEC | 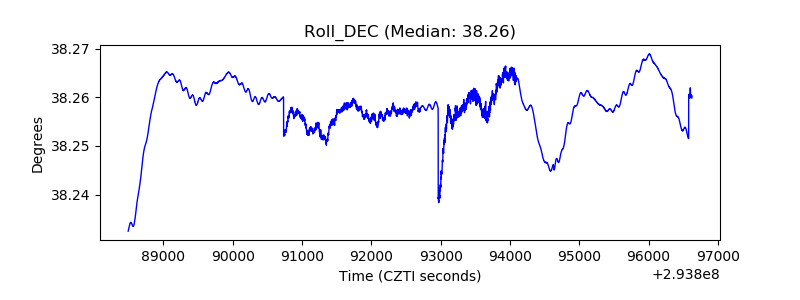 |
| _Roll_RA | 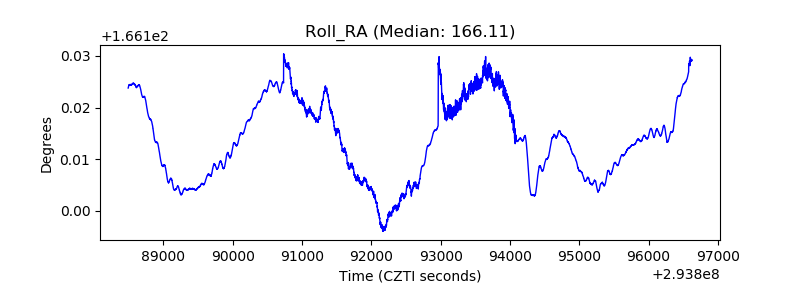 |
| Veto Counter | 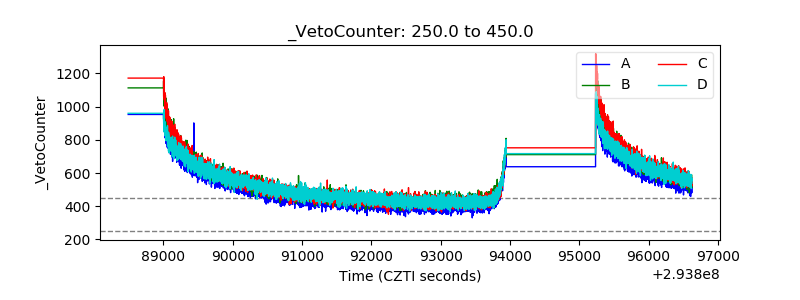 |