| Param | Original file | Final file |
|---|---|---|
| Filename | modeM0/AS1A05_204T01_9000002856_19323cztM0_level2.evt | modeM0/AS1A05_204T01_9000002856_19323cztM0_level2_quad_clean.evt |
| Size (bytes) | 524,390,400 | 118,650,240 |
| Size | 500.1 MB | 113.2 MB |
| Events in quadrant A | 3,342,270 | 834,156 |
| Events in quadrant B | 3,380,367 | 835,151 |
| Events in quadrant C | 3,329,532 | 792,176 |
| Events in quadrant D | 5,409,166 | 699,919 |
| Mode M0 | |||
|---|---|---|---|
| Quadrant | BADHDUFLAG | Total packets | Discarded packets |
| A | 0 | 13908 | 1 |
| B | 0 | 14029 | 1 |
| C | 0 | 13787 | 1 |
| D | 0 | 20195 | 2 |
| Mode M9 | |||
|---|---|---|---|
| Quadrant | BADHDUFLAG | Total packets | Discarded packets |
| A | 0 | 14 | 0 |
| B | 0 | 14 | 0 |
| C | 0 | 14 | 0 |
| D | 0 | 14 | 0 |
| Mode SS | |||
|---|---|---|---|
| Quadrant | BADHDUFLAG | Total packets | Discarded packets |
| A | 0 | 124 | 0 |
| B | 0 | 124 | 0 |
| C | 0 | 124 | 0 |
| D | 0 | 124 | 0 |
| Quadrant | Total seconds | Saturated seconds | Saturation percentage |
|---|---|---|---|
| A | 6193 | 91 | 1.469401% |
| B | 6194 | 96 | 1.549887% |
| C | 6194 | 127 | 2.050371% |
| D | 6193 | 1009 | 16.292588% |
Noise dominated data is calculated using 1-second bins in cleaned event files. If a bin has >2000 counts, and if more than 50% of those come from <1% of pixels, then it is considered to be noise-dominated and hence unusable.
| Quadrant | # 1 sec bins | Bins with >0 counts | Bins with >2000 counts | High rate bins dominated by noise | Noise dominated (total time) | Noise dominated (detector-on time) | Marked lightcurve |
|---|---|---|---|---|---|---|---|
| A | 7533 | 6193 | 4 | 4 | 0.05% | 0.06% |  |
| B | 7534 | 6194 | 6 | 6 | 0.08% | 0.10% |  |
| C | 7534 | 6194 | 0 | 0 | 0.00% | 0.00% | 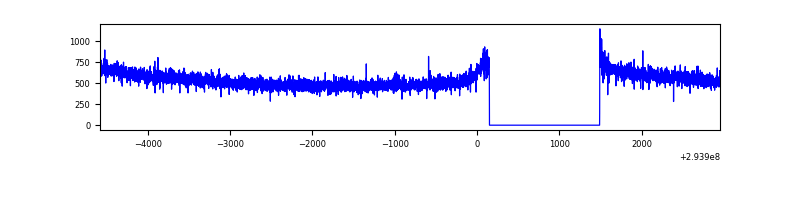 |
| D | 7533 | 6193 | 791 | 791 | 10.50% | 12.77% | 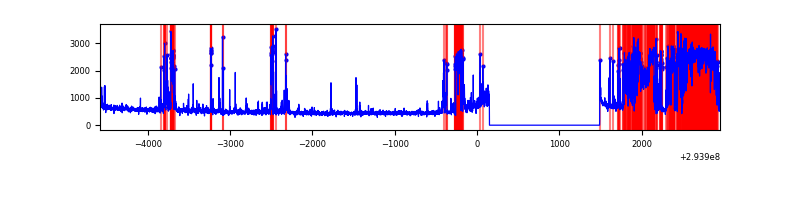 |
Top three noisy pixels from each quadrant. If the there are fewer than three noisy pixels in the level2.evt file, extra rows are filled as -1
| Pixel properties | Quadrant properties | ||||||
|---|---|---|---|---|---|---|---|
| Quadrant | DetID | PixID | Counts | Sigma | Mean | Median | Sigma |
| A | 11 | 29 | 14729 | 81.36 | 858 | 843 | 170.7 |
| A | 5 | 16 | 13659 | 75.09 | 858 | 843 | 170.7 |
| A | 9 | 143 | 11120 | 60.22 | 858 | 843 | 170.7 |
| B | 15 | 32 | 34431 | 216.93 | 838 | 819 | 154.9 |
| B | 0 | 190 | 25802 | 161.24 | 838 | 819 | 154.9 |
| B | 0 | 229 | 23987 | 149.53 | 838 | 819 | 154.9 |
| C | 14 | 238 | 130679 | 692.5 | 816 | 824 | 187.5 |
| C | 3 | 233 | 16524 | 83.73 | 816 | 824 | 187.5 |
| C | 13 | 61 | 5729 | 26.16 | 816 | 824 | 187.5 |
| D | 7 | 238 | 2247971 | 12350.91 | 762 | 743 | 181.9 |
| D | 11 | 176 | 159502 | 872.55 | 762 | 743 | 181.9 |
| D | 1 | 52 | 44149 | 238.56 | 762 | 743 | 181.9 |
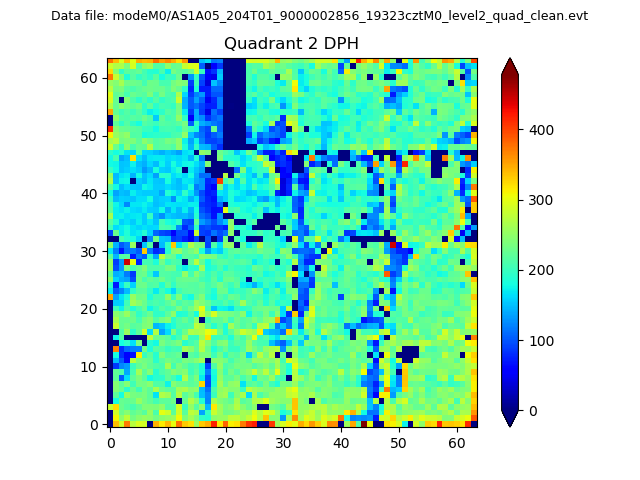
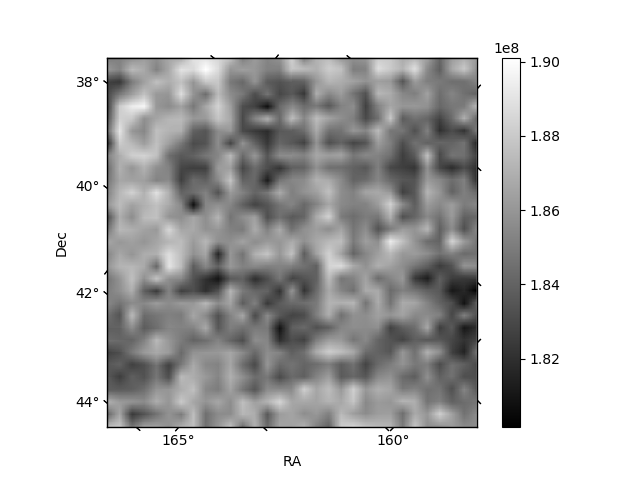
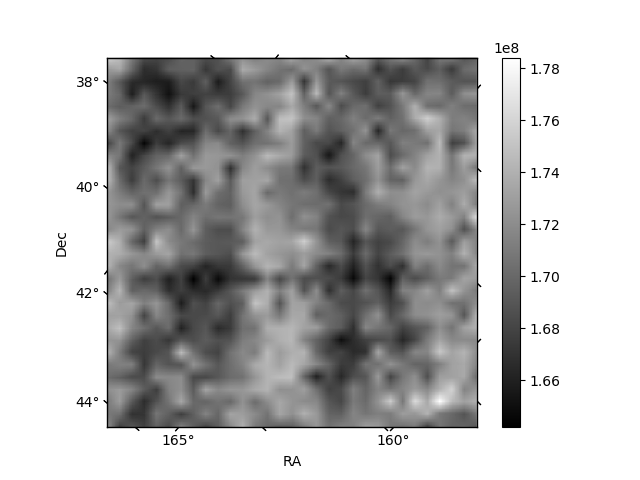
Histogram calculated using DETX and DETY for each event in the final _common_clean file
| Quadrant A | 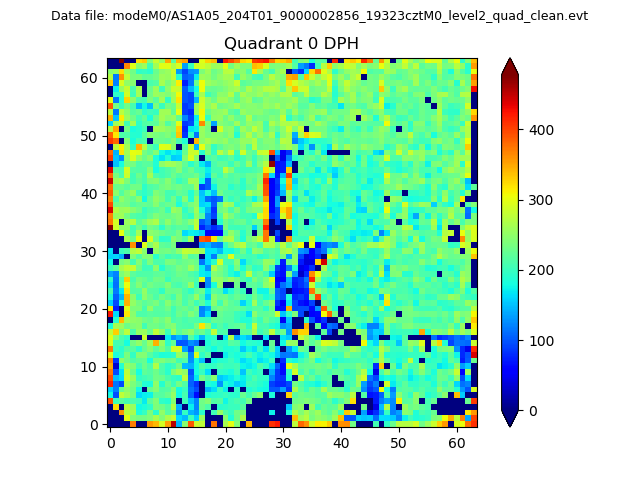 |
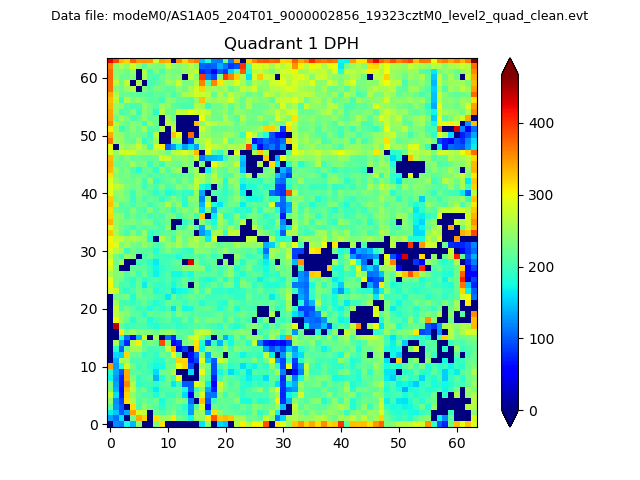 |
Quadrant B |
|---|---|---|---|
| Quadrant D | 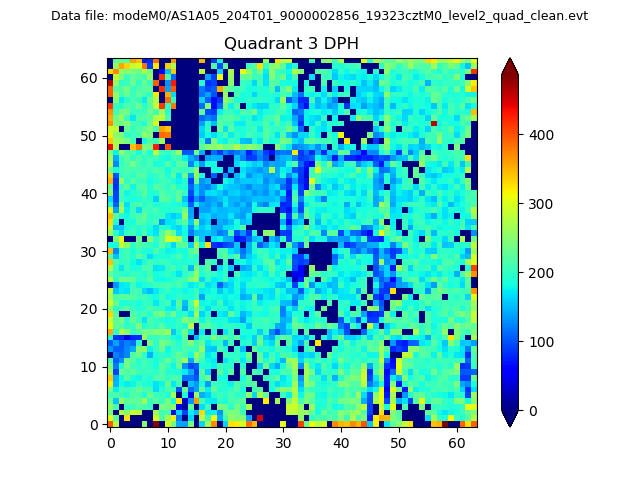 |
 |
Quadrant C |
| Plot type | Count rate plots | Images |
|---|---|---|
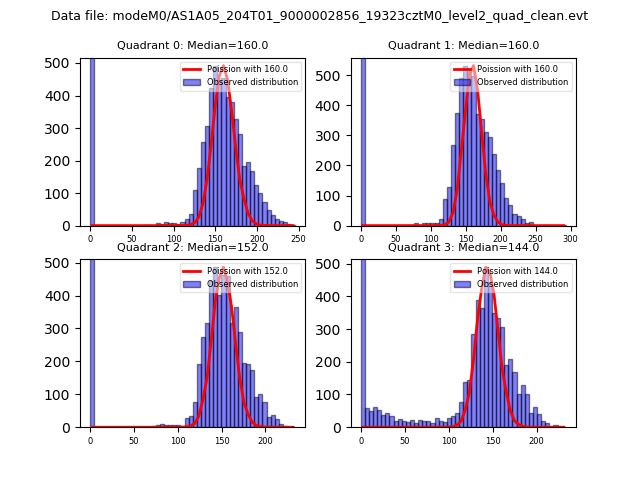
| Comparison with Poisson distribution Blue bars denote a histogram of data divided into 1 sec bins. Red curve is a Poisson curve with rate = median count rate of data. |
 |
 |
| Quadrant-wise count rates Data is divided into 100 sec bins |
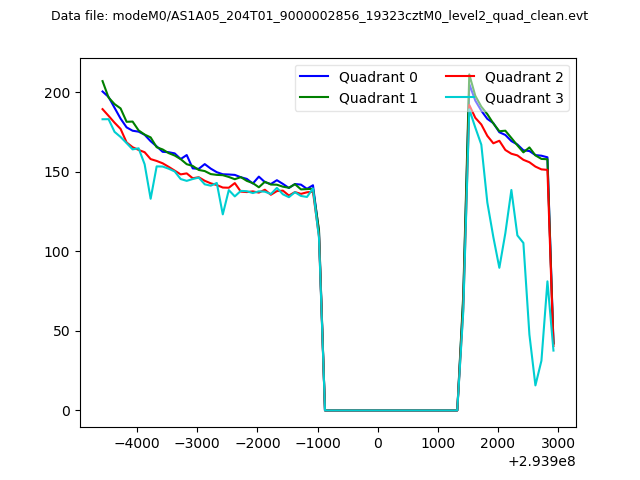 |
|
| Module-wise count rates for Quadrant A Data is divided into 100 sec bins |
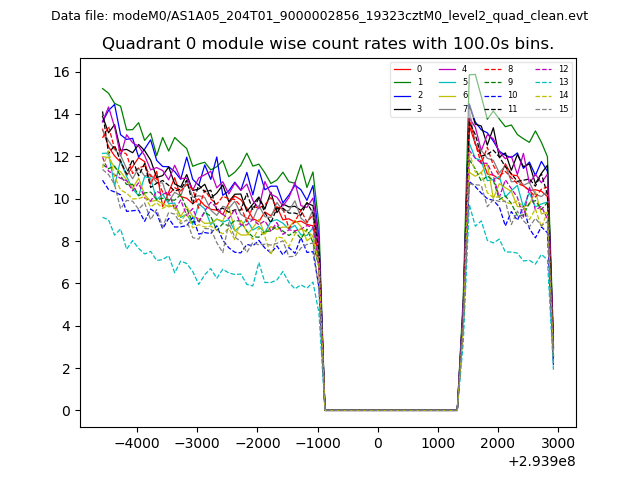 |
 |
| Module-wise count rates for Quadrant B Data is divided into 100 sec bins |
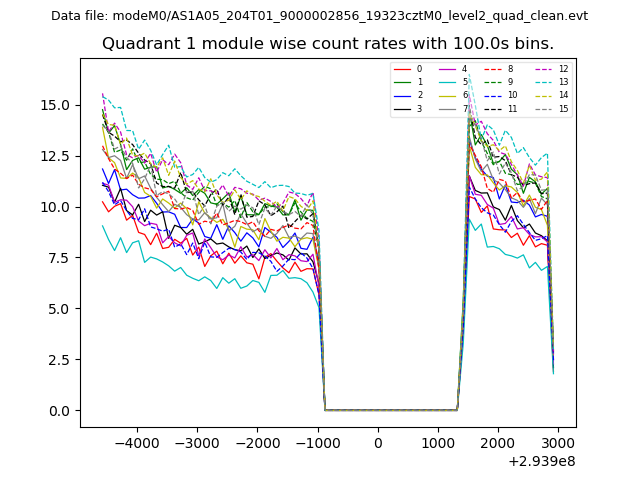 |
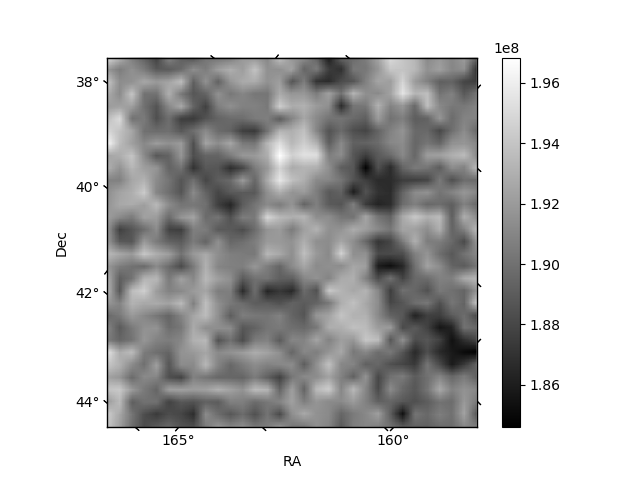 |
| Module-wise count rates for Quadrant C Data is divided into 100 sec bins |
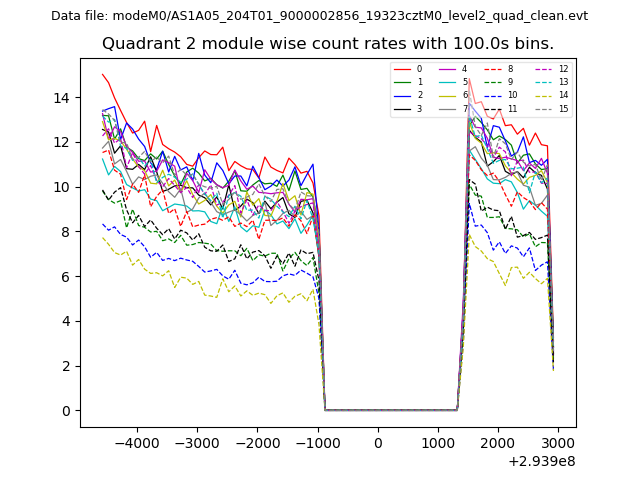 |
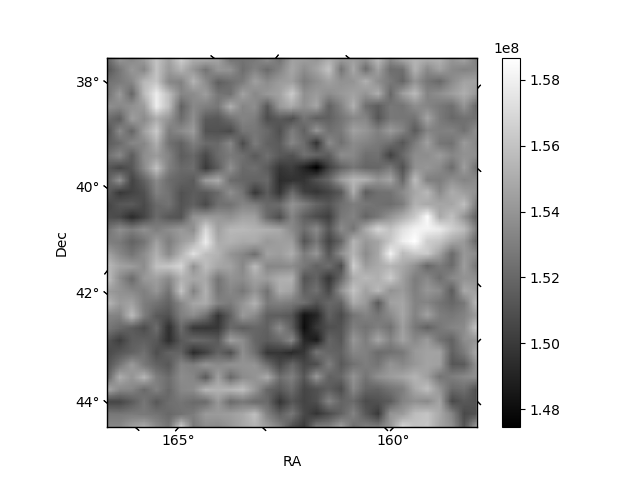 |
| Module-wise count rates for Quadrant D Data is divided into 100 sec bins |
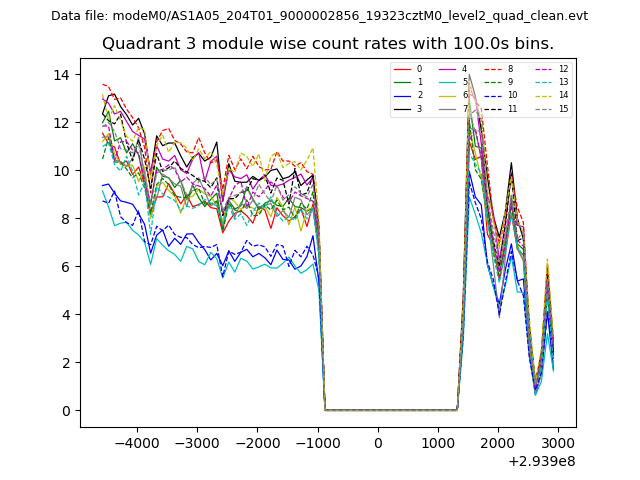 |
 |
| Parameter | Plot |
|---|---|
| CZT HV Monitor | 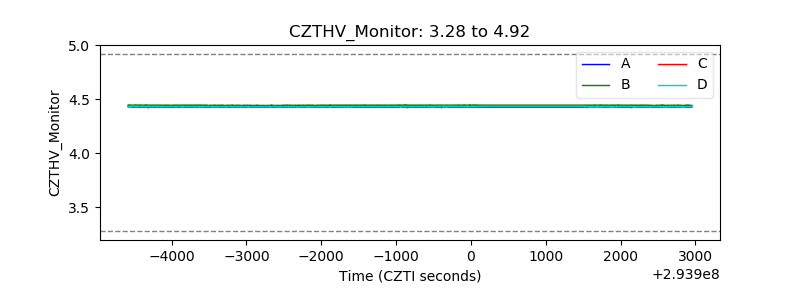 |
| D_VDD | 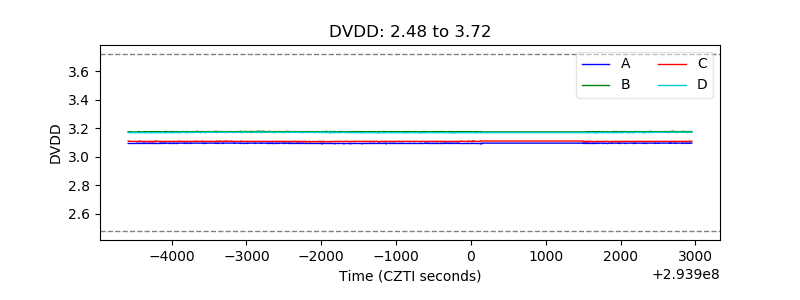 |
| Temperature 1 | 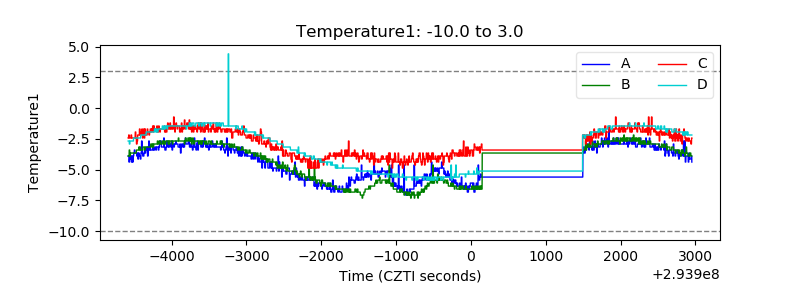 |
| Veto HV Monitor | 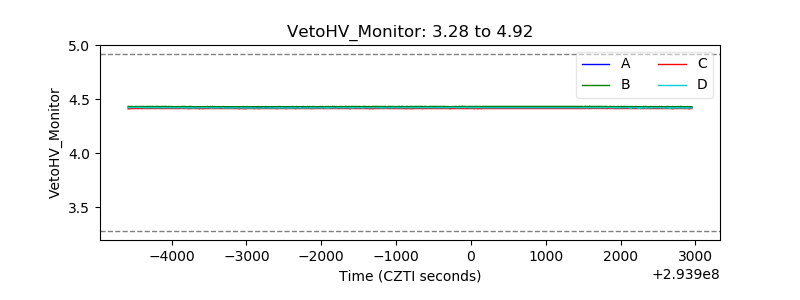 |
| Veto LLD | 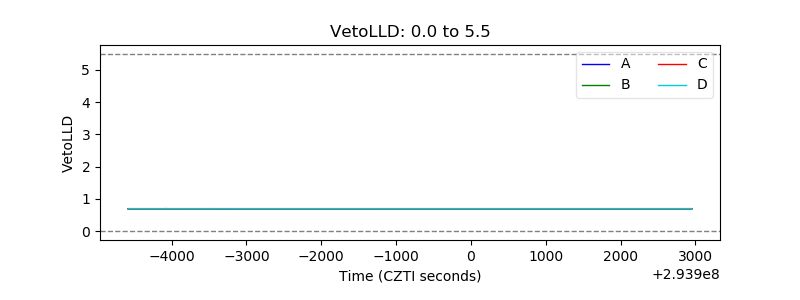 |
| Alpha Counter | 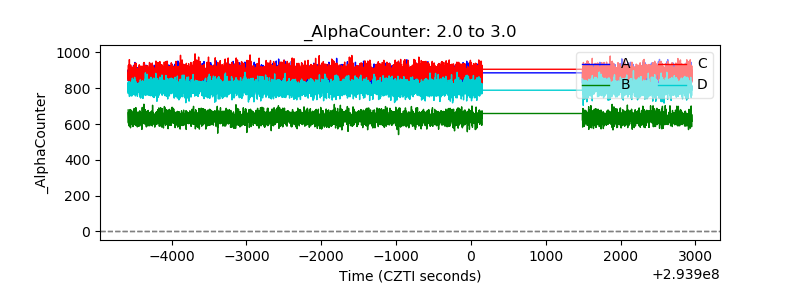 |
| _CPM_Rate | 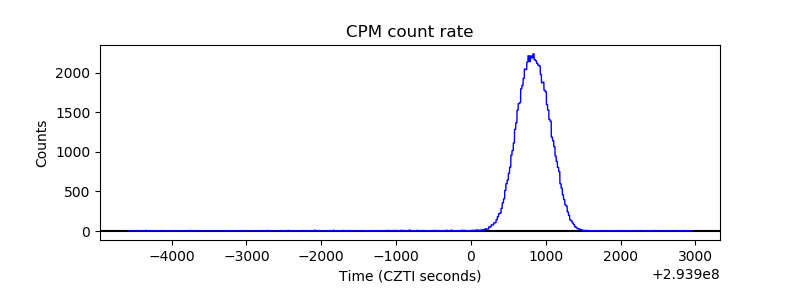 |
| CZT Counter | 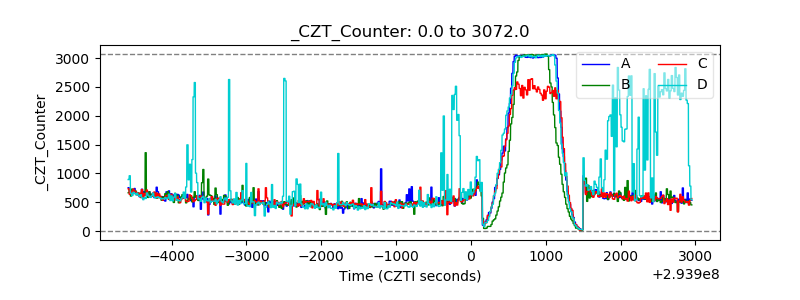 |
| +2.5 Volts monitor | 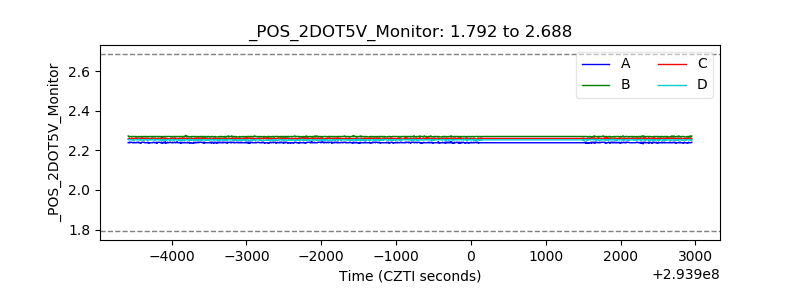 |
| +5 Volts monitor |  |
| _ROLL_ROT | 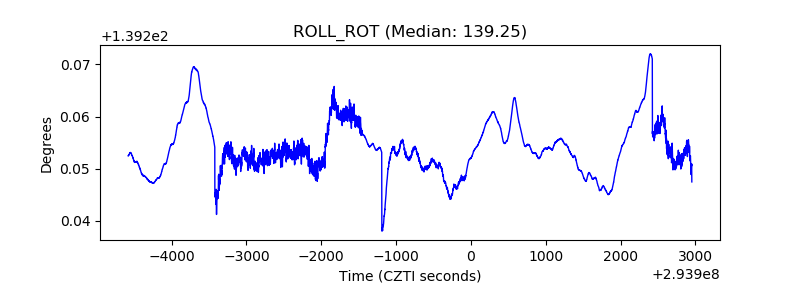 |
| _Roll_DEC |  |
| _Roll_RA | 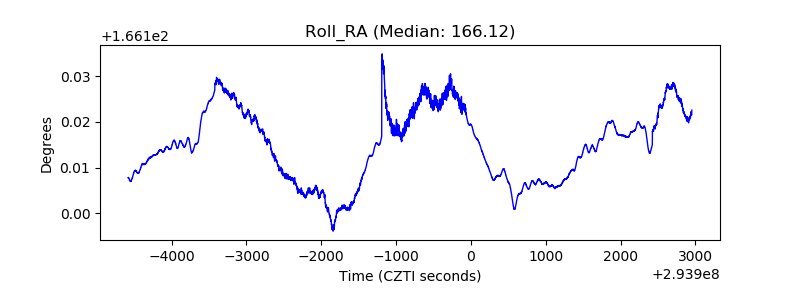 |
| Veto Counter | 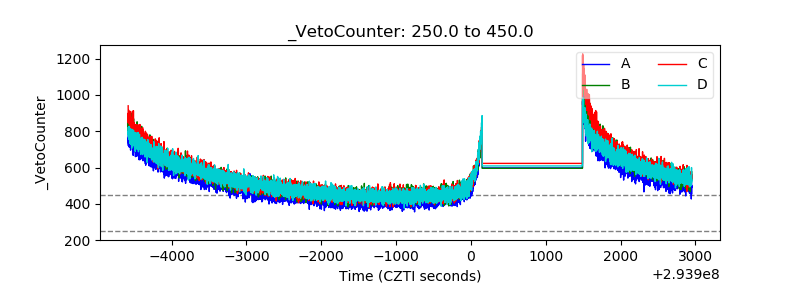 |