| Param | Original file | Final file |
|---|---|---|
| Filename | modeM0/AS1A05_204T01_9000002856_19324cztM0_level2.evt | modeM0/AS1A05_204T01_9000002856_19324cztM0_level2_quad_clean.evt |
| Size (bytes) | 709,891,200 | 96,168,960 |
| Size | 677.0 MB | 91.7 MB |
| Events in quadrant A | 3,121,112 | 711,017 |
| Events in quadrant B | 3,183,660 | 710,983 |
| Events in quadrant C | 3,207,582 | 682,362 |
| Events in quadrant D | 11,578,988 | 386,135 |
| Mode M0 | |||
|---|---|---|---|
| Quadrant | BADHDUFLAG | Total packets | Discarded packets |
| A | 0 | 13046 | 1 |
| B | 0 | 13232 | 1 |
| C | 0 | 13198 | 1 |
| D | 0 | 38540 | 2 |
| Mode M9 | |||
|---|---|---|---|
| Quadrant | BADHDUFLAG | Total packets | Discarded packets |
| A | 0 | 13 | 0 |
| B | 0 | 13 | 0 |
| C | 0 | 13 | 0 |
| D | 0 | 13 | 0 |
| Mode SS | |||
|---|---|---|---|
| Quadrant | BADHDUFLAG | Total packets | Discarded packets |
| A | 0 | 122 | 0 |
| B | 0 | 122 | 0 |
| C | 0 | 122 | 0 |
| D | 0 | 122 | 0 |
| Quadrant | Total seconds | Saturated seconds | Saturation percentage |
|---|---|---|---|
| A | 6023 | 89 | 1.477669% |
| B | 6024 | 100 | 1.660027% |
| C | 6024 | 134 | 2.224436% |
| D | 6023 | 3747 | 62.211522% |
Noise dominated data is calculated using 1-second bins in cleaned event files. If a bin has >2000 counts, and if more than 50% of those come from <1% of pixels, then it is considered to be noise-dominated and hence unusable.
| Quadrant | # 1 sec bins | Bins with >0 counts | Bins with >2000 counts | High rate bins dominated by noise | Noise dominated (total time) | Noise dominated (detector-on time) | Marked lightcurve |
|---|---|---|---|---|---|---|---|
| A | 7343 | 6023 | 0 | 0 | 0.00% | 0.00% | 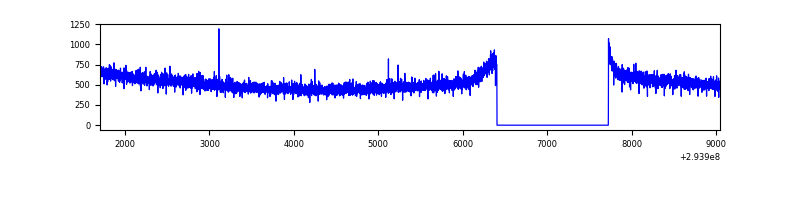 |
| B | 7344 | 6025 | 3 | 3 | 0.04% | 0.05% | 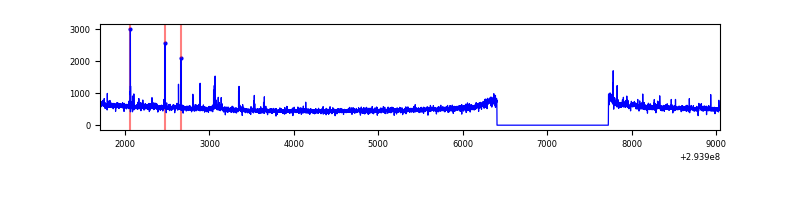 |
| C | 7344 | 6024 | 0 | 0 | 0.00% | 0.00% | 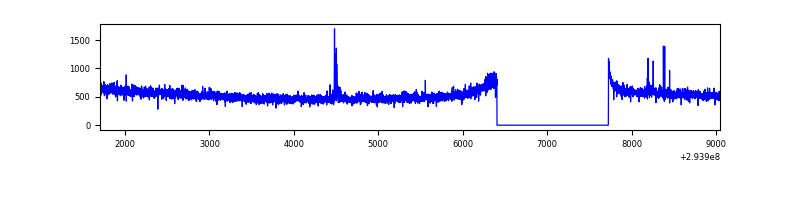 |
| D | 7342 | 6022 | 3372 | 3372 | 45.93% | 55.99% | 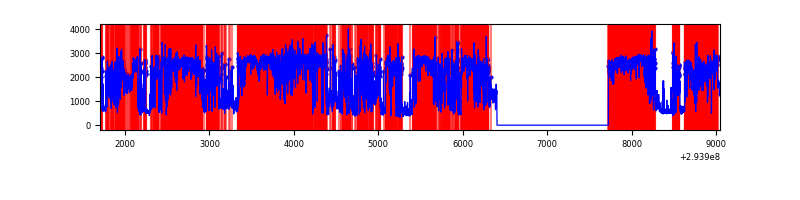 |
Top three noisy pixels from each quadrant. If the there are fewer than three noisy pixels in the level2.evt file, extra rows are filled as -1
| Pixel properties | Quadrant properties | ||||||
|---|---|---|---|---|---|---|---|
| Quadrant | DetID | PixID | Counts | Sigma | Mean | Median | Sigma |
| A | 11 | 29 | 15047 | 88.61 | 807 | 792 | 160.9 |
| A | 13 | 254 | 7443 | 41.34 | 807 | 792 | 160.9 |
| A | 0 | 226 | 7059 | 38.95 | 807 | 792 | 160.9 |
| B | 0 | 190 | 41020 | 273.82 | 791 | 772 | 147.0 |
| B | 0 | 198 | 17148 | 111.41 | 791 | 772 | 147.0 |
| B | 12 | 111 | 16992 | 110.35 | 791 | 772 | 147.0 |
| C | 14 | 238 | 120985 | 670.59 | 773 | 780 | 179.3 |
| C | 3 | 233 | 56365 | 310.09 | 773 | 780 | 179.3 |
| C | 10 | 223 | 17714 | 94.47 | 773 | 780 | 179.3 |
| D | 7 | 238 | 9132278 | 76540.13 | 497 | 485 | 119.3 |
| D | 1 | 52 | 306400 | 2564.09 | 497 | 485 | 119.3 |
| D | 11 | 176 | 115874 | 967.16 | 497 | 485 | 119.3 |
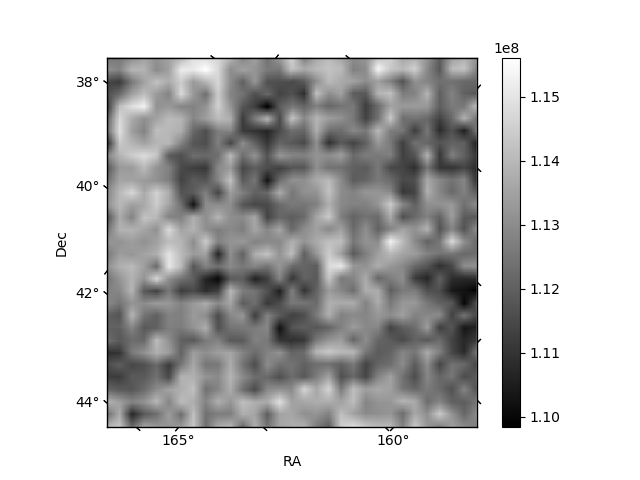
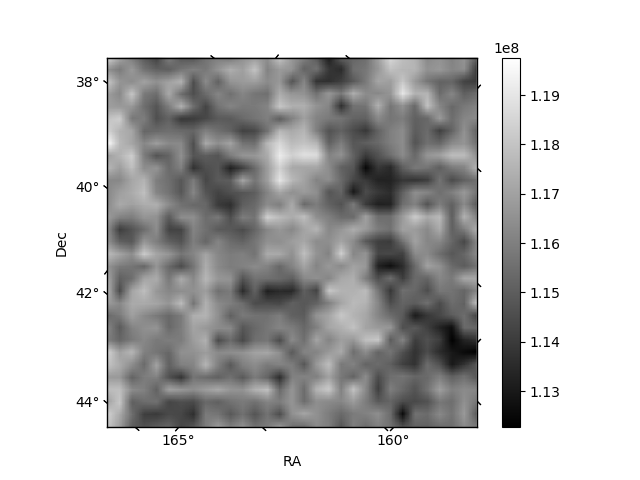
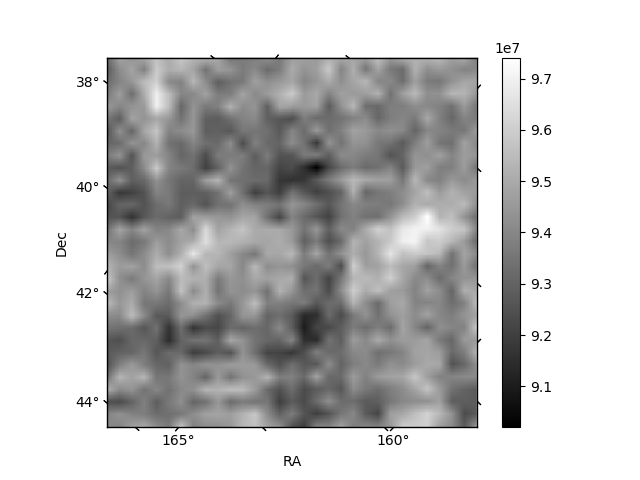
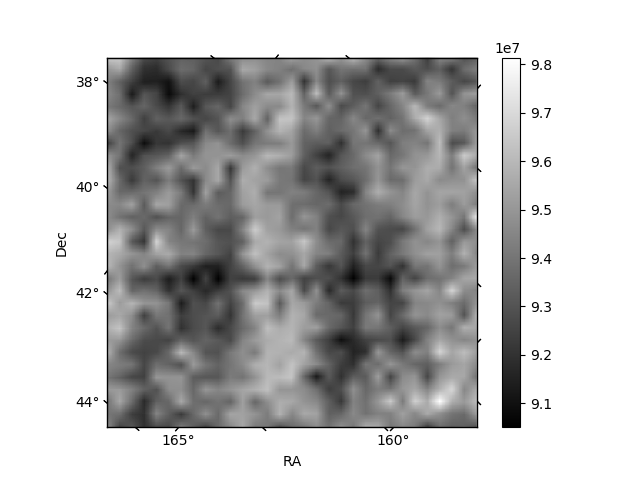
Histogram calculated using DETX and DETY for each event in the final _common_clean file
| Quadrant A | 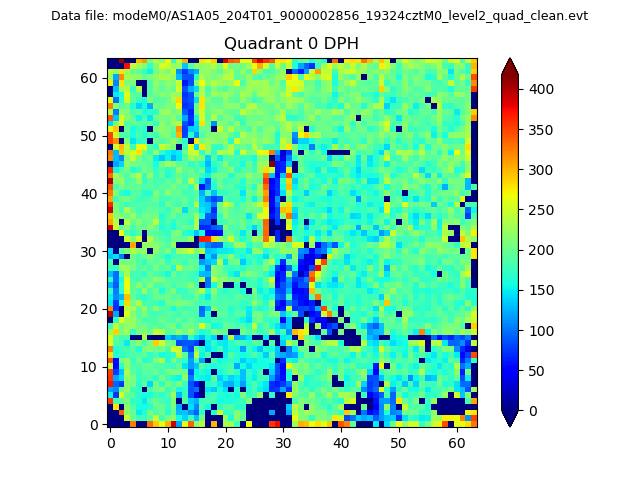 |
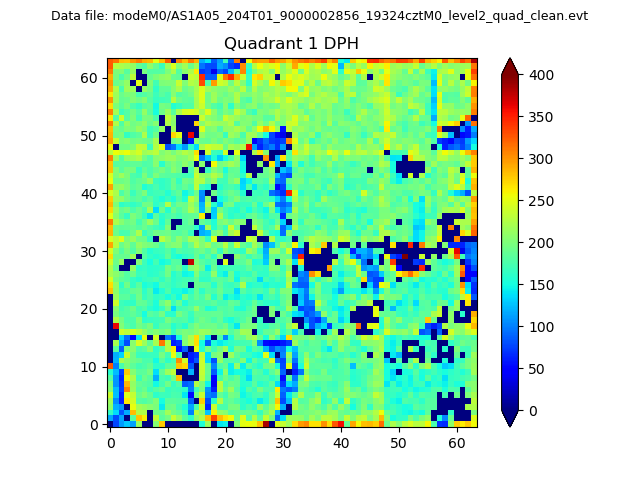 |
Quadrant B |
|---|---|---|---|
| Quadrant D | 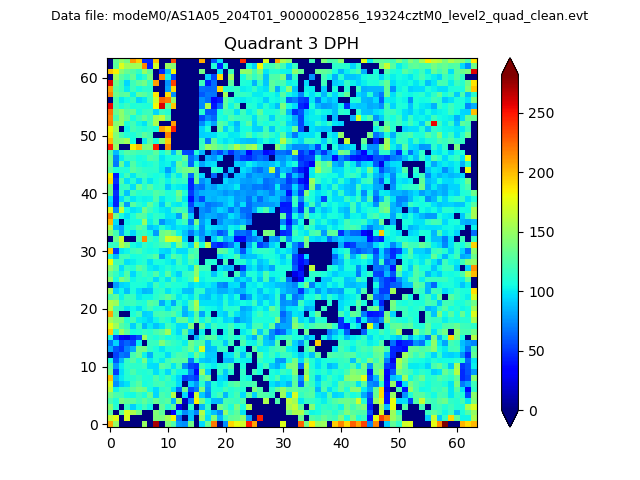 |
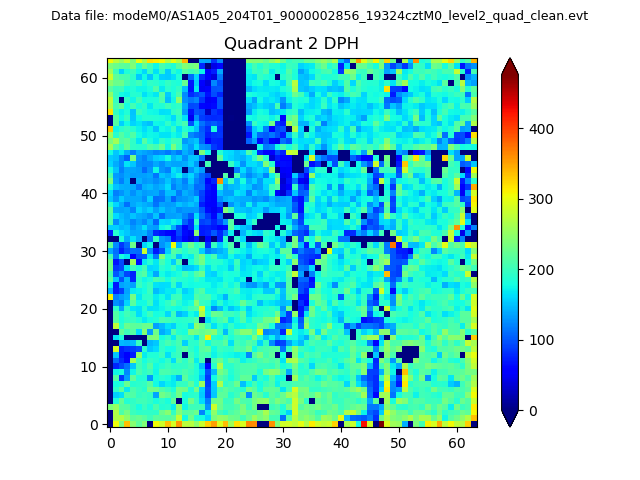 |
Quadrant C |
| Plot type | Count rate plots | Images |
|---|---|---|
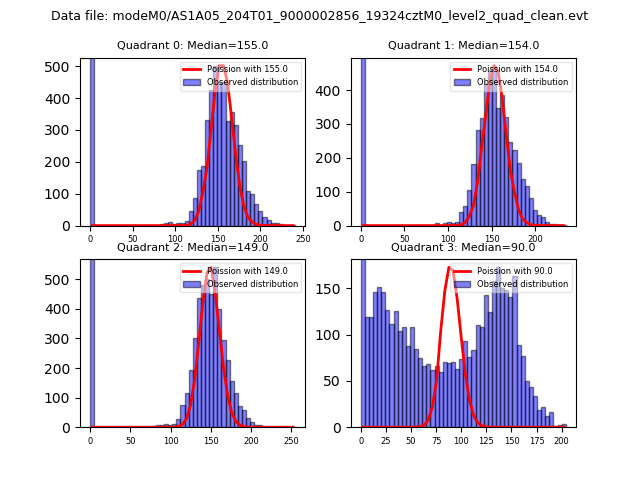
| Comparison with Poisson distribution Blue bars denote a histogram of data divided into 1 sec bins. Red curve is a Poisson curve with rate = median count rate of data. |
 |
 |
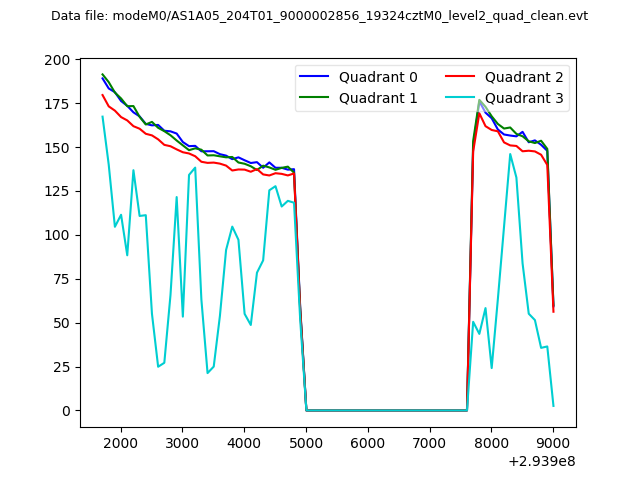
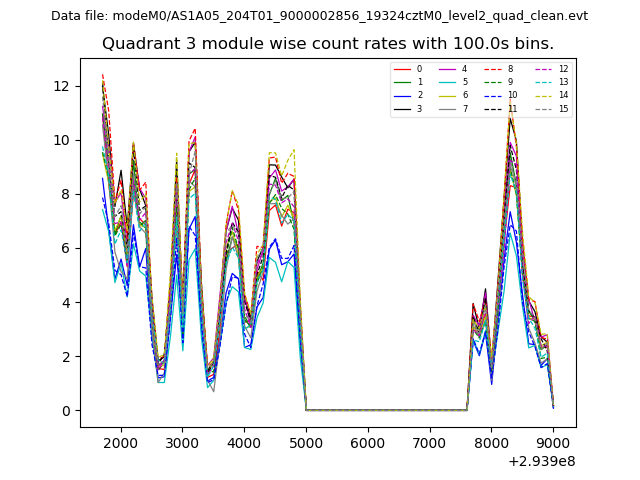
| Quadrant-wise count rates Data is divided into 100 sec bins |
 |
|
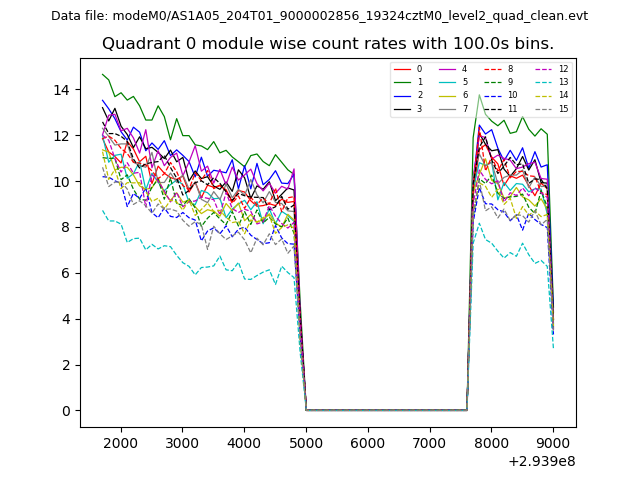
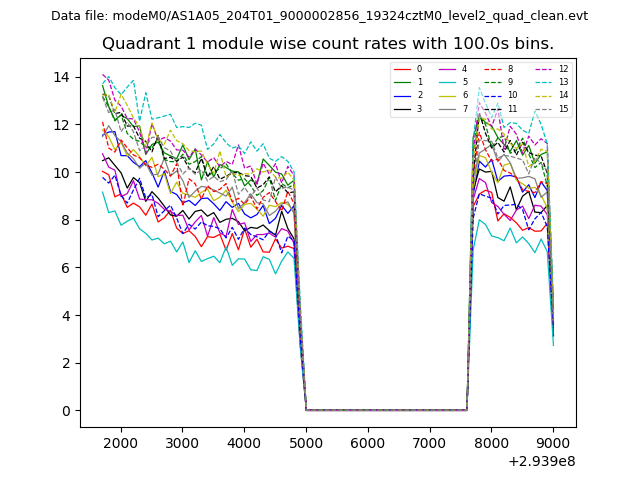
| Module-wise count rates for Quadrant A Data is divided into 100 sec bins |
 |
 |
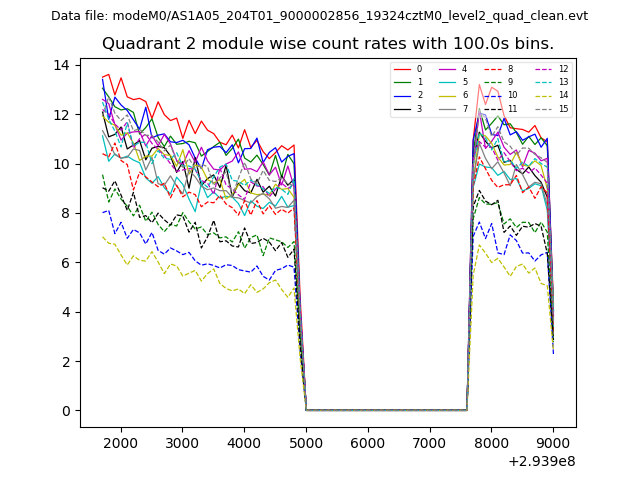
| Module-wise count rates for Quadrant B Data is divided into 100 sec bins |
 |
 |
| Module-wise count rates for Quadrant C Data is divided into 100 sec bins |
 |
 |
| Module-wise count rates for Quadrant D Data is divided into 100 sec bins |
 |
 |
| Parameter | Plot |
|---|---|
| CZT HV Monitor | 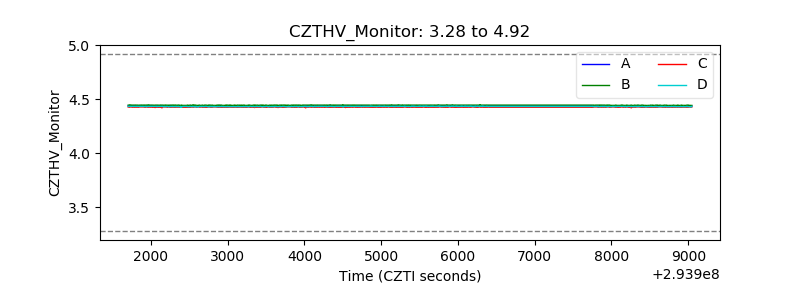 |
| D_VDD | 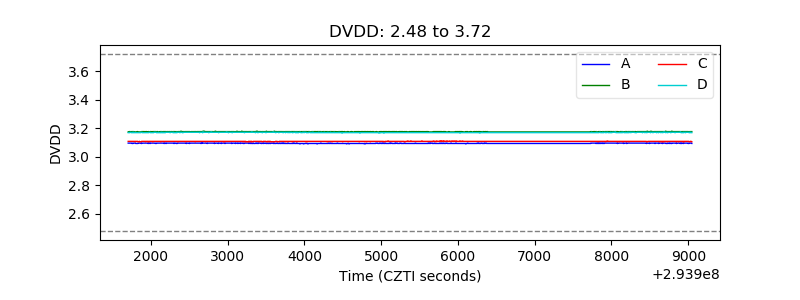 |
| Temperature 1 | 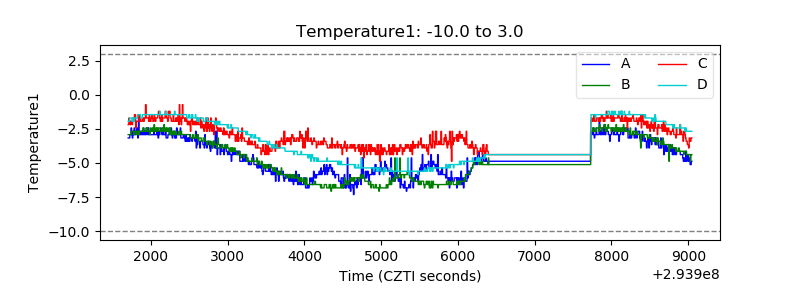 |
| Veto HV Monitor | 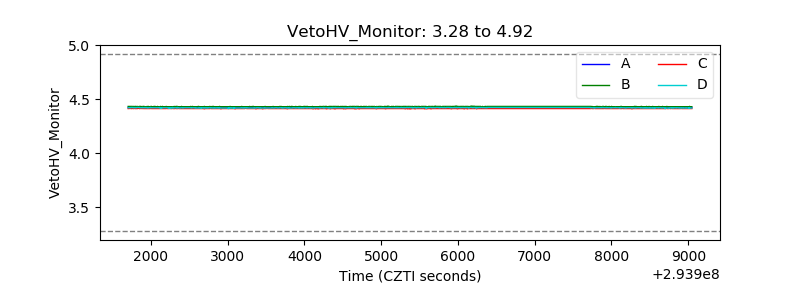 |
| Veto LLD | 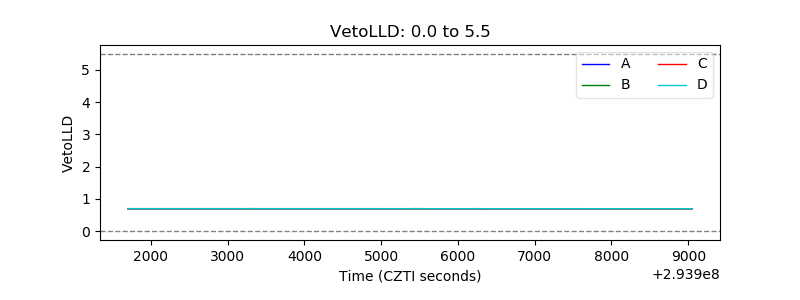 |
| Alpha Counter | 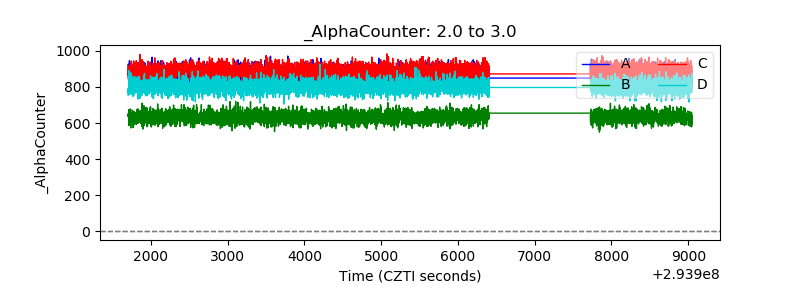 |
| _CPM_Rate | 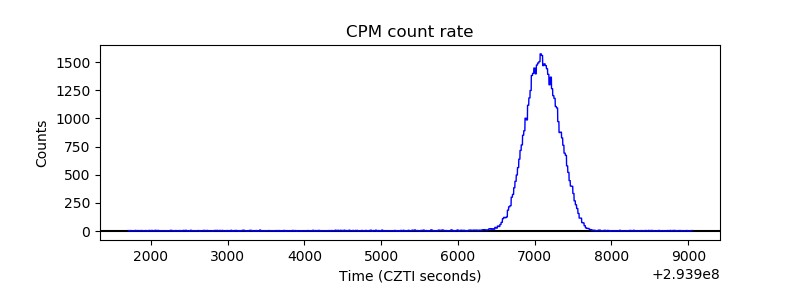 |
| CZT Counter | 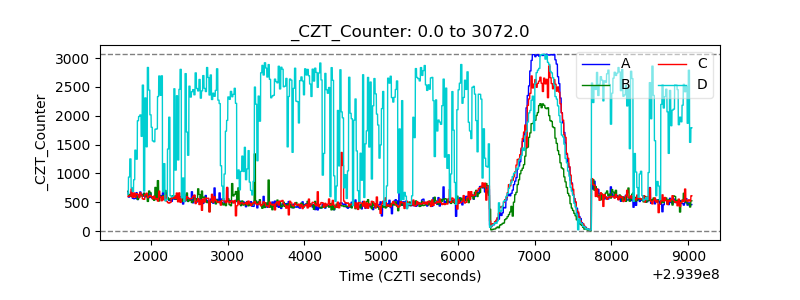 |
| +2.5 Volts monitor | 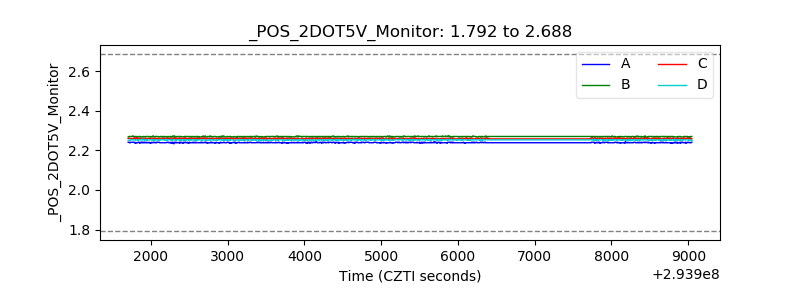 |
| +5 Volts monitor | 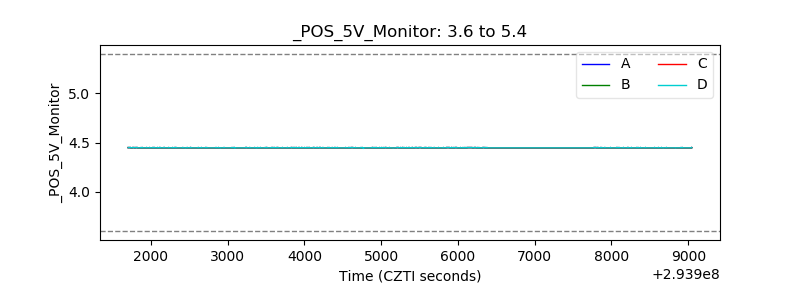 |
| _ROLL_ROT | 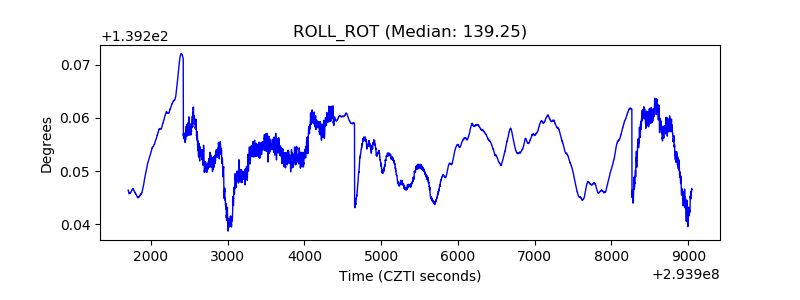 |
| _Roll_DEC | 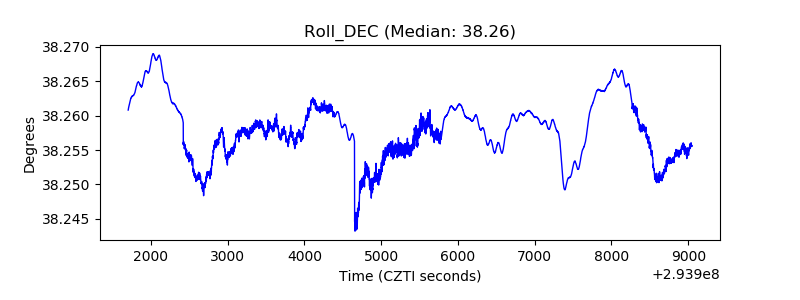 |
| _Roll_RA | 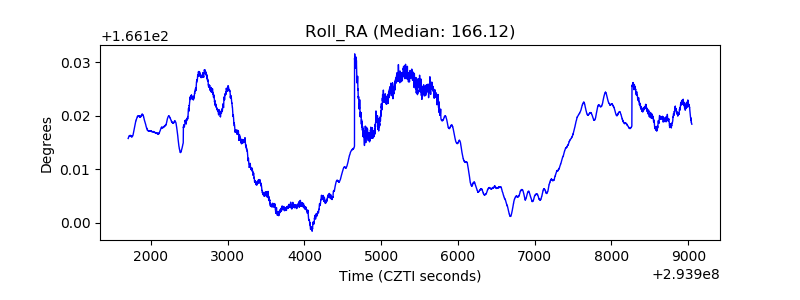 |
| Veto Counter | 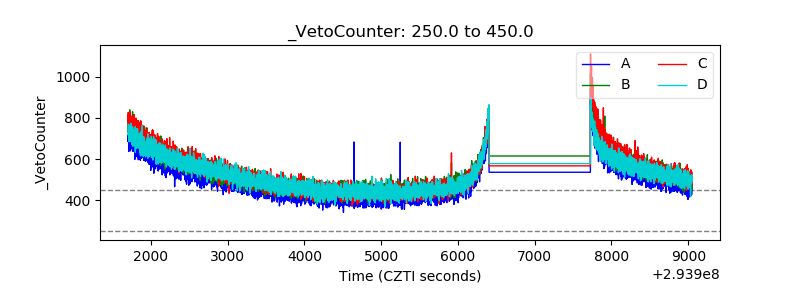 |