| Param | Original file | Final file |
|---|---|---|
| Filename | modeM0/AS1A05_204T01_9000002856_19326cztM0_level2.evt | modeM0/AS1A05_204T01_9000002856_19326cztM0_level2_quad_clean.evt |
| Size (bytes) | 510,517,440 | 95,898,240 |
| Size | 486.9 MB | 91.5 MB |
| Events in quadrant A | 3,250,242 | 626,125 |
| Events in quadrant B | 3,435,155 | 628,393 |
| Events in quadrant C | 3,439,739 | 602,119 |
| Events in quadrant D | 4,874,351 | 573,451 |
| Mode M0 | |||
|---|---|---|---|
| Quadrant | BADHDUFLAG | Total packets | Discarded packets |
| A | 0 | 14123 | 2 |
| B | 0 | 14654 | 2 |
| C | 0 | 14500 | 2 |
| D | 0 | 19244 | 2 |
| Mode M9 | |||
|---|---|---|---|
| Quadrant | BADHDUFLAG | Total packets | Discarded packets |
| A | 0 | 11 | 0 |
| B | 0 | 12 | 0 |
| C | 0 | 12 | 0 |
| D | 0 | 12 | 0 |
| Mode SS | |||
|---|---|---|---|
| Quadrant | BADHDUFLAG | Total packets | Discarded packets |
| A | 0 | 140 | 0 |
| B | 0 | 140 | 0 |
| C | 0 | 140 | 0 |
| D | 0 | 140 | 0 |
| Quadrant | Total seconds | Saturated seconds | Saturation percentage |
|---|---|---|---|
| A | 6794 | 39 | 0.574036% |
| B | 6794 | 60 | 0.883132% |
| C | 6794 | 88 | 1.295261% |
| D | 6794 | 441 | 6.491021% |
Noise dominated data is calculated using 1-second bins in cleaned event files. If a bin has >2000 counts, and if more than 50% of those come from <1% of pixels, then it is considered to be noise-dominated and hence unusable.
| Quadrant | # 1 sec bins | Bins with >0 counts | Bins with >2000 counts | High rate bins dominated by noise | Noise dominated (total time) | Noise dominated (detector-on time) | Marked lightcurve |
|---|---|---|---|---|---|---|---|
| A | 7624 | 6795 | 0 | 0 | 0.00% | 0.00% | 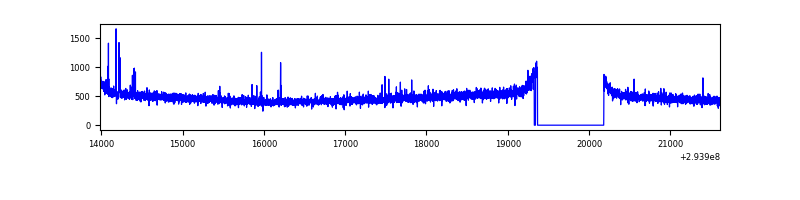 |
| B | 7624 | 6796 | 1 | 1 | 0.01% | 0.01% | 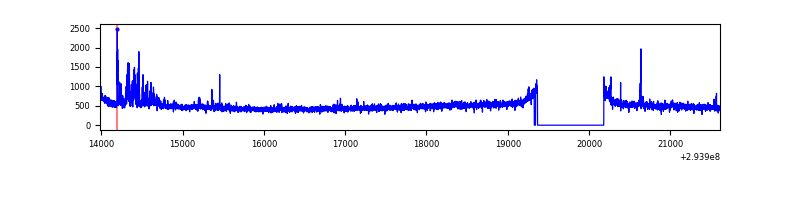 |
| C | 7624 | 6796 | 0 | 0 | 0.00% | 0.00% | 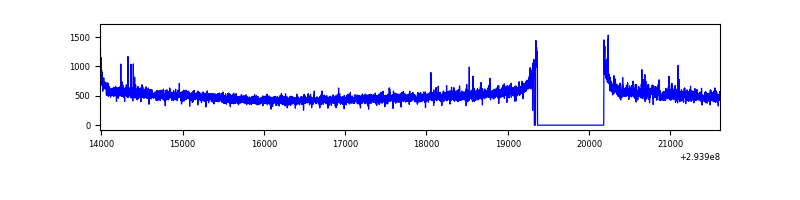 |
| D | 7624 | 6796 | 263 | 263 | 3.45% | 3.87% | 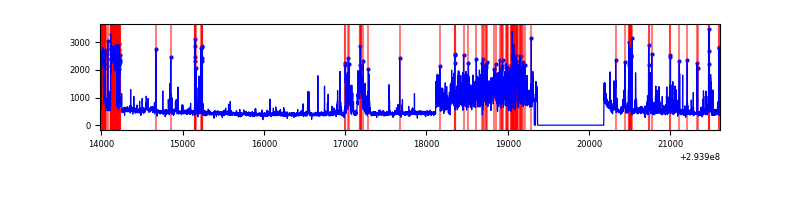 |
Top three noisy pixels from each quadrant. If the there are fewer than three noisy pixels in the level2.evt file, extra rows are filled as -1
| Pixel properties | Quadrant properties | ||||||
|---|---|---|---|---|---|---|---|
| Quadrant | DetID | PixID | Counts | Sigma | Mean | Median | Sigma |
| A | 4 | 2 | 17169 | 96.63 | 834 | 814 | 169.3 |
| A | 11 | 29 | 13615 | 75.63 | 834 | 814 | 169.3 |
| A | 5 | 16 | 8448 | 45.1 | 834 | 814 | 169.3 |
| B | 6 | 36 | 80246 | 508.83 | 828 | 808 | 156.1 |
| B | 0 | 229 | 54442 | 343.55 | 828 | 808 | 156.1 |
| B | 0 | 190 | 33519 | 209.53 | 828 | 808 | 156.1 |
| C | 3 | 233 | 173224 | 914.82 | 803 | 811 | 188.5 |
| C | 14 | 238 | 124376 | 655.63 | 803 | 811 | 188.5 |
| C | 13 | 61 | 5455 | 24.64 | 803 | 811 | 188.5 |
| D | 1 | 52 | 917196 | 4760.64 | 794 | 773 | 192.5 |
| D | 7 | 238 | 609807 | 3163.81 | 794 | 773 | 192.5 |
| D | 11 | 176 | 272397 | 1411.03 | 794 | 773 | 192.5 |
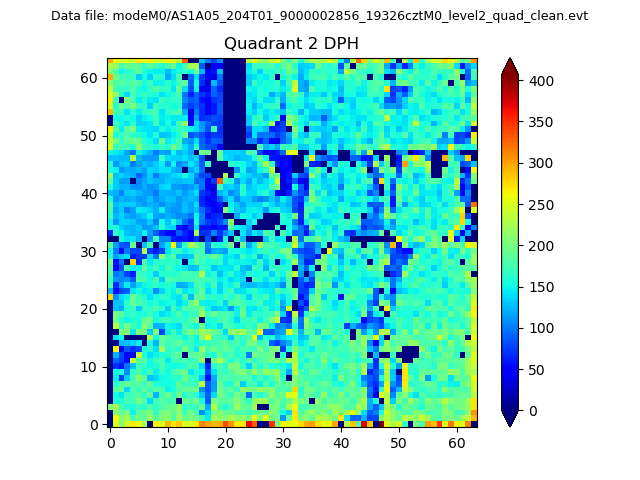
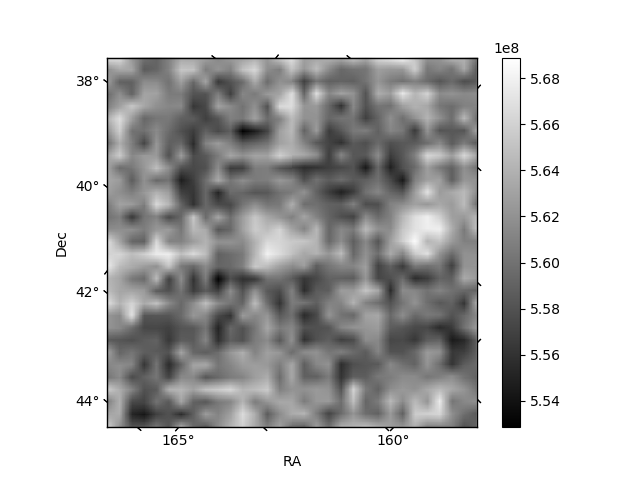
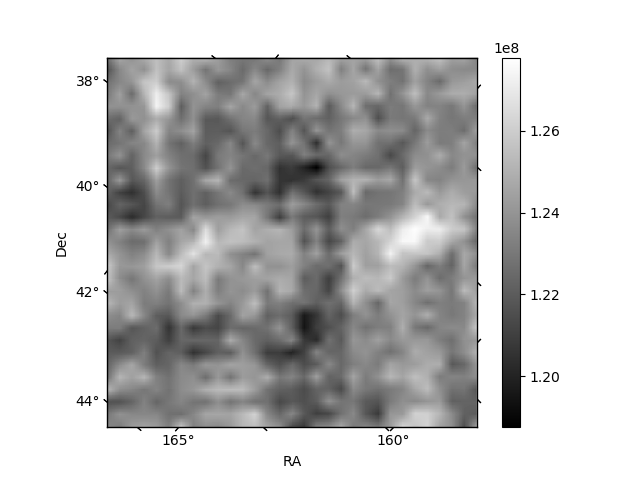
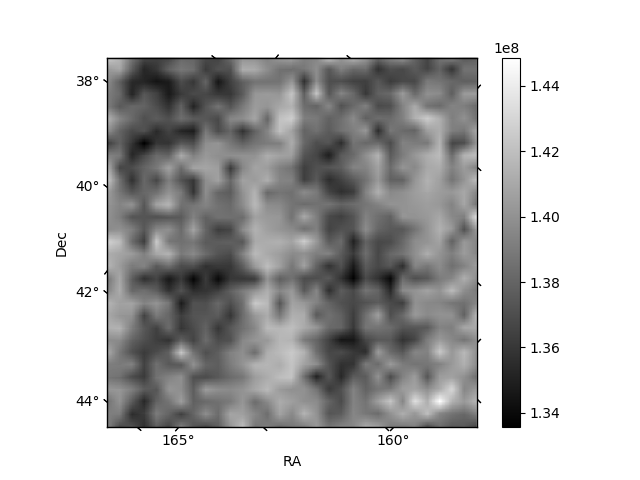
Histogram calculated using DETX and DETY for each event in the final _common_clean file
| Quadrant A | 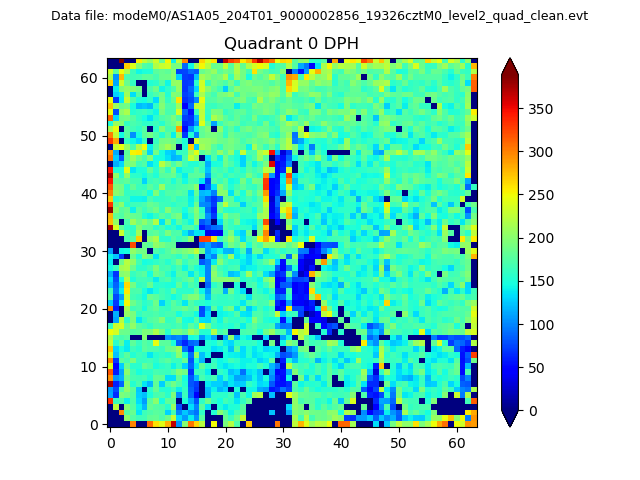 |
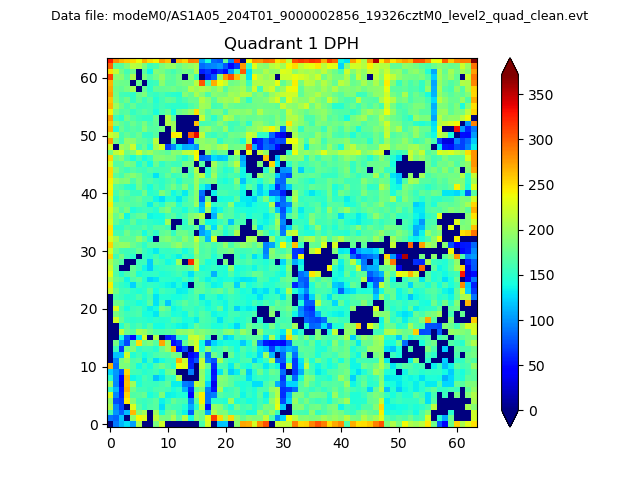 |
Quadrant B |
|---|---|---|---|
| Quadrant D | 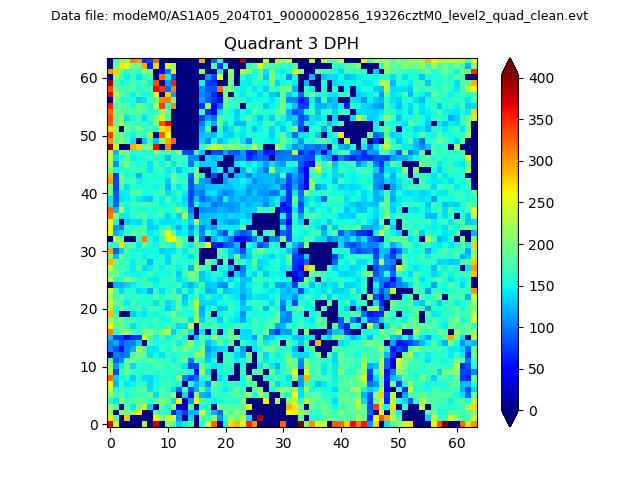 |
 |
Quadrant C |
| Plot type | Count rate plots | Images |
|---|---|---|
| Comparison with Poisson distribution Blue bars denote a histogram of data divided into 1 sec bins. Red curve is a Poisson curve with rate = median count rate of data. |
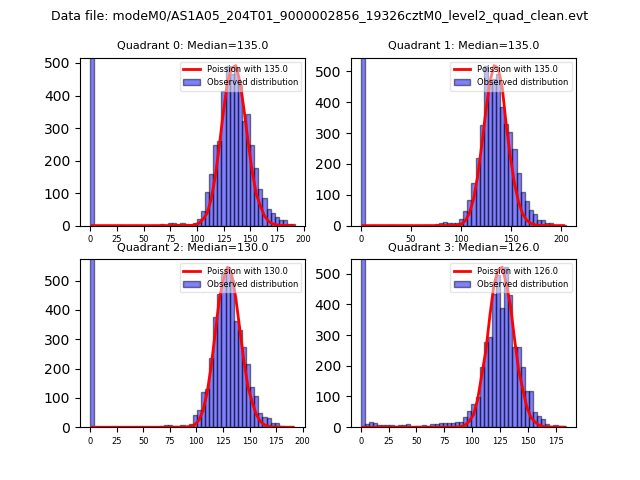 |
 |
| Quadrant-wise count rates Data is divided into 100 sec bins |
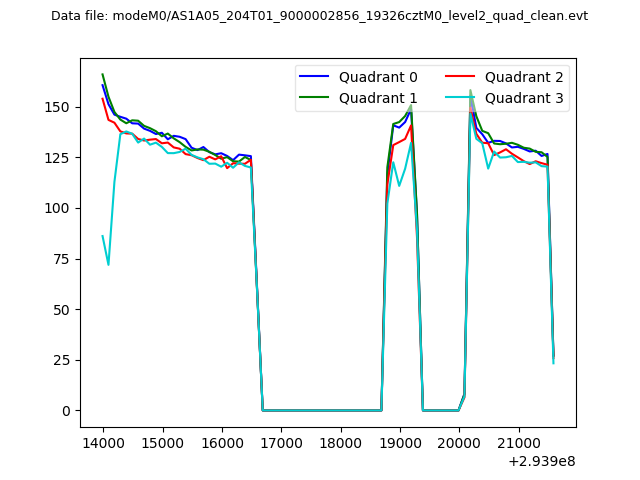 |
|
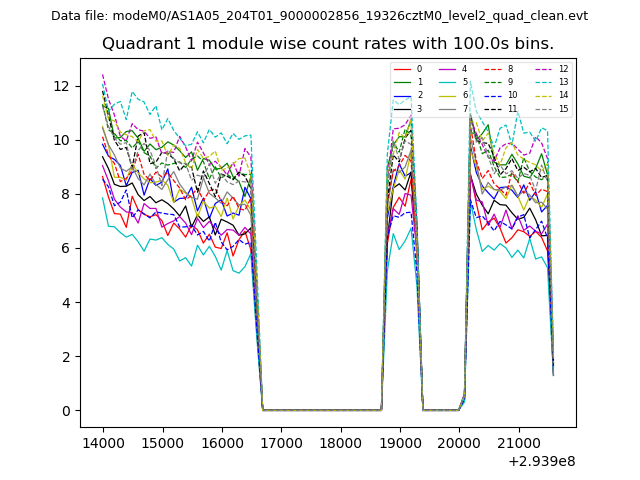
| Module-wise count rates for Quadrant A Data is divided into 100 sec bins |
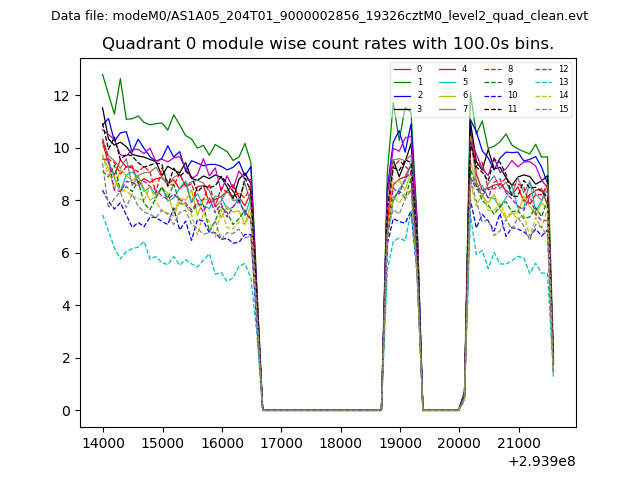 |
 |
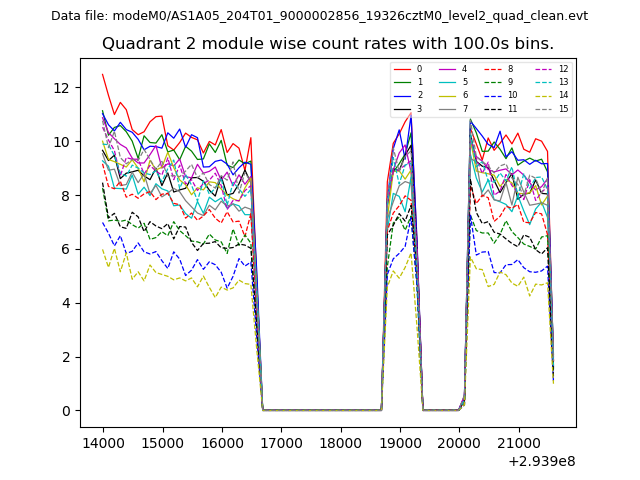
| Module-wise count rates for Quadrant B Data is divided into 100 sec bins |
 |
 |
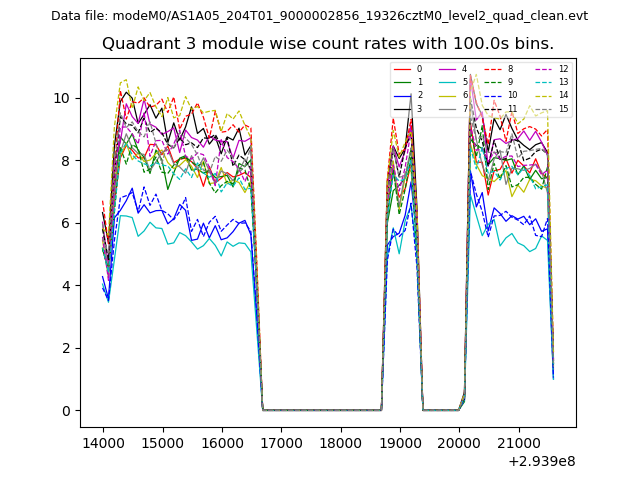
| Module-wise count rates for Quadrant C Data is divided into 100 sec bins |
 |
 |
| Module-wise count rates for Quadrant D Data is divided into 100 sec bins |
 |
 |
| Parameter | Plot |
|---|---|
| CZT HV Monitor | 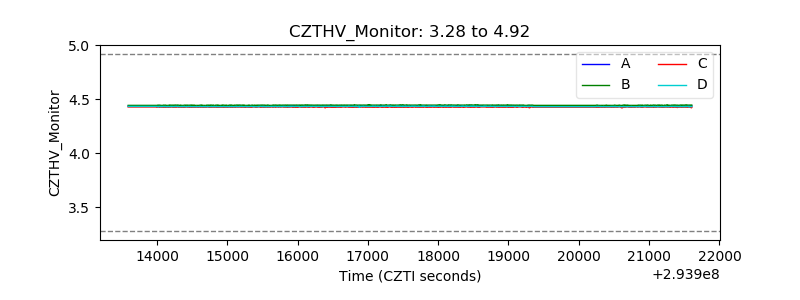 |
| D_VDD | 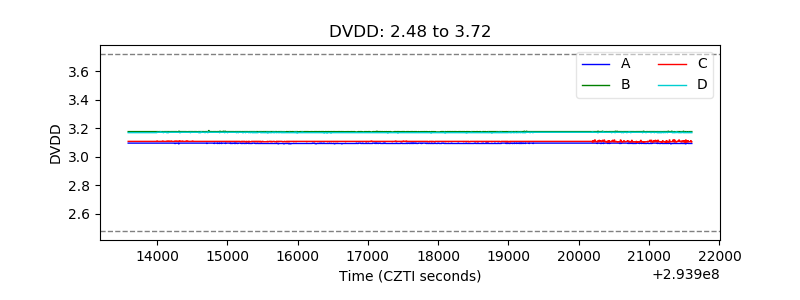 |
| Temperature 1 | 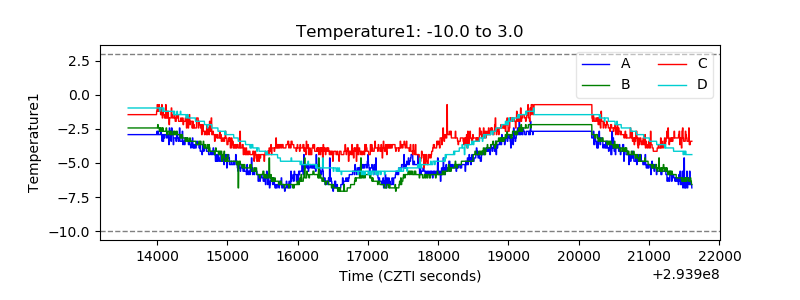 |
| Veto HV Monitor | 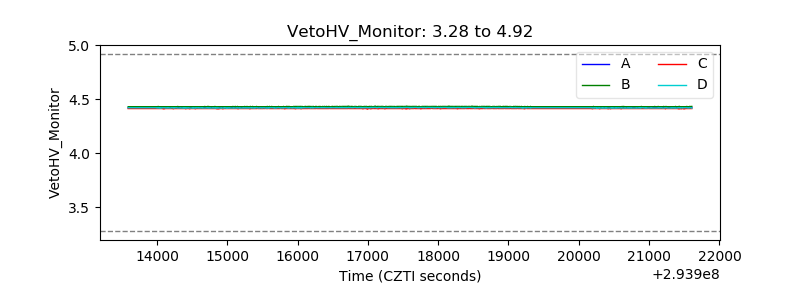 |
| Veto LLD | 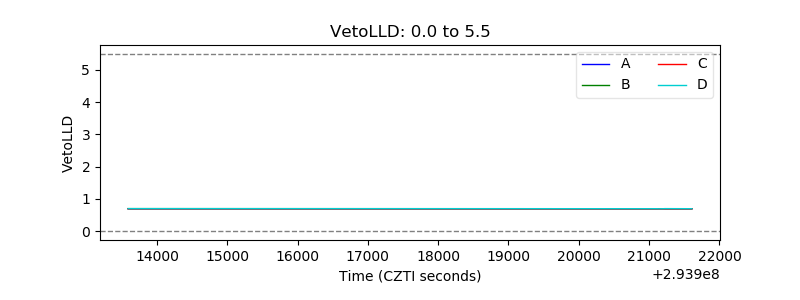 |
| Alpha Counter | 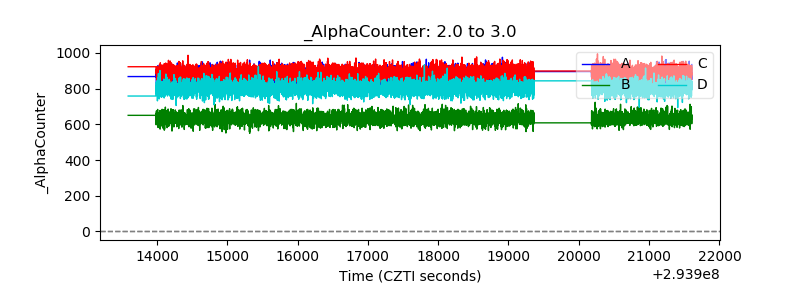 |
| _CPM_Rate | 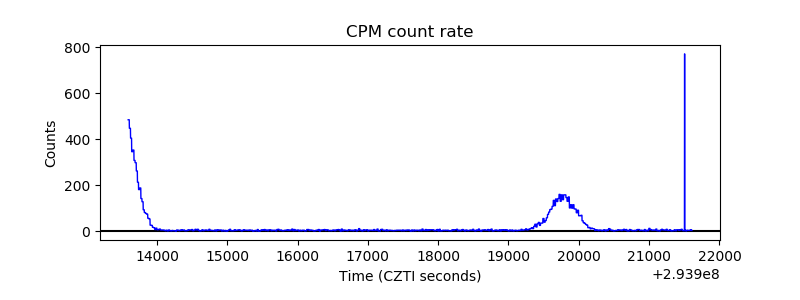 |
| CZT Counter | 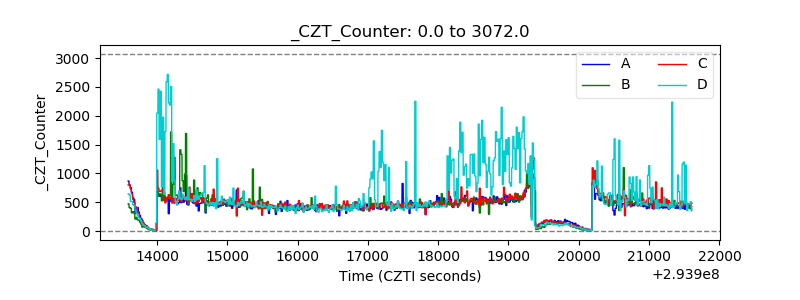 |
| +2.5 Volts monitor |  |
| +5 Volts monitor |  |
| _ROLL_ROT | 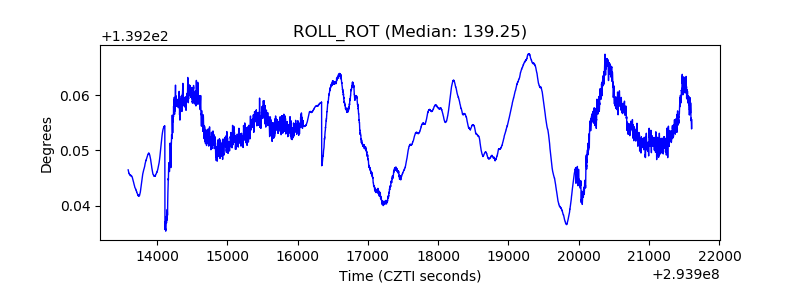 |
| _Roll_DEC |  |
| _Roll_RA | 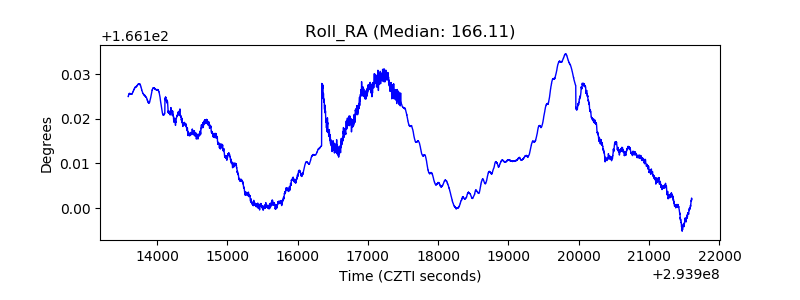 |
| Veto Counter | 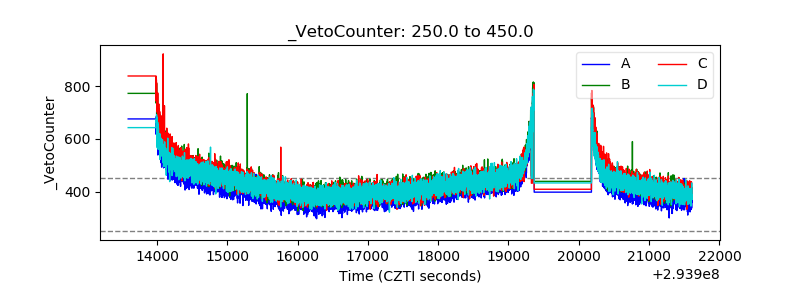 |