| Param | Original file | Final file |
|---|---|---|
| Filename | modeM0/AS1A05_204T01_9000002856_19328cztM0_level2.evt | modeM0/AS1A05_204T01_9000002856_19328cztM0_level2_quad_clean.evt |
| Size (bytes) | 620,176,320 | 107,136,000 |
| Size | 591.4 MB | 102.2 MB |
| Events in quadrant A | 3,586,963 | 702,442 |
| Events in quadrant B | 3,652,932 | 706,736 |
| Events in quadrant C | 3,920,085 | 678,166 |
| Events in quadrant D | 7,103,921 | 625,417 |
| Mode M0 | |||
|---|---|---|---|
| Quadrant | BADHDUFLAG | Total packets | Discarded packets |
| A | 0 | 15821 | 4 |
| B | 0 | 15960 | 4 |
| C | 0 | 16720 | 4 |
| D | 0 | 26334 | 6 |
| Mode M9 | |||
|---|---|---|---|
| Quadrant | BADHDUFLAG | Total packets | Discarded packets |
| A | 0 | 5 | 0 |
| B | 0 | 5 | 0 |
| C | 0 | 5 | 0 |
| D | 0 | 5 | 0 |
| Mode SS | |||
|---|---|---|---|
| Quadrant | BADHDUFLAG | Total packets | Discarded packets |
| A | 0 | 158 | 0 |
| B | 0 | 158 | 0 |
| C | 0 | 158 | 0 |
| D | 0 | 158 | 0 |
| Quadrant | Total seconds | Saturated seconds | Saturation percentage |
|---|---|---|---|
| A | 7636 | 46 | 0.602410% |
| B | 7637 | 93 | 1.217756% |
| C | 7637 | 150 | 1.964122% |
| D | 7636 | 1267 | 16.592457% |
Noise dominated data is calculated using 1-second bins in cleaned event files. If a bin has >2000 counts, and if more than 50% of those come from <1% of pixels, then it is considered to be noise-dominated and hence unusable.
| Quadrant | # 1 sec bins | Bins with >0 counts | Bins with >2000 counts | High rate bins dominated by noise | Noise dominated (total time) | Noise dominated (detector-on time) | Marked lightcurve |
|---|---|---|---|---|---|---|---|
| A | 8206 | 7639 | 3 | 3 | 0.04% | 0.04% |  |
| B | 8207 | 7640 | 2 | 2 | 0.02% | 0.03% | 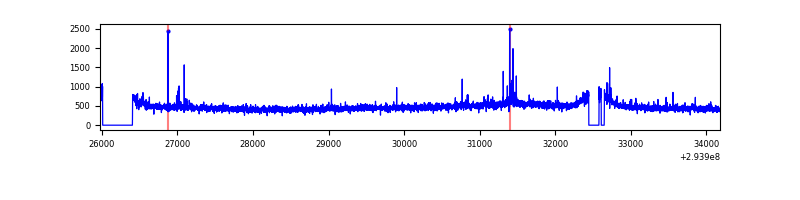 |
| C | 8207 | 7639 | 1 | 1 | 0.01% | 0.01% |  |
| D | 8205 | 7638 | 1191 | 1191 | 14.52% | 15.59% | 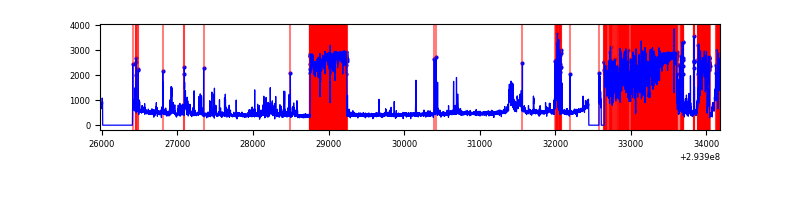 |
Top three noisy pixels from each quadrant. If the there are fewer than three noisy pixels in the level2.evt file, extra rows are filled as -1
| Pixel properties | Quadrant properties | ||||||
|---|---|---|---|---|---|---|---|
| Quadrant | DetID | PixID | Counts | Sigma | Mean | Median | Sigma |
| A | 5 | 16 | 25347 | 131.7 | 915 | 895 | 185.7 |
| A | 11 | 29 | 18757 | 96.21 | 915 | 895 | 185.7 |
| A | 4 | 2 | 12848 | 64.38 | 915 | 895 | 185.7 |
| B | 0 | 190 | 22371 | 124.21 | 910 | 886 | 173.0 |
| B | 12 | 111 | 21422 | 118.73 | 910 | 886 | 173.0 |
| B | 11 | 111 | 18694 | 102.96 | 910 | 886 | 173.0 |
| C | 3 | 233 | 340802 | 1627.91 | 883 | 887 | 208.8 |
| C | 14 | 238 | 136341 | 648.71 | 883 | 887 | 208.8 |
| C | 13 | 61 | 6250 | 25.68 | 883 | 887 | 208.8 |
| D | 7 | 238 | 3828125 | 19367.36 | 817 | 792 | 197.6 |
| D | 13 | 104 | 51882 | 258.53 | 817 | 792 | 197.6 |
| D | 11 | 176 | 33013 | 163.05 | 817 | 792 | 197.6 |
Histogram calculated using DETX and DETY for each event in the final _common_clean file
| Quadrant A |  |
 |
Quadrant B |
|---|---|---|---|
| Quadrant D |  |
 |
Quadrant C |
| Plot type | Count rate plots | Images |
|---|---|---|
| Comparison with Poisson distribution Blue bars denote a histogram of data divided into 1 sec bins. Red curve is a Poisson curve with rate = median count rate of data. |
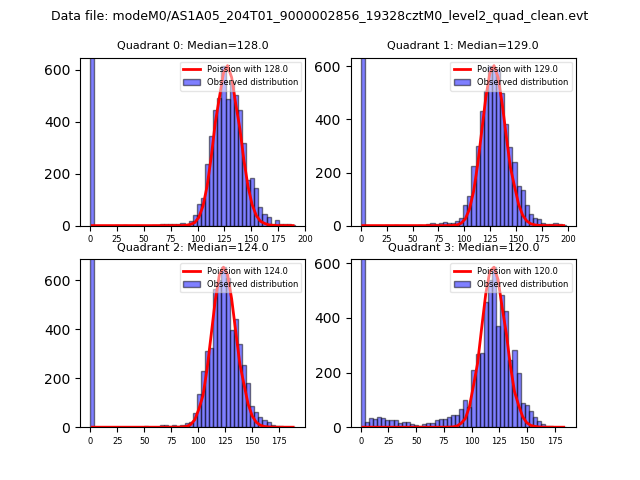 |
 |
| Quadrant-wise count rates Data is divided into 100 sec bins |
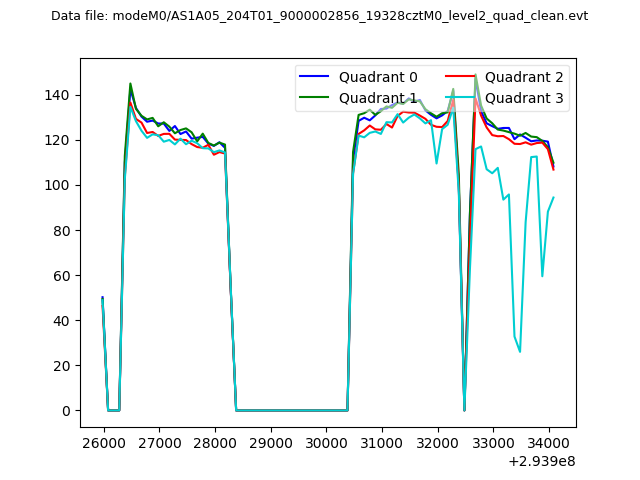 |
|
| Module-wise count rates for Quadrant A Data is divided into 100 sec bins |
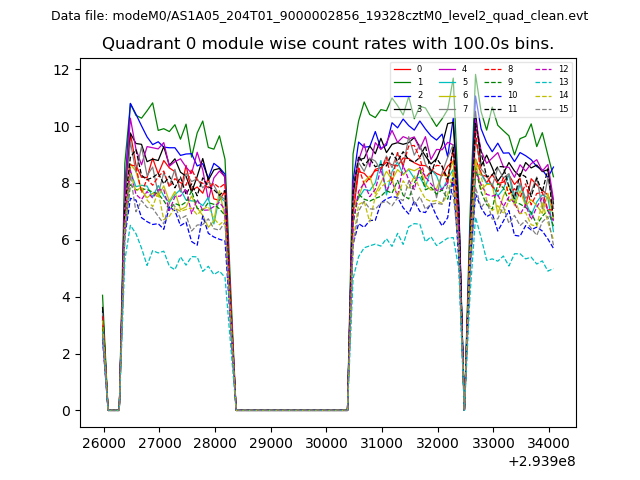 |
 |
| Module-wise count rates for Quadrant B Data is divided into 100 sec bins |
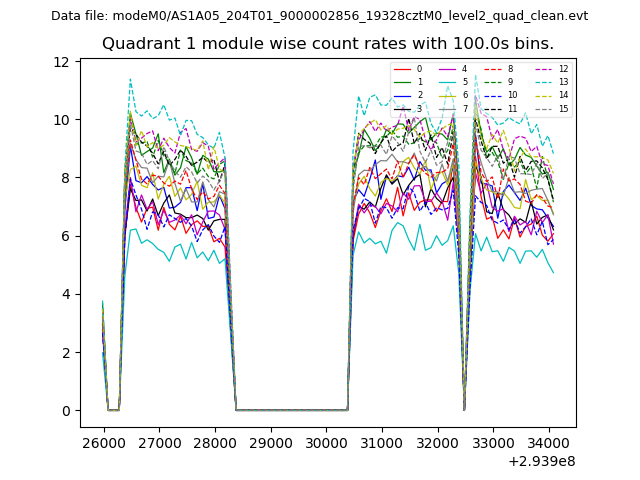 |
 |
| Module-wise count rates for Quadrant C Data is divided into 100 sec bins |
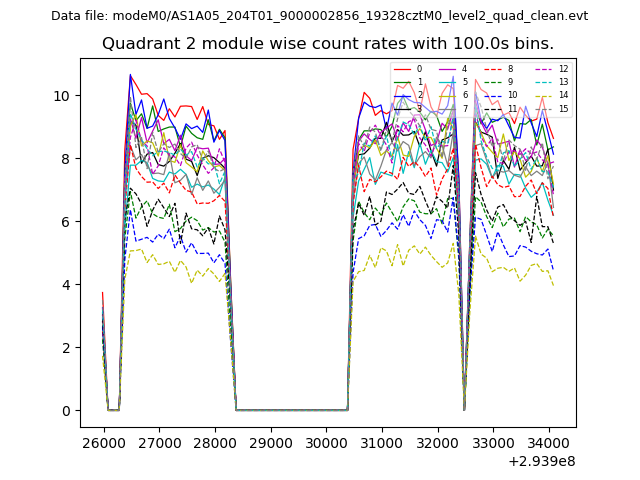 |
 |
| Module-wise count rates for Quadrant D Data is divided into 100 sec bins |
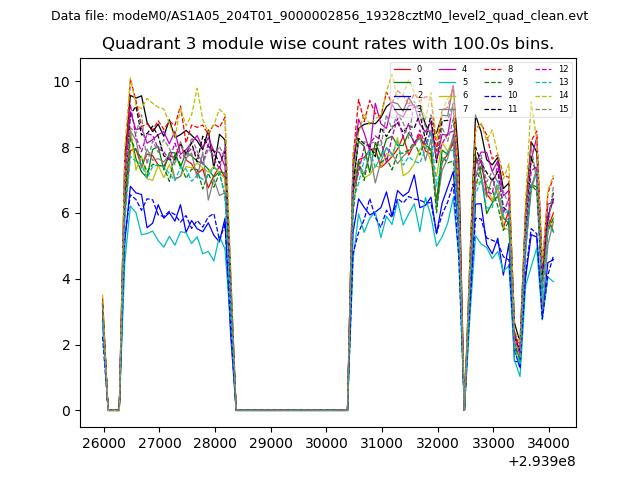 |
 |
| Parameter | Plot |
|---|---|
| CZT HV Monitor | 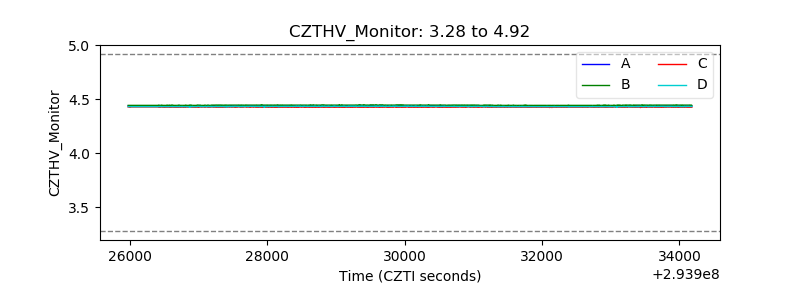 |
| D_VDD |  |
| Temperature 1 |  |
| Veto HV Monitor |  |
| Veto LLD |  |
| Alpha Counter | 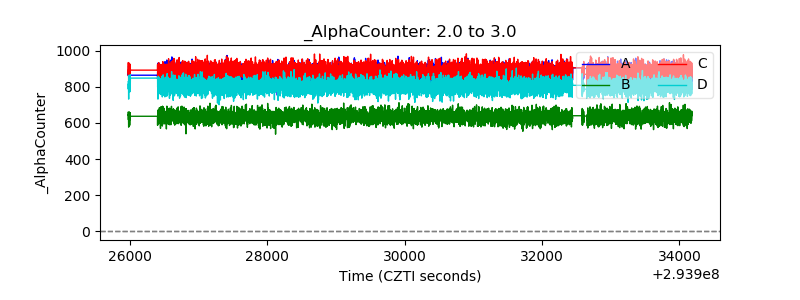 |
| _CPM_Rate | 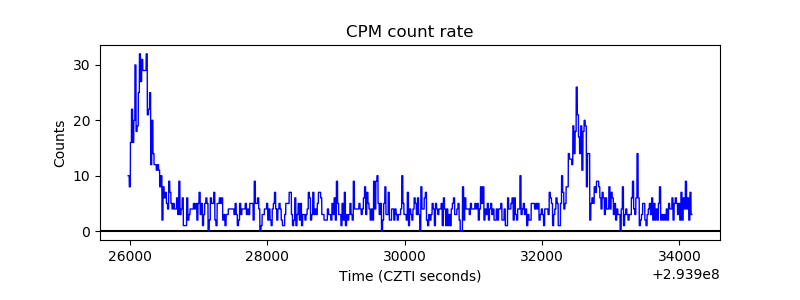 |
| CZT Counter |  |
| +2.5 Volts monitor |  |
| +5 Volts monitor |  |
| _ROLL_ROT |  |
| _Roll_DEC |  |
| _Roll_RA |  |
| Veto Counter | 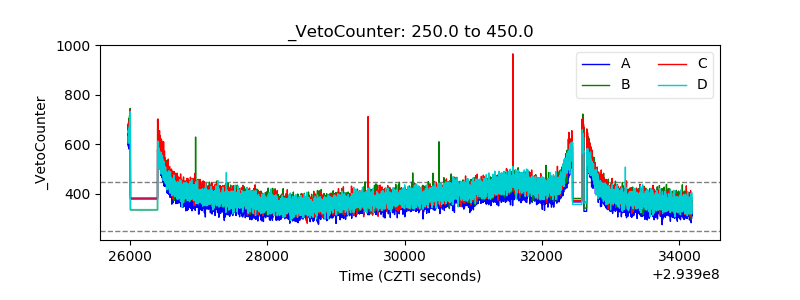 |