| Param | Original file | Final file |
|---|---|---|
| Filename | modeM0/AS1A05_204T01_9000002856_19331cztM0_level2.evt | modeM0/AS1A05_204T01_9000002856_19331cztM0_level2_quad_clean.evt |
| Size (bytes) | 1,062,529,920 | 147,597,120 |
| Size | 1013.3 MB | 140.8 MB |
| Events in quadrant A | 6,226,265 | 928,879 |
| Events in quadrant B | 6,321,373 | 939,942 |
| Events in quadrant C | 6,284,861 | 902,548 |
| Events in quadrant D | 12,455,676 | 787,811 |
| Mode M0 | |||
|---|---|---|---|
| Quadrant | BADHDUFLAG | Total packets | Discarded packets |
| A | 0 | 27165 | 3 |
| B | 0 | 27248 | 3 |
| C | 0 | 27036 | 3 |
| D | 0 | 45775 | 3 |
| Mode M9 | |||
|---|---|---|---|
| Quadrant | BADHDUFLAG | Total packets | Discarded packets |
| A | 0 | 16 | 0 |
| B | 0 | 16 | 0 |
| C | 0 | 16 | 0 |
| D | 0 | 16 | 0 |
| Mode SS | |||
|---|---|---|---|
| Quadrant | BADHDUFLAG | Total packets | Discarded packets |
| A | 0 | 268 | 0 |
| B | 0 | 268 | 0 |
| C | 0 | 268 | 0 |
| D | 0 | 268 | 0 |
| Quadrant | Total seconds | Saturated seconds | Saturation percentage |
|---|---|---|---|
| A | 13174 | 112 | 0.850159% |
| B | 13174 | 118 | 0.895704% |
| C | 13174 | 125 | 0.948839% |
| D | 13174 | 2229 | 16.919690% |
Noise dominated data is calculated using 1-second bins in cleaned event files. If a bin has >2000 counts, and if more than 50% of those come from <1% of pixels, then it is considered to be noise-dominated and hence unusable.
| Quadrant | # 1 sec bins | Bins with >0 counts | Bins with >2000 counts | High rate bins dominated by noise | Noise dominated (total time) | Noise dominated (detector-on time) | Marked lightcurve |
|---|---|---|---|---|---|---|---|
| A | 14724 | 13174 | 14 | 14 | 0.10% | 0.11% | 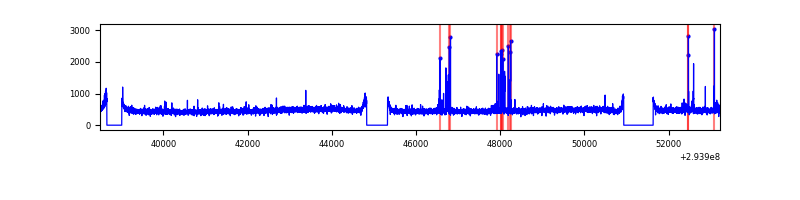 |
| B | 14724 | 13175 | 5 | 5 | 0.03% | 0.04% | 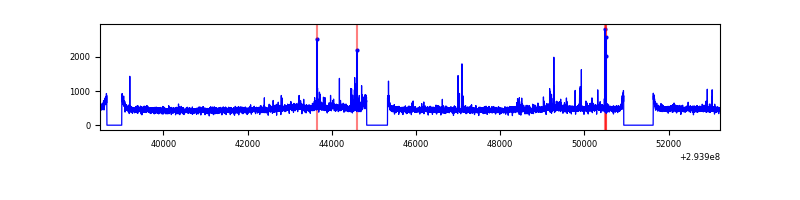 |
| C | 14724 | 13176 | 0 | 0 | 0.00% | 0.00% | 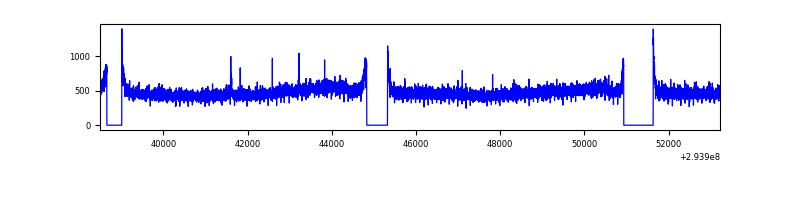 |
| D | 14723 | 13175 | 2164 | 2164 | 14.70% | 16.43% | 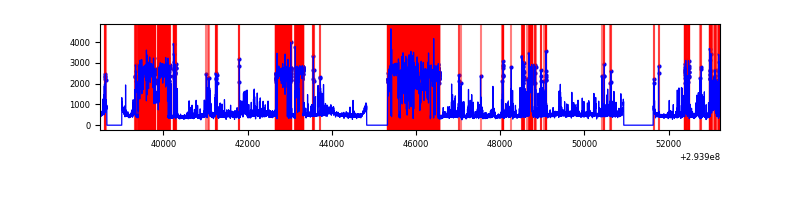 |
Top three noisy pixels from each quadrant. If the there are fewer than three noisy pixels in the level2.evt file, extra rows are filled as -1
| Pixel properties | Quadrant properties | ||||||
|---|---|---|---|---|---|---|---|
| Quadrant | DetID | PixID | Counts | Sigma | Mean | Median | Sigma |
| A | 5 | 16 | 134242 | 419.88 | 1568 | 1531 | 316.1 |
| A | 11 | 29 | 34522 | 104.38 | 1568 | 1531 | 316.1 |
| A | 4 | 2 | 17161 | 49.45 | 1568 | 1531 | 316.1 |
| B | 0 | 190 | 55290 | 180.08 | 1563 | 1523 | 298.6 |
| B | 0 | 229 | 44706 | 144.63 | 1563 | 1523 | 298.6 |
| B | 12 | 111 | 37445 | 120.31 | 1563 | 1523 | 298.6 |
| C | 14 | 238 | 232113 | 649.25 | 1509 | 1518 | 355.2 |
| C | 3 | 233 | 160192 | 446.75 | 1509 | 1518 | 355.2 |
| C | 13 | 61 | 10760 | 26.02 | 1509 | 1518 | 355.2 |
| D | 7 | 238 | 6052622 | 17897.39 | 1397 | 1356 | 338.1 |
| D | 11 | 176 | 644505 | 1902.19 | 1397 | 1356 | 338.1 |
| D | 1 | 52 | 212193 | 623.58 | 1397 | 1356 | 338.1 |
Histogram calculated using DETX and DETY for each event in the final _common_clean file
| Quadrant A |  |
 |
Quadrant B |
|---|---|---|---|
| Quadrant D |  |
 |
Quadrant C |
| Plot type | Count rate plots | Images |
|---|---|---|
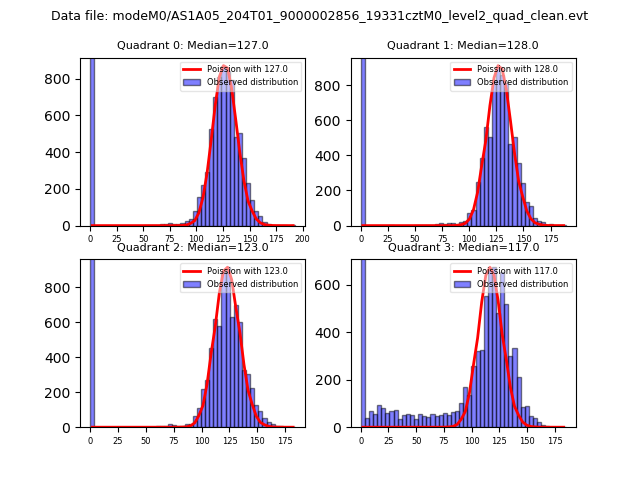
| Comparison with Poisson distribution Blue bars denote a histogram of data divided into 1 sec bins. Red curve is a Poisson curve with rate = median count rate of data. |
 |
 |
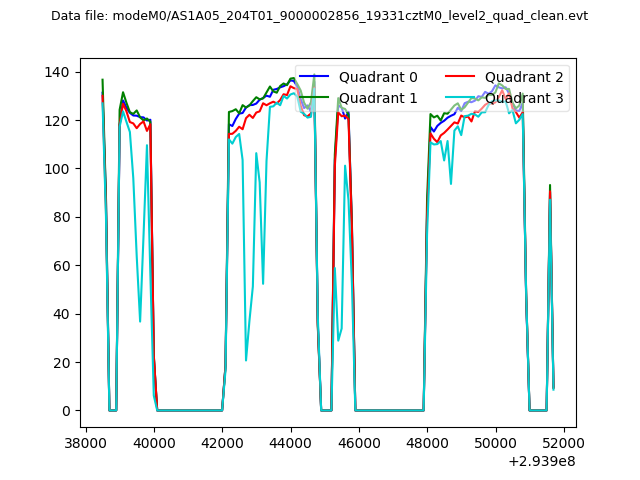
| Quadrant-wise count rates Data is divided into 100 sec bins |
 |
|
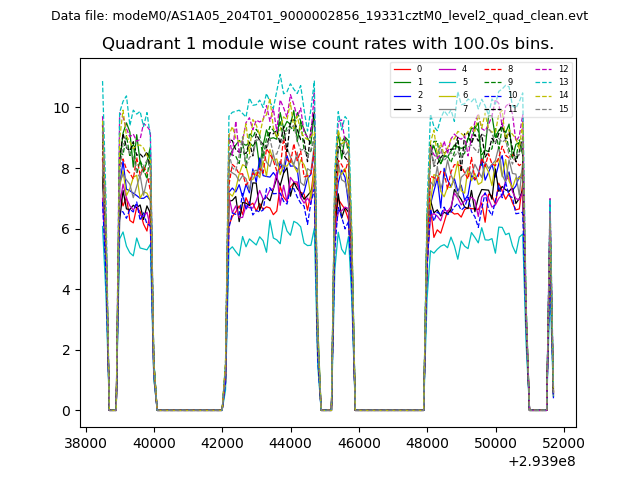
| Module-wise count rates for Quadrant A Data is divided into 100 sec bins |
 |
 |
| Module-wise count rates for Quadrant B Data is divided into 100 sec bins |
 |
 |
| Module-wise count rates for Quadrant C Data is divided into 100 sec bins |
 |
 |
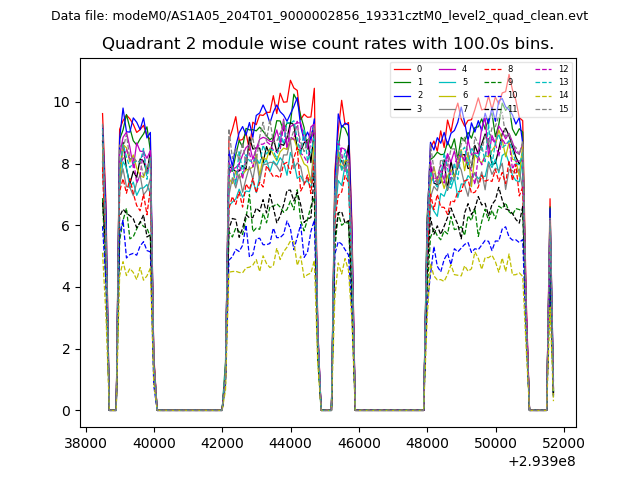
| Module-wise count rates for Quadrant D Data is divided into 100 sec bins |
 |
 |
| Parameter | Plot |
|---|---|
| CZT HV Monitor | 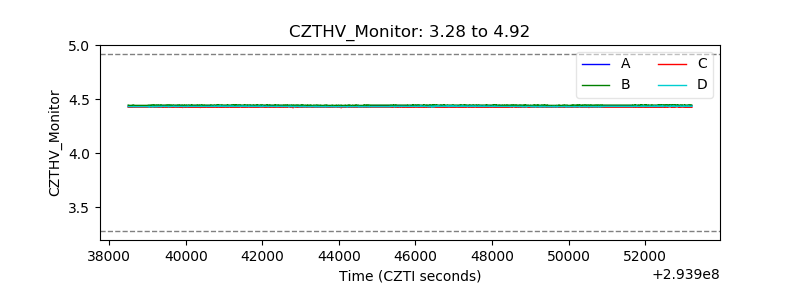 |
| D_VDD |  |
| Temperature 1 |  |
| Veto HV Monitor |  |
| Veto LLD |  |
| Alpha Counter | 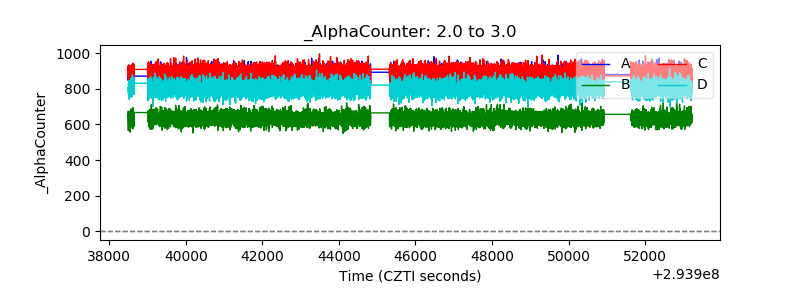 |
| _CPM_Rate | 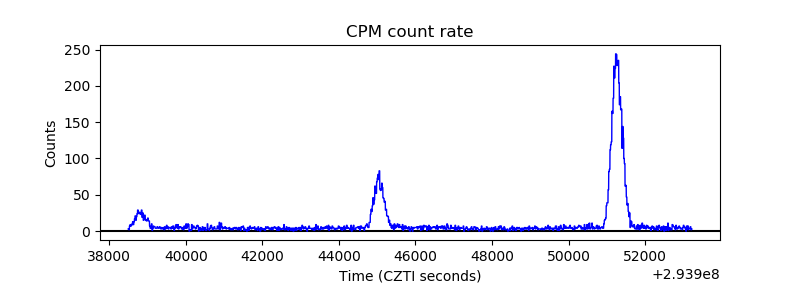 |
| CZT Counter |  |
| +2.5 Volts monitor |  |
| +5 Volts monitor |  |
| _ROLL_ROT |  |
| _Roll_DEC |  |
| _Roll_RA |  |
| Veto Counter |  |