| Param | Original file | Final file |
|---|---|---|
| Filename | modeM0/AS1A05_204T01_9000002856_19332cztM0_level2.evt | modeM0/AS1A05_204T01_9000002856_19332cztM0_level2_quad_clean.evt |
| Size (bytes) | 572,569,920 | 73,091,520 |
| Size | 546.0 MB | 69.7 MB |
| Events in quadrant A | 3,493,247 | 442,047 |
| Events in quadrant B | 3,472,814 | 446,053 |
| Events in quadrant C | 3,450,392 | 427,341 |
| Events in quadrant D | 6,443,305 | 403,739 |
| Mode M0 | |||
|---|---|---|---|
| Quadrant | BADHDUFLAG | Total packets | Discarded packets |
| A | 0 | 14851 | 2 |
| B | 0 | 14632 | 2 |
| C | 0 | 14601 | 2 |
| D | 0 | 24001 | 3 |
| Mode M9 | |||
|---|---|---|---|
| Quadrant | BADHDUFLAG | Total packets | Discarded packets |
| A | 0 | 16 | 0 |
| B | 0 | 16 | 0 |
| C | 0 | 16 | 0 |
| D | 0 | 16 | 0 |
| Mode SS | |||
|---|---|---|---|
| Quadrant | BADHDUFLAG | Total packets | Discarded packets |
| A | 0 | 144 | 0 |
| B | 0 | 144 | 0 |
| C | 0 | 144 | 0 |
| D | 0 | 144 | 0 |
| Quadrant | Total seconds | Saturated seconds | Saturation percentage |
|---|---|---|---|
| A | 7095 | 94 | 1.324877% |
| B | 7096 | 89 | 1.254228% |
| C | 7096 | 92 | 1.296505% |
| D | 7095 | 801 | 11.289641% |
Noise dominated data is calculated using 1-second bins in cleaned event files. If a bin has >2000 counts, and if more than 50% of those come from <1% of pixels, then it is considered to be noise-dominated and hence unusable.
| Quadrant | # 1 sec bins | Bins with >0 counts | Bins with >2000 counts | High rate bins dominated by noise | Noise dominated (total time) | Noise dominated (detector-on time) | Marked lightcurve |
|---|---|---|---|---|---|---|---|
| A | 8635 | 7095 | 12 | 12 | 0.14% | 0.17% | 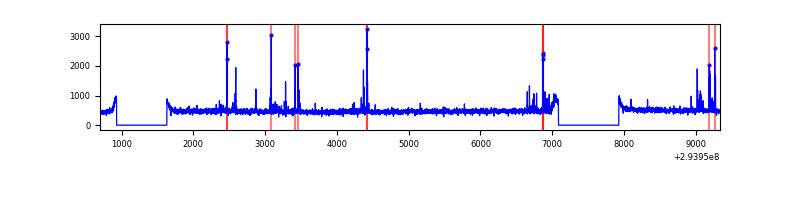 |
| B | 8636 | 7096 | 1 | 1 | 0.01% | 0.01% | 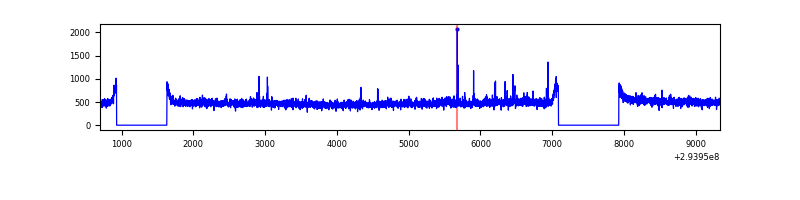 |
| C | 8636 | 7097 | 0 | 0 | 0.00% | 0.00% | 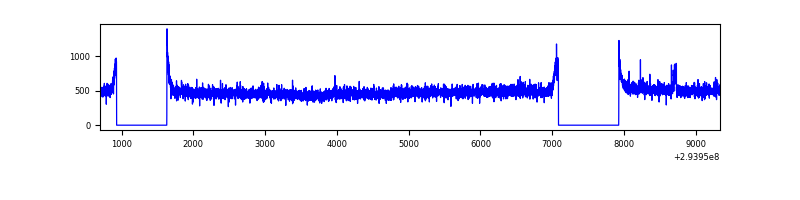 |
| D | 8635 | 7096 | 685 | 685 | 7.93% | 9.65% | 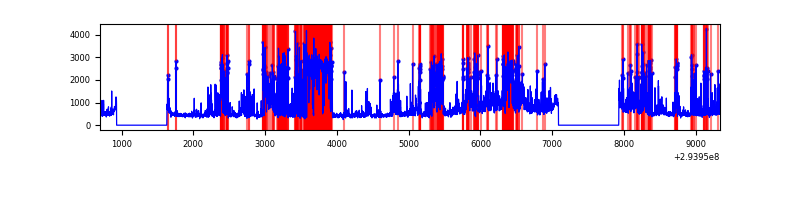 |
Top three noisy pixels from each quadrant. If the there are fewer than three noisy pixels in the level2.evt file, extra rows are filled as -1
| Pixel properties | Quadrant properties | ||||||
|---|---|---|---|---|---|---|---|
| Quadrant | DetID | PixID | Counts | Sigma | Mean | Median | Sigma |
| A | 5 | 16 | 121568 | 688.86 | 867 | 846 | 175.2 |
| A | 4 | 2 | 18993 | 103.55 | 867 | 846 | 175.2 |
| A | 11 | 29 | 16986 | 92.1 | 867 | 846 | 175.2 |
| B | 0 | 229 | 64940 | 382.88 | 864 | 840 | 167.4 |
| B | 12 | 111 | 20853 | 119.54 | 864 | 840 | 167.4 |
| B | 11 | 111 | 18615 | 106.17 | 864 | 840 | 167.4 |
| C | 14 | 238 | 128031 | 653.25 | 828 | 832 | 194.7 |
| C | 3 | 233 | 71733 | 364.12 | 828 | 832 | 194.7 |
| C | 9 | 54 | 11816 | 56.41 | 828 | 832 | 194.7 |
| D | 11 | 176 | 1571799 | 8041.68 | 799 | 777 | 195.4 |
| D | 1 | 52 | 1403226 | 7178.8 | 799 | 777 | 195.4 |
| D | 10 | 66 | 303323 | 1548.66 | 799 | 777 | 195.4 |
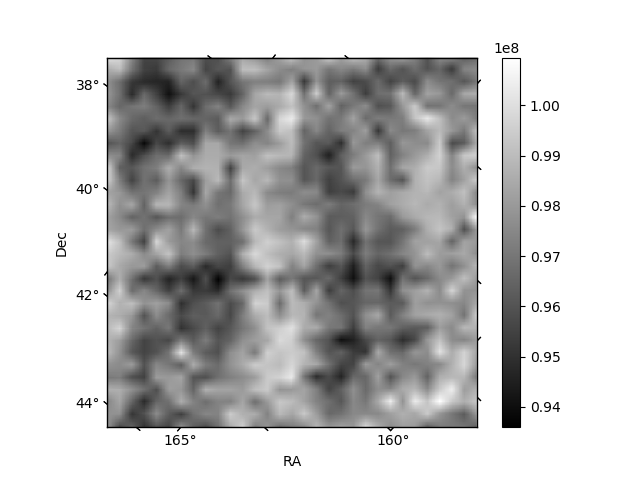
Histogram calculated using DETX and DETY for each event in the final _common_clean file
| Quadrant A |  |
 |
Quadrant B |
|---|---|---|---|
| Quadrant D |  |
 |
Quadrant C |
| Plot type | Count rate plots | Images |
|---|---|---|
| Comparison with Poisson distribution Blue bars denote a histogram of data divided into 1 sec bins. Red curve is a Poisson curve with rate = median count rate of data. |
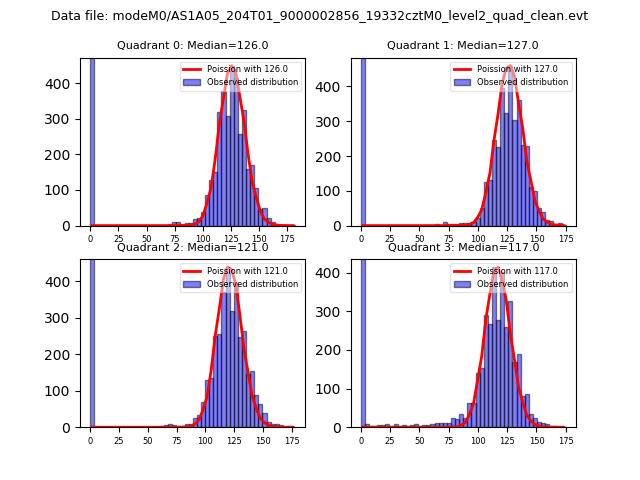 |
 |
| Quadrant-wise count rates Data is divided into 100 sec bins |
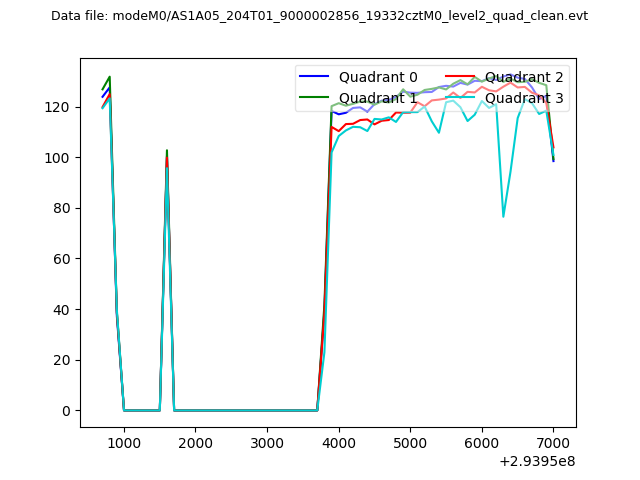 |
|
| Module-wise count rates for Quadrant A Data is divided into 100 sec bins |
 |
 |
| Module-wise count rates for Quadrant B Data is divided into 100 sec bins |
 |
 |
| Module-wise count rates for Quadrant C Data is divided into 100 sec bins |
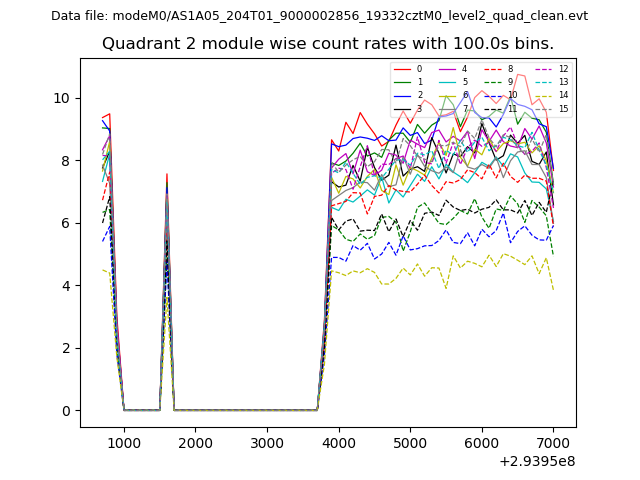 |
 |
| Module-wise count rates for Quadrant D Data is divided into 100 sec bins |
 |
 |
| Parameter | Plot |
|---|---|
| CZT HV Monitor | 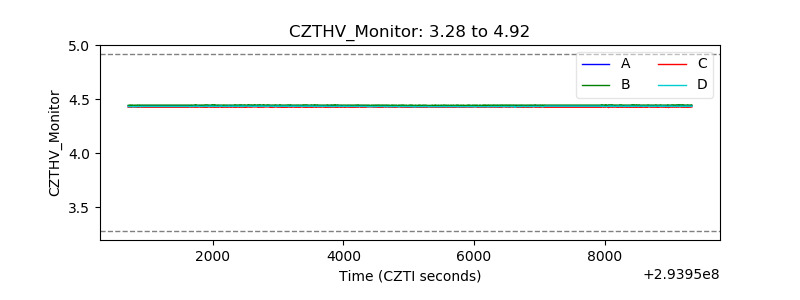 |
| D_VDD |  |
| Temperature 1 |  |
| Veto HV Monitor |  |
| Veto LLD |  |
| Alpha Counter | 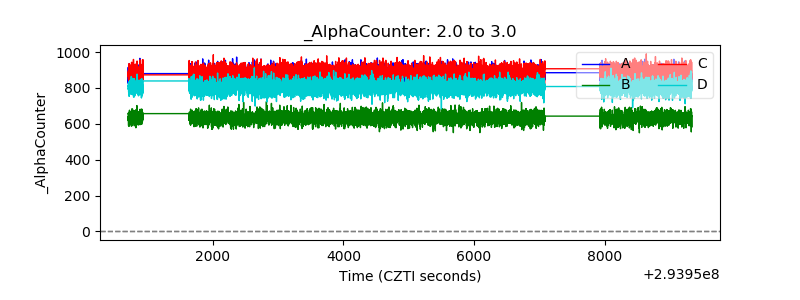 |
| _CPM_Rate | 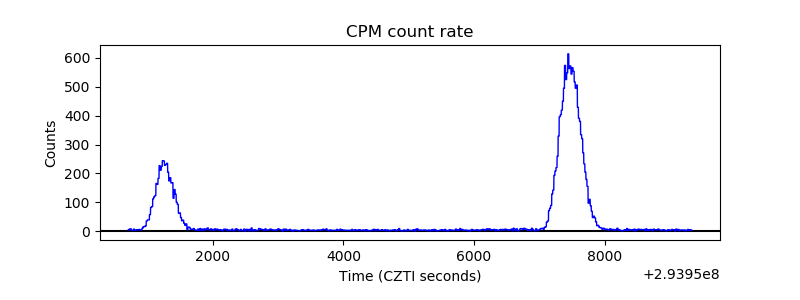 |
| CZT Counter |  |
| +2.5 Volts monitor |  |
| +5 Volts monitor |  |
| _ROLL_ROT |  |
| _Roll_DEC |  |
| _Roll_RA |  |
| Veto Counter |  |