| Param | Original file | Final file |
|---|---|---|
| Filename | modeM0/AS1A05_204T01_9000002856_19335cztM0_level2.evt | modeM0/AS1A05_204T01_9000002856_19335cztM0_level2_quad_clean.evt |
| Size (bytes) | 496,428,480 | 88,646,400 |
| Size | 473.4 MB | 84.5 MB |
| Events in quadrant A | 3,473,139 | 572,022 |
| Events in quadrant B | 3,556,374 | 572,680 |
| Events in quadrant C | 3,401,382 | 543,995 |
| Events in quadrant D | 4,155,831 | 535,950 |
| Mode M0 | |||
|---|---|---|---|
| Quadrant | BADHDUFLAG | Total packets | Discarded packets |
| A | 0 | 14571 | 3 |
| B | 0 | 14651 | 2 |
| C | 0 | 14115 | 2 |
| D | 0 | 16706 | 2 |
| Mode M9 | |||
|---|---|---|---|
| Quadrant | BADHDUFLAG | Total packets | Discarded packets |
| A | 0 | 20 | 0 |
| B | 0 | 21 | 0 |
| C | 0 | 21 | 0 |
| D | 0 | 21 | 0 |
| Mode SS | |||
|---|---|---|---|
| Quadrant | BADHDUFLAG | Total packets | Discarded packets |
| A | 0 | 132 | 0 |
| B | 0 | 132 | 0 |
| C | 0 | 132 | 0 |
| D | 0 | 132 | 0 |
| Quadrant | Total seconds | Saturated seconds | Saturation percentage |
|---|---|---|---|
| A | 6601 | 104 | 1.575519% |
| B | 6601 | 112 | 1.696713% |
| C | 6601 | 120 | 1.817906% |
| D | 6601 | 179 | 2.711710% |
Noise dominated data is calculated using 1-second bins in cleaned event files. If a bin has >2000 counts, and if more than 50% of those come from <1% of pixels, then it is considered to be noise-dominated and hence unusable.
| Quadrant | # 1 sec bins | Bins with >0 counts | Bins with >2000 counts | High rate bins dominated by noise | Noise dominated (total time) | Noise dominated (detector-on time) | Marked lightcurve |
|---|---|---|---|---|---|---|---|
| A | 7736 | 6601 | 21 | 21 | 0.27% | 0.32% | 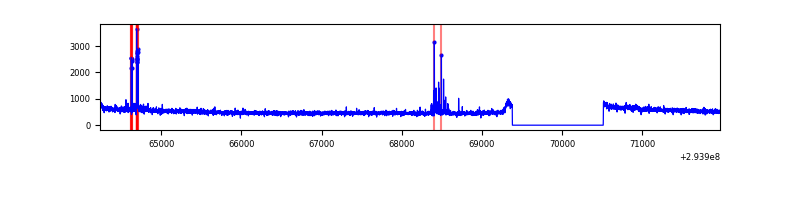 |
| B | 7736 | 6601 | 22 | 22 | 0.28% | 0.33% | 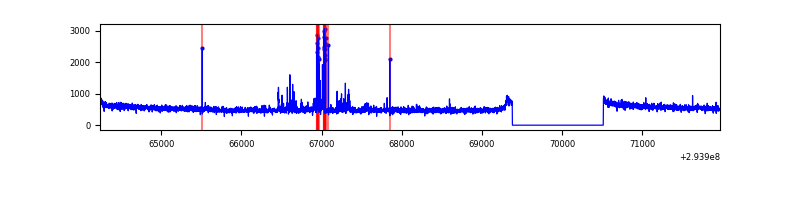 |
| C | 7736 | 6601 | 0 | 0 | 0.00% | 0.00% | 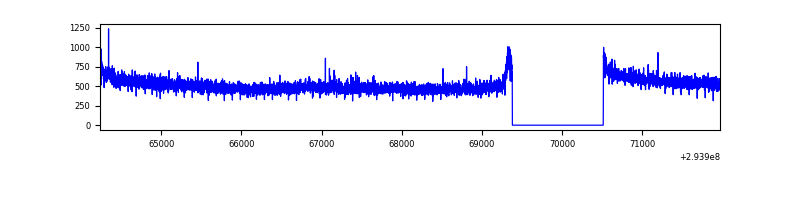 |
| D | 7736 | 6601 | 83 | 83 | 1.07% | 1.26% | 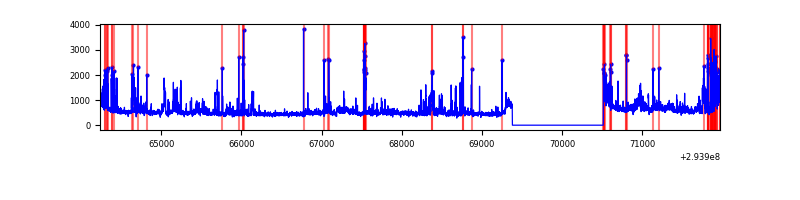 |
Top three noisy pixels from each quadrant. If the there are fewer than three noisy pixels in the level2.evt file, extra rows are filled as -1
| Pixel properties | Quadrant properties | ||||||
|---|---|---|---|---|---|---|---|
| Quadrant | DetID | PixID | Counts | Sigma | Mean | Median | Sigma |
| A | 5 | 16 | 85527 | 485.02 | 872 | 855 | 174.6 |
| A | 9 | 143 | 14795 | 79.85 | 872 | 855 | 174.6 |
| A | 11 | 29 | 11890 | 63.21 | 872 | 855 | 174.6 |
| B | 3 | 64 | 97164 | 594.92 | 856 | 836 | 161.9 |
| B | 0 | 190 | 55295 | 336.34 | 856 | 836 | 161.9 |
| B | 0 | 229 | 43505 | 263.52 | 856 | 836 | 161.9 |
| C | 14 | 238 | 131799 | 691.38 | 818 | 824 | 189.4 |
| C | 3 | 233 | 76996 | 402.09 | 818 | 824 | 189.4 |
| C | 13 | 61 | 5728 | 25.89 | 818 | 824 | 189.4 |
| D | 1 | 52 | 459981 | 2283.6 | 833 | 810 | 201.1 |
| D | 10 | 66 | 243418 | 1206.57 | 833 | 810 | 201.1 |
| D | 11 | 176 | 236839 | 1173.85 | 833 | 810 | 201.1 |
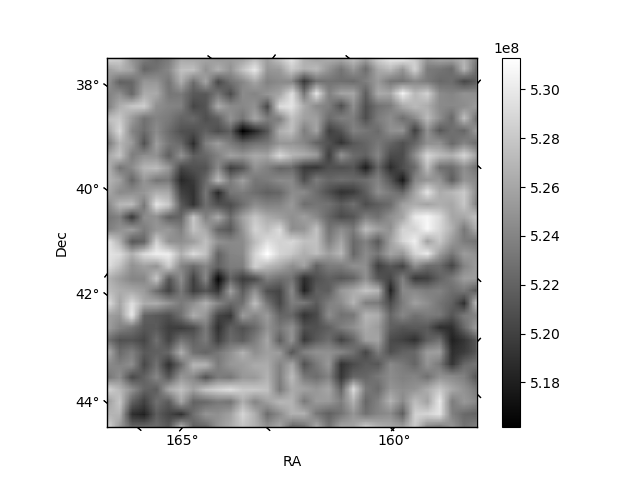
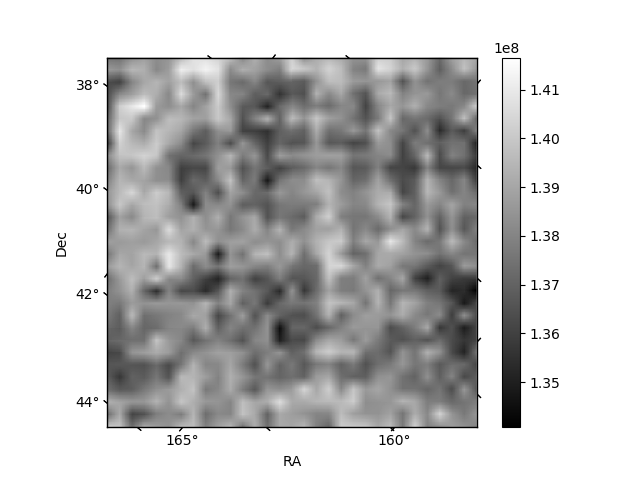
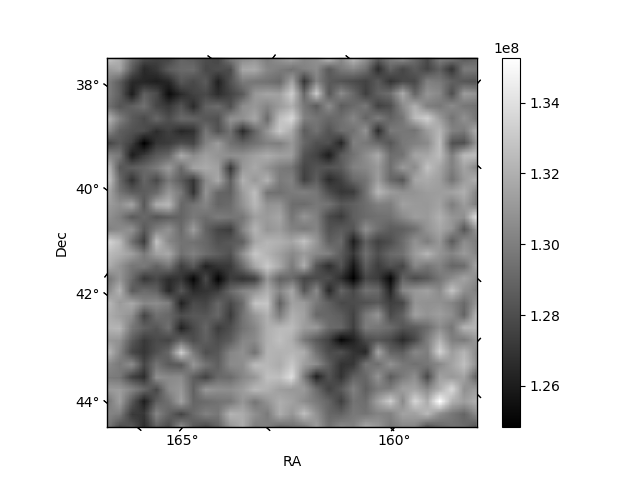
Histogram calculated using DETX and DETY for each event in the final _common_clean file
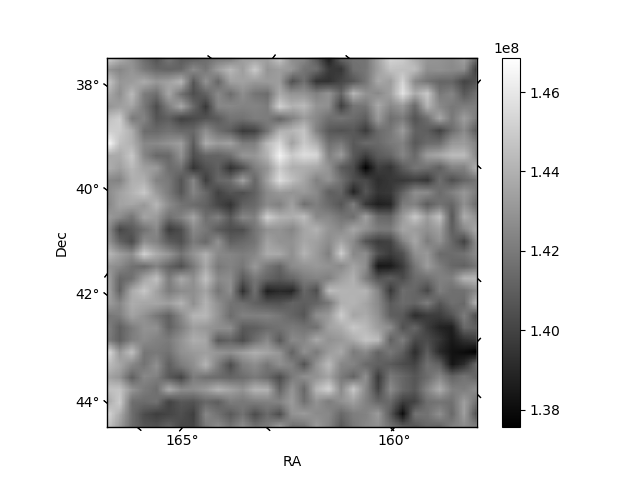
| Quadrant A | 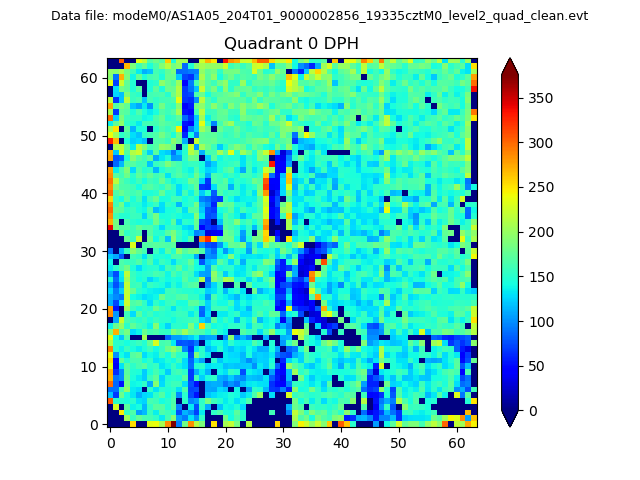 |
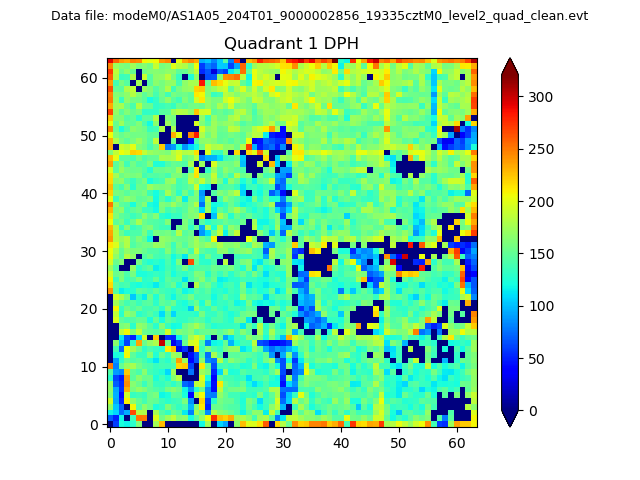 |
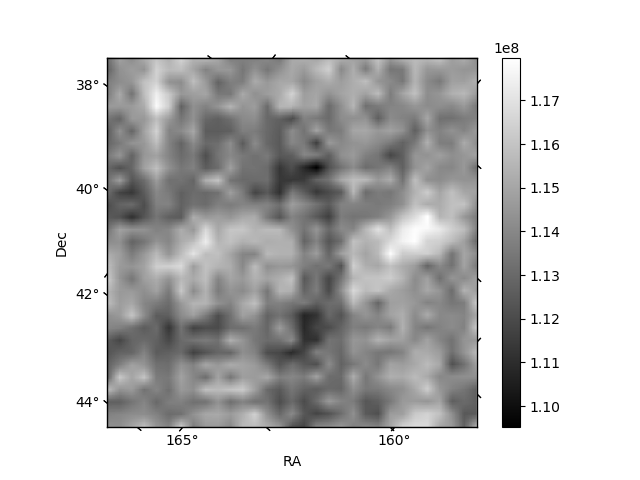
Quadrant B |
|---|---|---|---|
| Quadrant D | 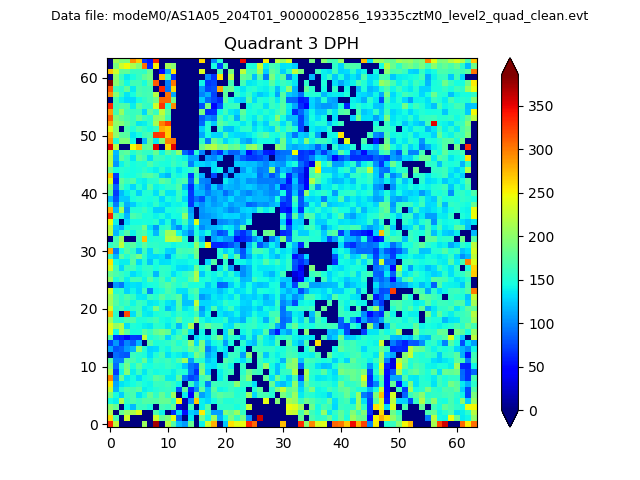 |
 |
Quadrant C |
| Plot type | Count rate plots | Images |
|---|---|---|
| Comparison with Poisson distribution Blue bars denote a histogram of data divided into 1 sec bins. Red curve is a Poisson curve with rate = median count rate of data. |
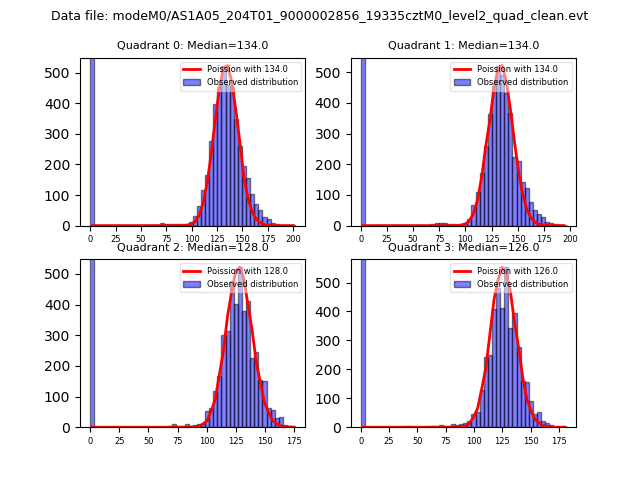 |
 |
| Quadrant-wise count rates Data is divided into 100 sec bins |
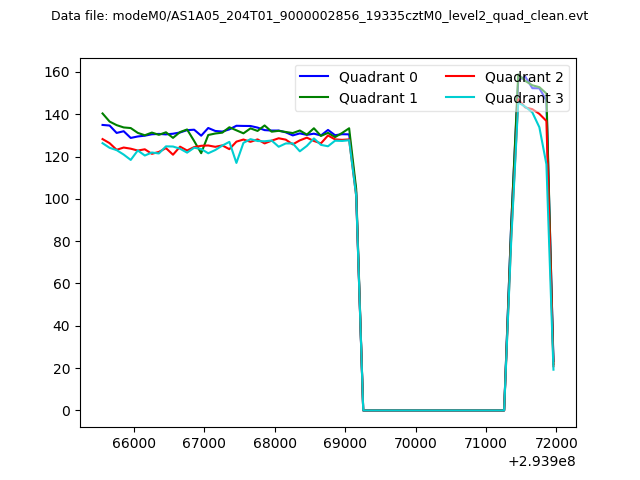 |
|
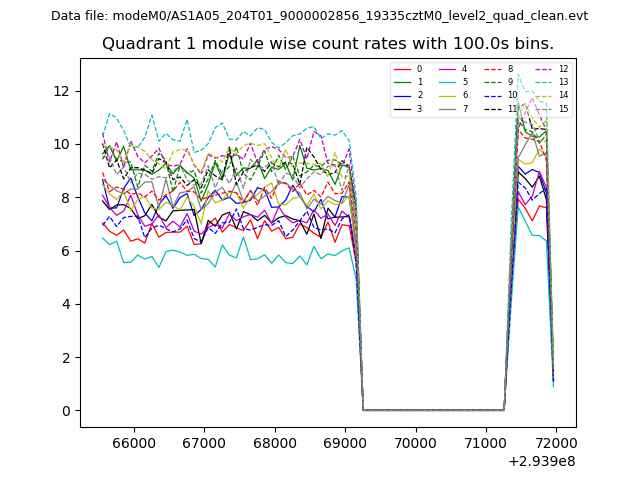
| Module-wise count rates for Quadrant A Data is divided into 100 sec bins |
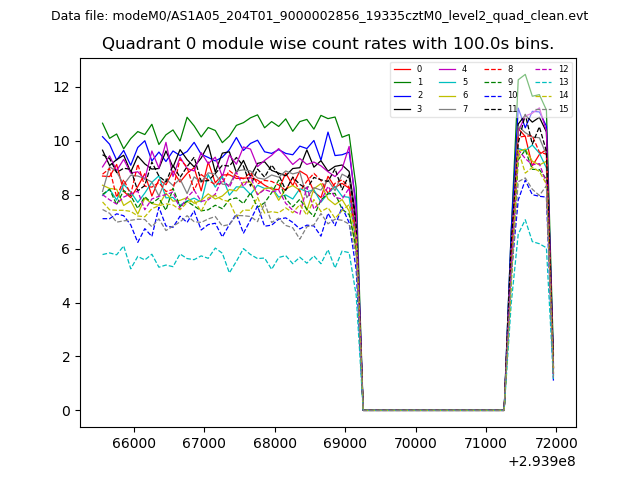 |
 |
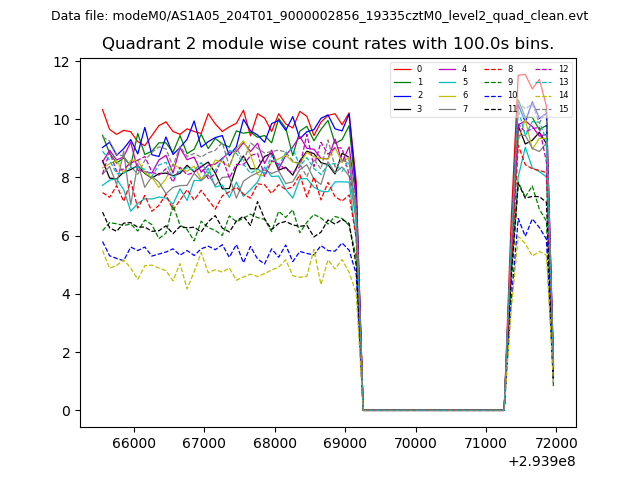
| Module-wise count rates for Quadrant B Data is divided into 100 sec bins |
 |
 |
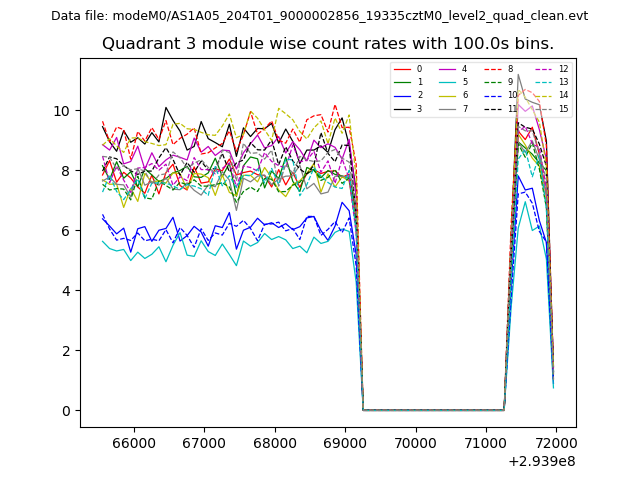
| Module-wise count rates for Quadrant C Data is divided into 100 sec bins |
 |
 |
| Module-wise count rates for Quadrant D Data is divided into 100 sec bins |
 |
 |
| Parameter | Plot |
|---|---|
| CZT HV Monitor | 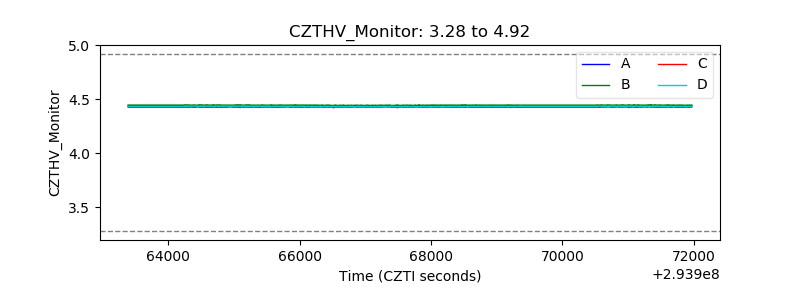 |
| D_VDD | 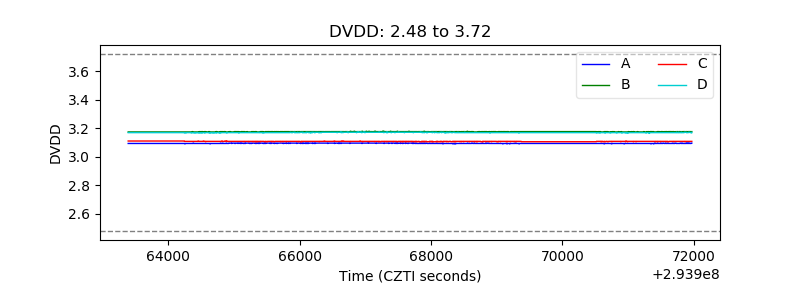 |
| Temperature 1 | 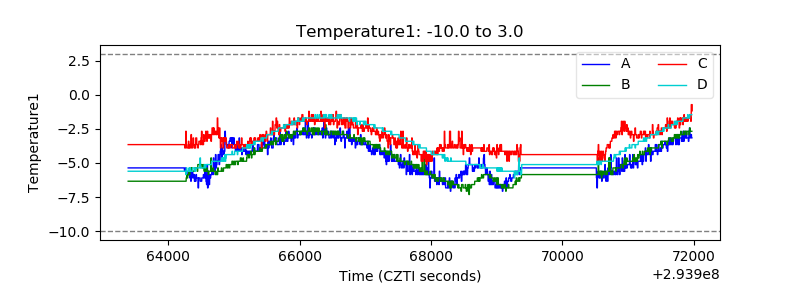 |
| Veto HV Monitor | 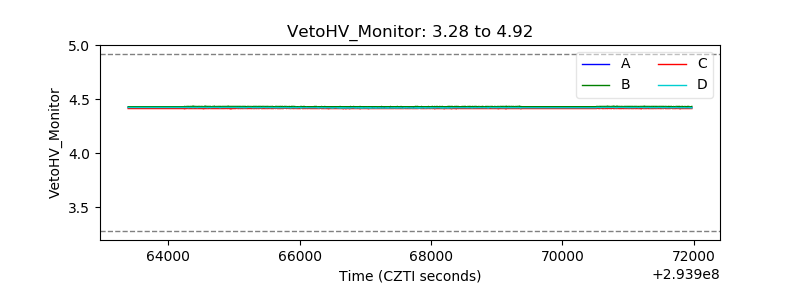 |
| Veto LLD | 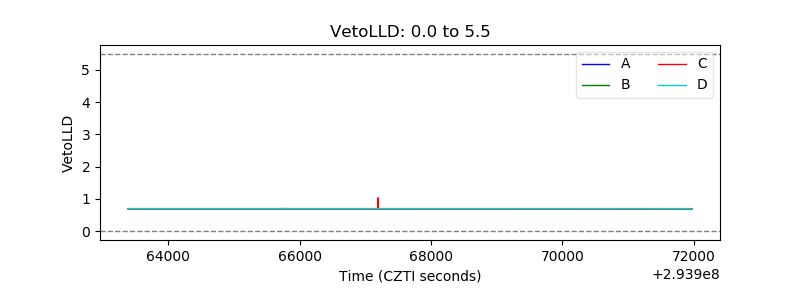 |
| Alpha Counter | 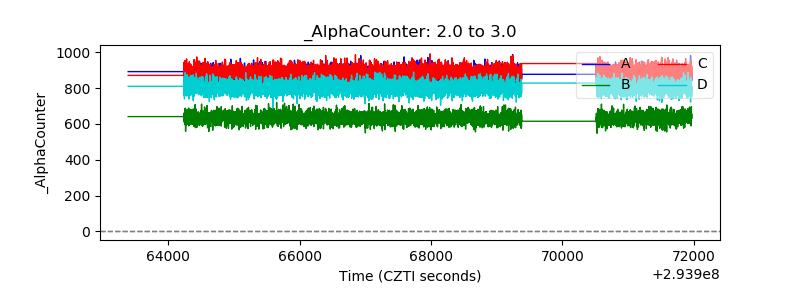 |
| _CPM_Rate | 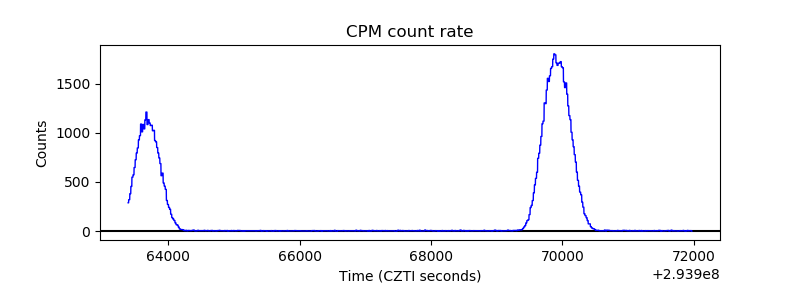 |
| CZT Counter |  |
| +2.5 Volts monitor |  |
| +5 Volts monitor | 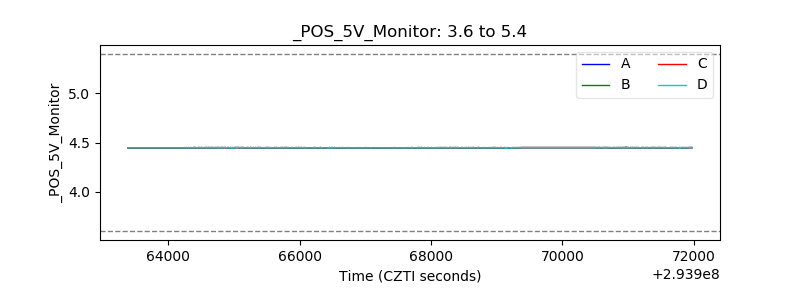 |
| _ROLL_ROT | 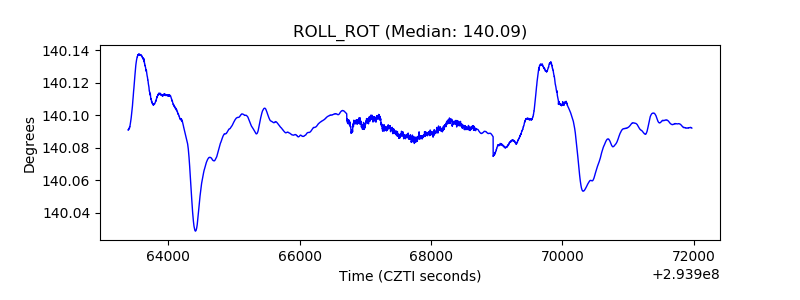 |
| _Roll_DEC | 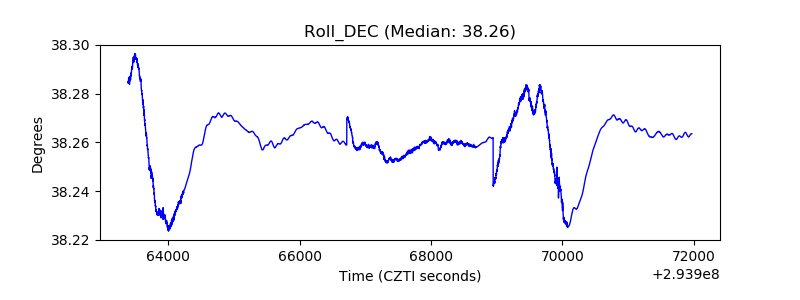 |
| _Roll_RA | 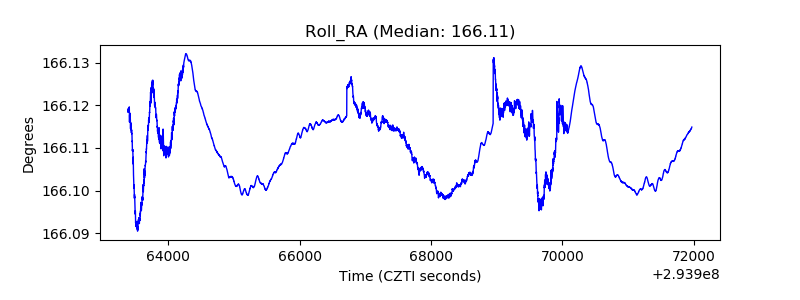 |
| Veto Counter | 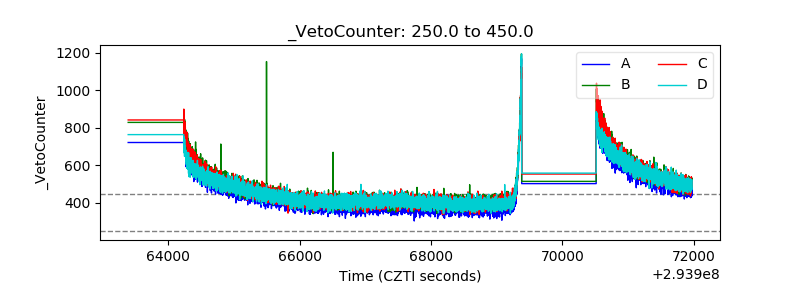 |