| Param | Original file | Final file |
|---|---|---|
| Filename | modeM0/AS1A05_204T01_9000002856_19336cztM0_level2.evt | modeM0/AS1A05_204T01_9000002856_19336cztM0_level2_quad_clean.evt |
| Size (bytes) | 638,421,120 | 100,687,680 |
| Size | 608.8 MB | 96.0 MB |
| Events in quadrant A | 3,520,670 | 694,488 |
| Events in quadrant B | 3,587,868 | 694,058 |
| Events in quadrant C | 3,496,591 | 652,632 |
| Events in quadrant D | 8,290,023 | 554,405 |
| Mode M0 | |||
|---|---|---|---|
| Quadrant | BADHDUFLAG | Total packets | Discarded packets |
| A | 0 | 14730 | 2 |
| B | 0 | 14808 | 2 |
| C | 0 | 14449 | 2 |
| D | 0 | 29197 | 2 |
| Mode M9 | |||
|---|---|---|---|
| Quadrant | BADHDUFLAG | Total packets | Discarded packets |
| A | 0 | 17 | 0 |
| B | 0 | 18 | 0 |
| C | 0 | 18 | 0 |
| D | 0 | 18 | 0 |
| Mode SS | |||
|---|---|---|---|
| Quadrant | BADHDUFLAG | Total packets | Discarded packets |
| A | 0 | 132 | 0 |
| B | 0 | 132 | 0 |
| C | 0 | 132 | 0 |
| D | 0 | 132 | 0 |
| Quadrant | Total seconds | Saturated seconds | Saturation percentage |
|---|---|---|---|
| A | 6496 | 77 | 1.185345% |
| B | 6496 | 75 | 1.154557% |
| C | 6496 | 115 | 1.770320% |
| D | 6496 | 1556 | 23.953202% |
Noise dominated data is calculated using 1-second bins in cleaned event files. If a bin has >2000 counts, and if more than 50% of those come from <1% of pixels, then it is considered to be noise-dominated and hence unusable.
| Quadrant | # 1 sec bins | Bins with >0 counts | Bins with >2000 counts | High rate bins dominated by noise | Noise dominated (total time) | Noise dominated (detector-on time) | Marked lightcurve |
|---|---|---|---|---|---|---|---|
| A | 7746 | 6496 | 6 | 6 | 0.08% | 0.09% | 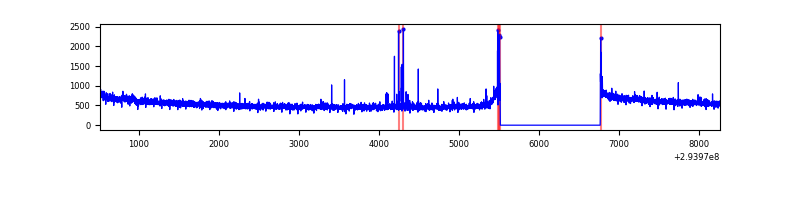 |
| B | 7746 | 6496 | 2 | 2 | 0.03% | 0.03% | 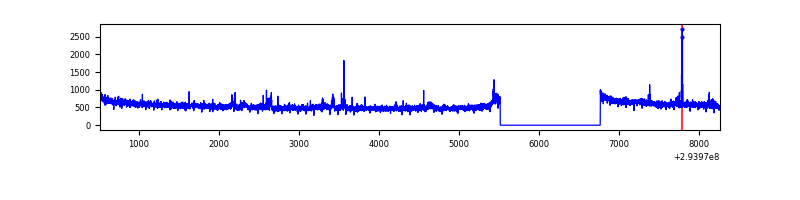 |
| C | 7746 | 6496 | 0 | 0 | 0.00% | 0.00% | 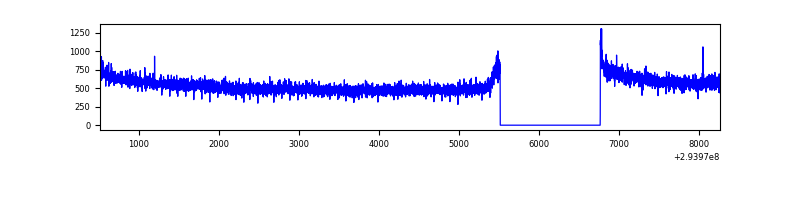 |
| D | 7745 | 6495 | 1471 | 1471 | 18.99% | 22.65% | 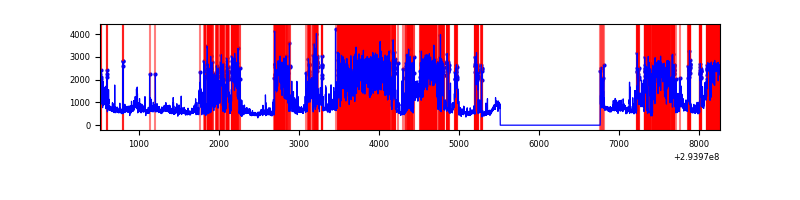 |
Top three noisy pixels from each quadrant. If the there are fewer than three noisy pixels in the level2.evt file, extra rows are filled as -1
| Pixel properties | Quadrant properties | ||||||
|---|---|---|---|---|---|---|---|
| Quadrant | DetID | PixID | Counts | Sigma | Mean | Median | Sigma |
| A | 5 | 16 | 48740 | 268.3 | 898 | 881 | 178.4 |
| A | 13 | 252 | 9817 | 50.1 | 898 | 881 | 178.4 |
| A | 0 | 226 | 7927 | 39.5 | 898 | 881 | 178.4 |
| B | 0 | 229 | 72219 | 435.66 | 879 | 860 | 163.8 |
| B | 0 | 190 | 24951 | 147.08 | 879 | 860 | 163.8 |
| B | 0 | 230 | 22079 | 129.55 | 879 | 860 | 163.8 |
| C | 14 | 238 | 134863 | 688.6 | 842 | 849 | 194.6 |
| C | 3 | 233 | 78954 | 401.33 | 842 | 849 | 194.6 |
| C | 13 | 61 | 6022 | 26.58 | 842 | 849 | 194.6 |
| D | 7 | 238 | 4316588 | 22247.13 | 798 | 777 | 194.0 |
| D | 1 | 52 | 393921 | 2026.58 | 798 | 777 | 194.0 |
| D | 10 | 66 | 294566 | 1514.42 | 798 | 777 | 194.0 |
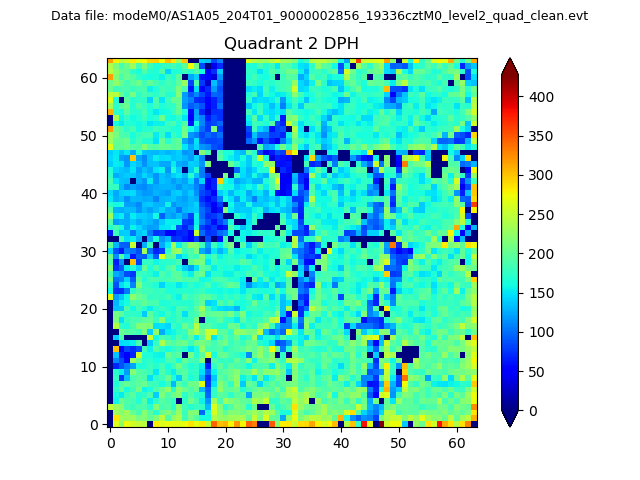
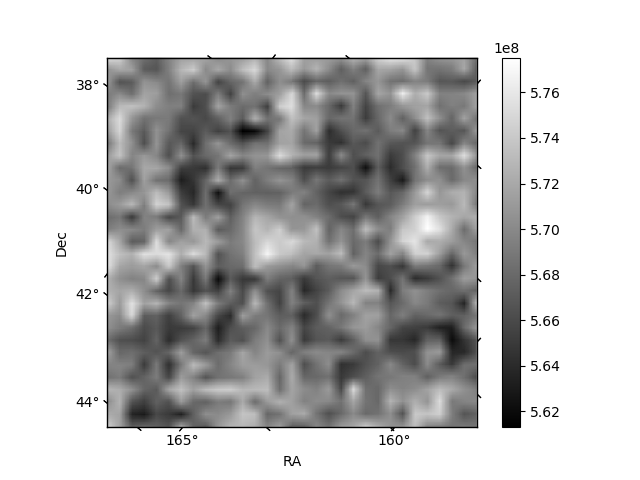
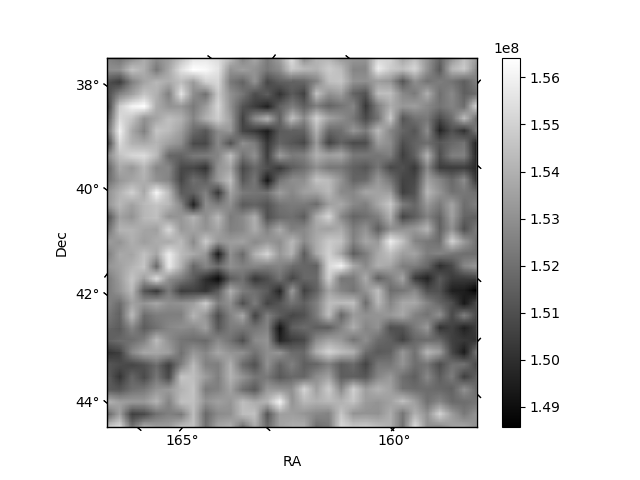
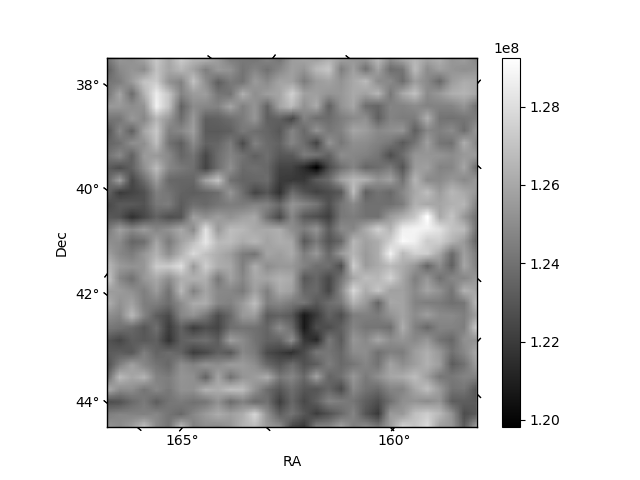
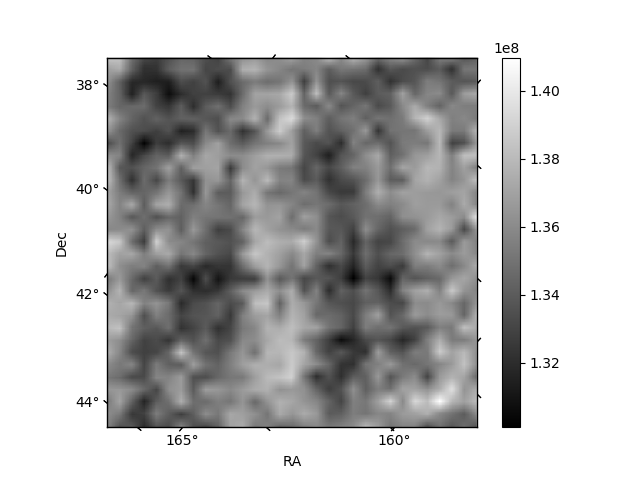
Histogram calculated using DETX and DETY for each event in the final _common_clean file
| Quadrant A | 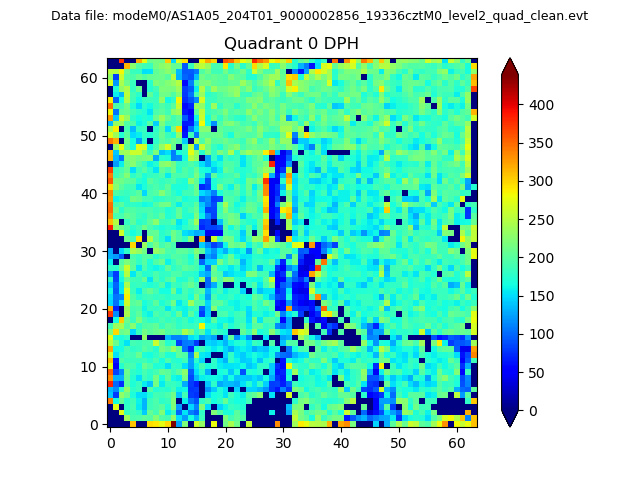 |
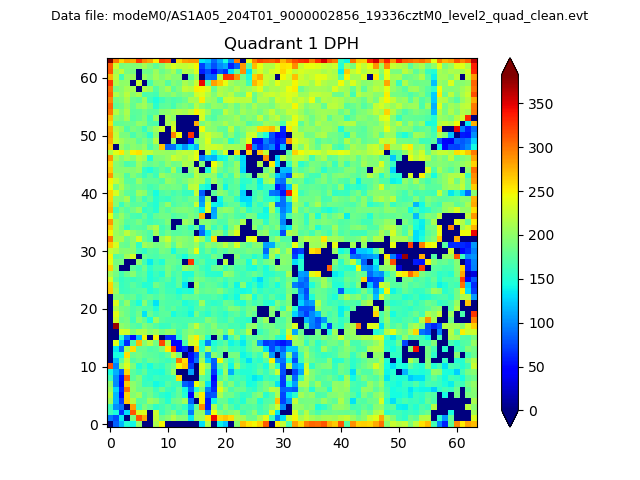 |
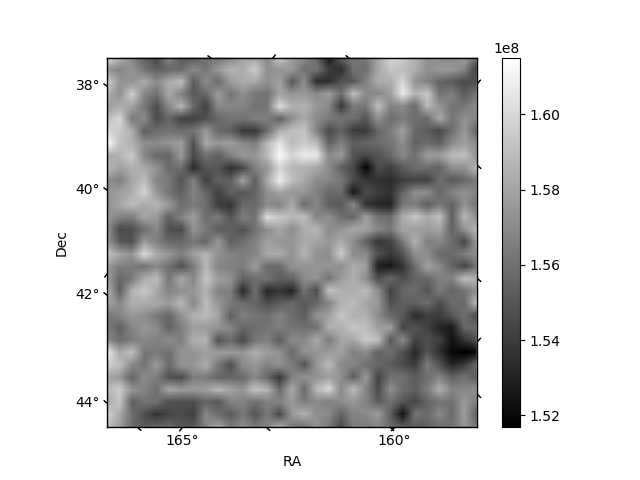
Quadrant B |
|---|---|---|---|
| Quadrant D | 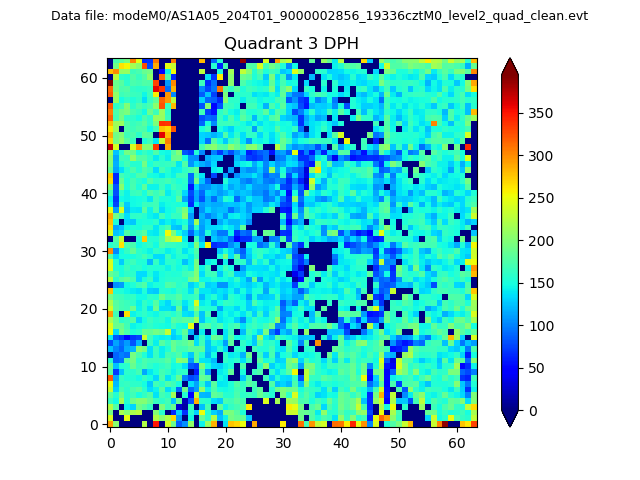 |
 |
Quadrant C |
| Plot type | Count rate plots | Images |
|---|---|---|
| Comparison with Poisson distribution Blue bars denote a histogram of data divided into 1 sec bins. Red curve is a Poisson curve with rate = median count rate of data. |
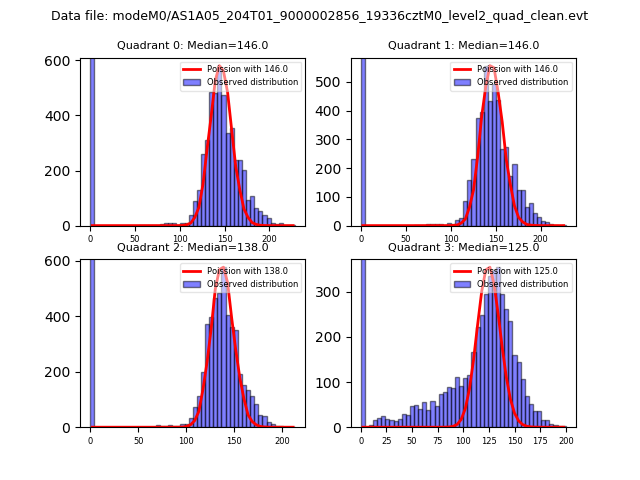 |
 |
| Quadrant-wise count rates Data is divided into 100 sec bins |
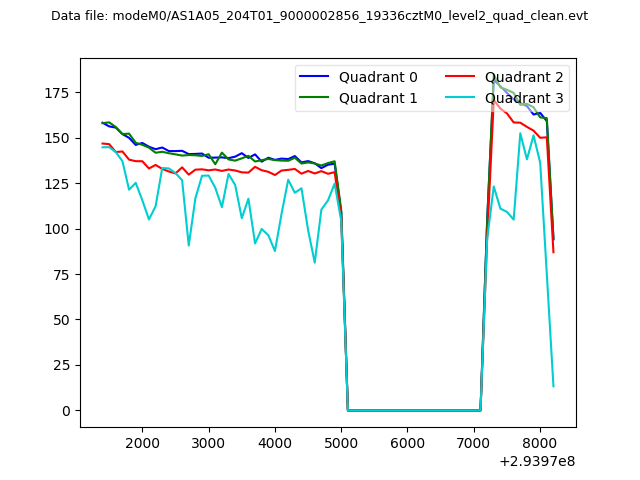 |
|
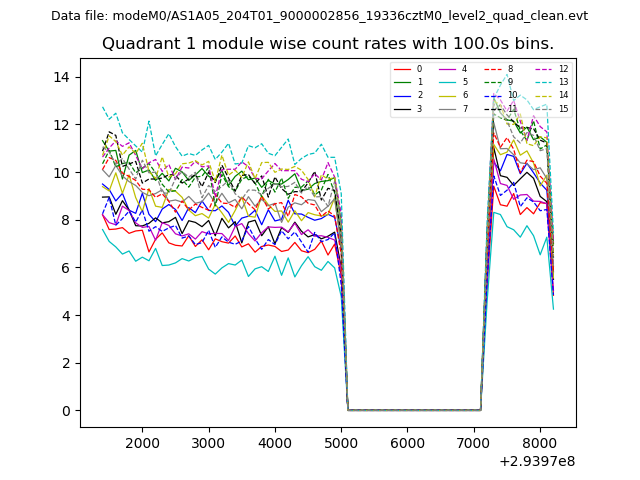
| Module-wise count rates for Quadrant A Data is divided into 100 sec bins |
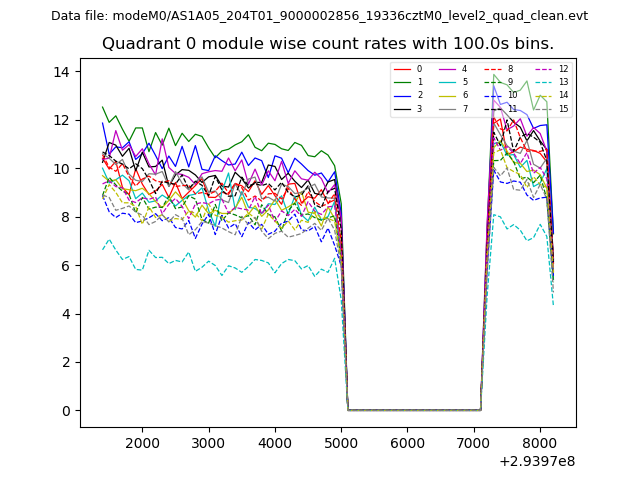 |
 |
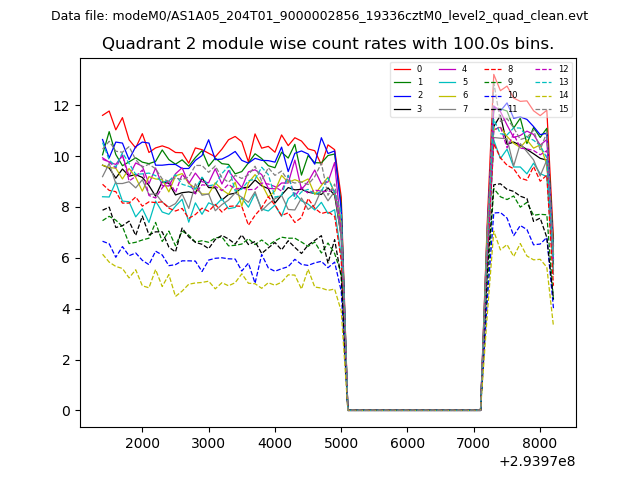
| Module-wise count rates for Quadrant B Data is divided into 100 sec bins |
 |
 |
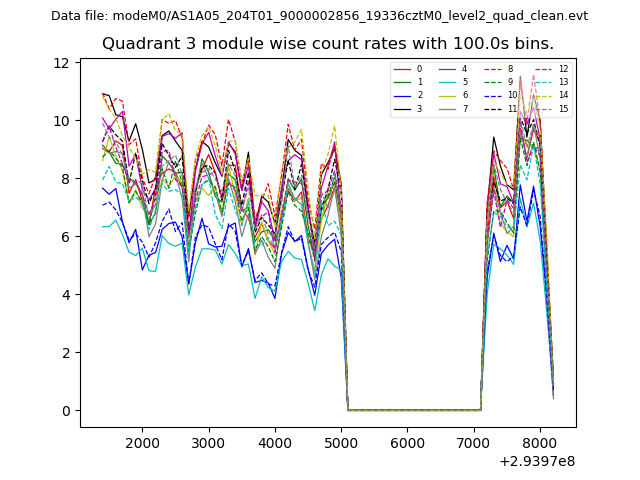
| Module-wise count rates for Quadrant C Data is divided into 100 sec bins |
 |
 |
| Module-wise count rates for Quadrant D Data is divided into 100 sec bins |
 |
 |
| Parameter | Plot |
|---|---|
| CZT HV Monitor | 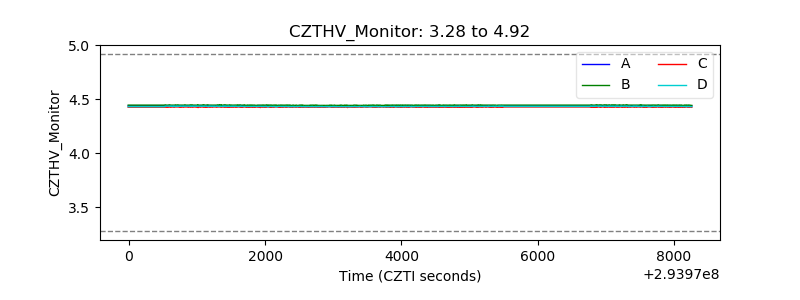 |
| D_VDD | 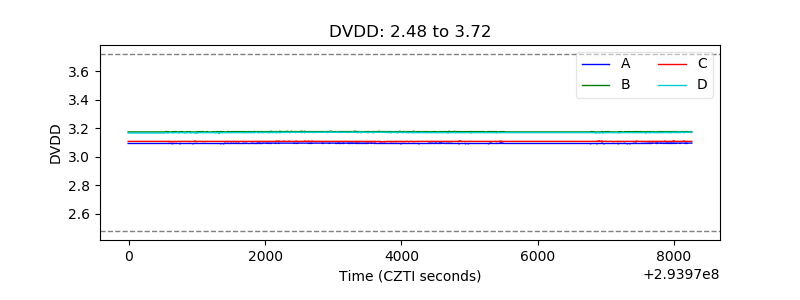 |
| Temperature 1 | 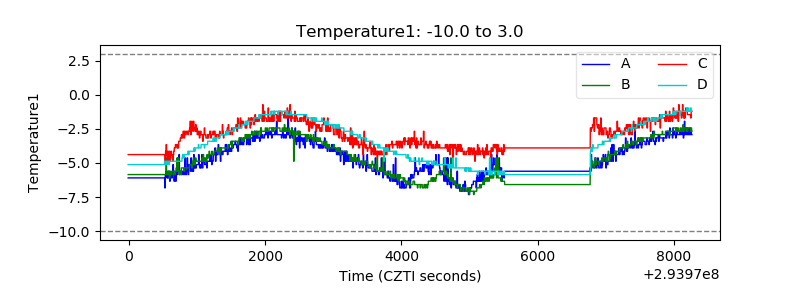 |
| Veto HV Monitor | 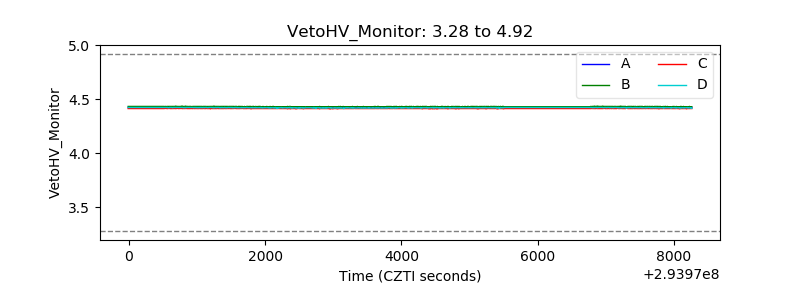 |
| Veto LLD | 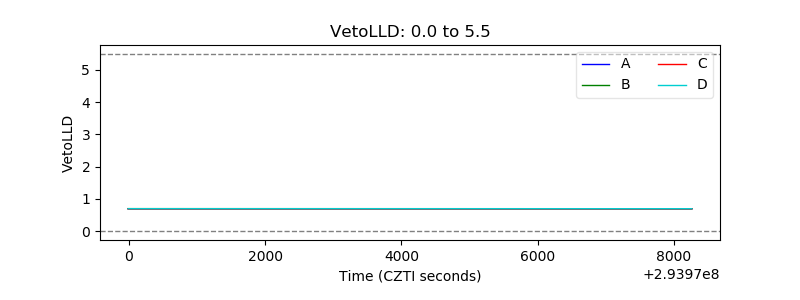 |
| Alpha Counter | 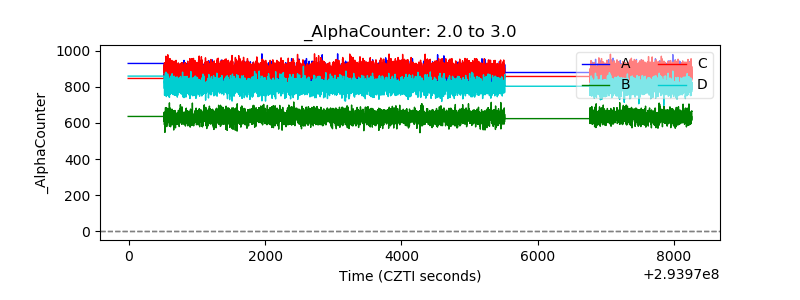 |
| _CPM_Rate | 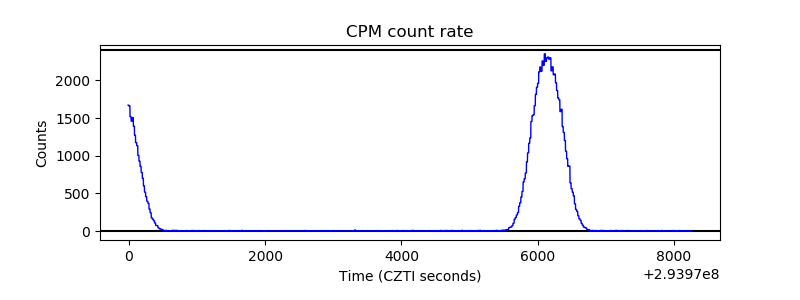 |
| CZT Counter | 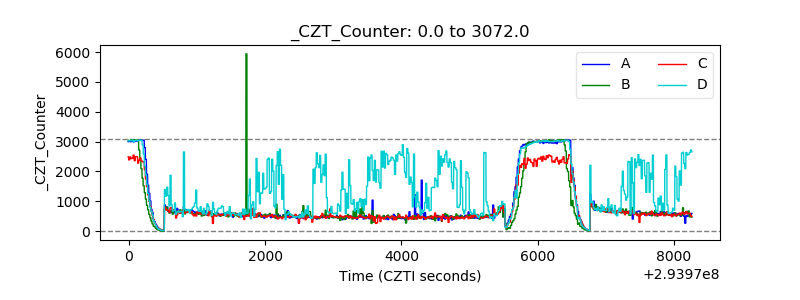 |
| +2.5 Volts monitor |  |
| +5 Volts monitor |  |
| _ROLL_ROT |  |
| _Roll_DEC | 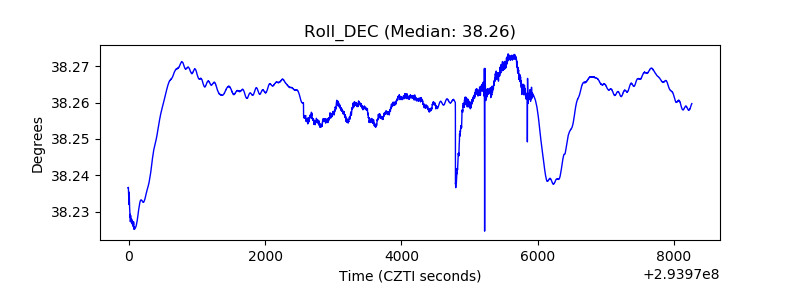 |
| _Roll_RA | 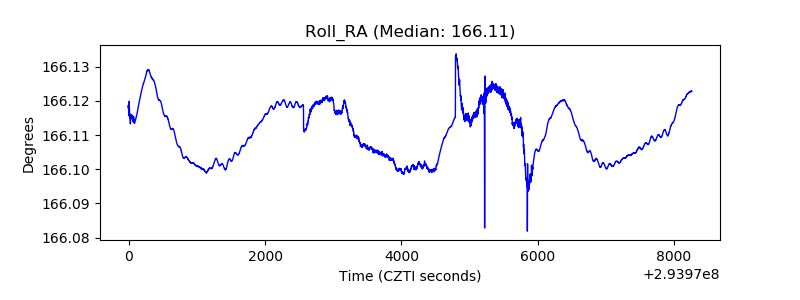 |
| Veto Counter | 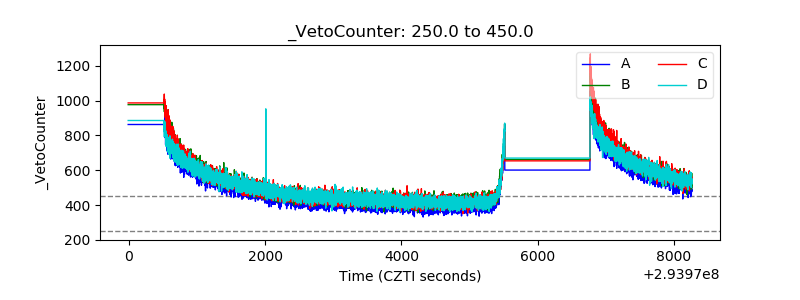 |