| Param | Original file | Final file |
|---|---|---|
| Filename | modeM0/AS1A05_204T01_9000002856_19337cztM0_level2.evt | modeM0/AS1A05_204T01_9000002856_19337cztM0_level2_quad_clean.evt |
| Size (bytes) | 696,839,040 | 114,819,840 |
| Size | 664.6 MB | 109.5 MB |
| Events in quadrant A | 3,561,543 | 814,433 |
| Events in quadrant B | 3,662,632 | 811,385 |
| Events in quadrant C | 4,332,119 | 760,288 |
| Events in quadrant D | 9,112,857 | 642,074 |
| Mode M0 | |||
|---|---|---|---|
| Quadrant | BADHDUFLAG | Total packets | Discarded packets |
| A | 0 | 14788 | 2 |
| B | 0 | 15180 | 2 |
| C | 0 | 17009 | 2 |
| D | 0 | 31529 | 2 |
| Mode M9 | |||
|---|---|---|---|
| Quadrant | BADHDUFLAG | Total packets | Discarded packets |
| A | 0 | 15 | 0 |
| B | 0 | 16 | 0 |
| C | 0 | 16 | 0 |
| D | 0 | 16 | 0 |
| Mode SS | |||
|---|---|---|---|
| Quadrant | BADHDUFLAG | Total packets | Discarded packets |
| A | 0 | 130 | 0 |
| B | 0 | 130 | 0 |
| C | 0 | 130 | 0 |
| D | 0 | 130 | 0 |
| Quadrant | Total seconds | Saturated seconds | Saturation percentage |
|---|---|---|---|
| A | 6434 | 81 | 1.258937% |
| B | 6434 | 99 | 1.538701% |
| C | 6433 | 220 | 3.419866% |
| D | 6433 | 2178 | 33.856677% |
Noise dominated data is calculated using 1-second bins in cleaned event files. If a bin has >2000 counts, and if more than 50% of those come from <1% of pixels, then it is considered to be noise-dominated and hence unusable.
| Quadrant | # 1 sec bins | Bins with >0 counts | Bins with >2000 counts | High rate bins dominated by noise | Noise dominated (total time) | Noise dominated (detector-on time) | Marked lightcurve |
|---|---|---|---|---|---|---|---|
| A | 7749 | 6434 | 3 | 3 | 0.04% | 0.05% | 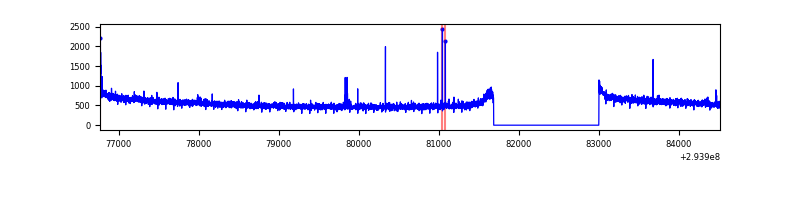 |
| B | 7749 | 6434 | 4 | 4 | 0.05% | 0.06% | 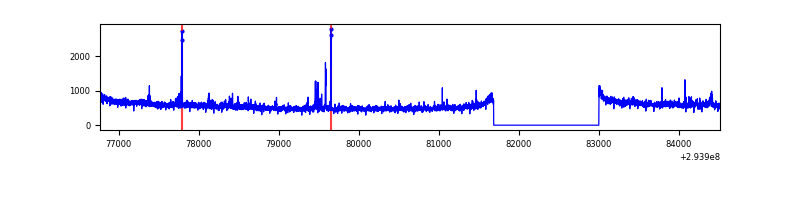 |
| C | 7748 | 6433 | 12 | 12 | 0.15% | 0.19% | 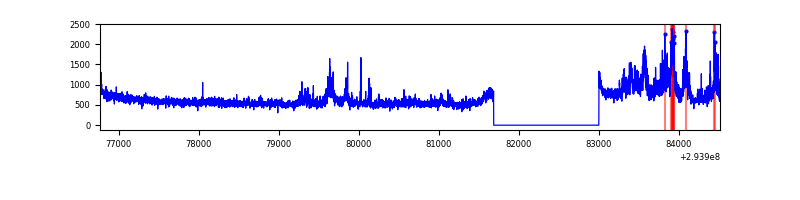 |
| D | 7748 | 6433 | 1871 | 1871 | 24.15% | 29.08% | 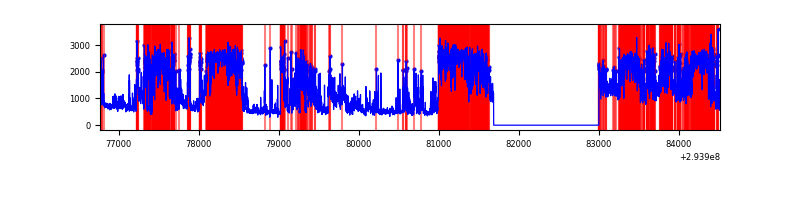 |
Top three noisy pixels from each quadrant. If the there are fewer than three noisy pixels in the level2.evt file, extra rows are filled as -1
| Pixel properties | Quadrant properties | ||||||
|---|---|---|---|---|---|---|---|
| Quadrant | DetID | PixID | Counts | Sigma | Mean | Median | Sigma |
| A | 5 | 16 | 35322 | 189.88 | 911 | 895 | 181.3 |
| A | 11 | 29 | 20240 | 106.69 | 911 | 895 | 181.3 |
| A | 0 | 226 | 8141 | 39.96 | 911 | 895 | 181.3 |
| B | 0 | 229 | 93202 | 556.02 | 889 | 869 | 166.1 |
| B | 0 | 190 | 32176 | 188.53 | 889 | 869 | 166.1 |
| B | 3 | 64 | 26642 | 155.2 | 889 | 869 | 166.1 |
| C | 3 | 233 | 860638 | 4359.61 | 856 | 862 | 197.2 |
| C | 14 | 238 | 135949 | 684.98 | 856 | 862 | 197.2 |
| C | 13 | 61 | 6097 | 26.54 | 856 | 862 | 197.2 |
| D | 7 | 238 | 3787441 | 20678.94 | 762 | 742 | 183.1 |
| D | 10 | 66 | 1569206 | 8565.29 | 762 | 742 | 183.1 |
| D | 1 | 52 | 703245 | 3836.33 | 762 | 742 | 183.1 |
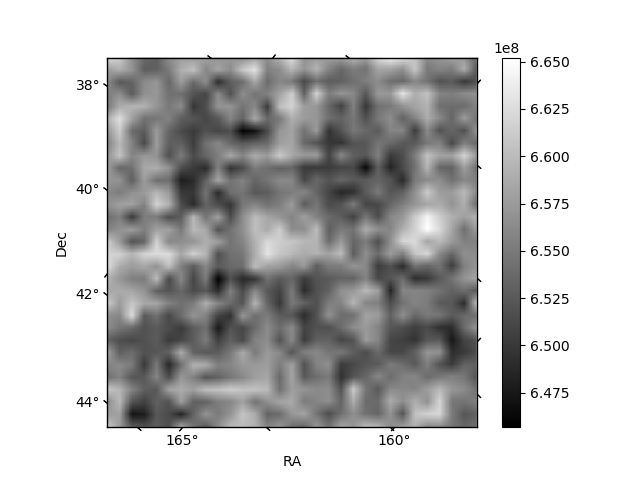
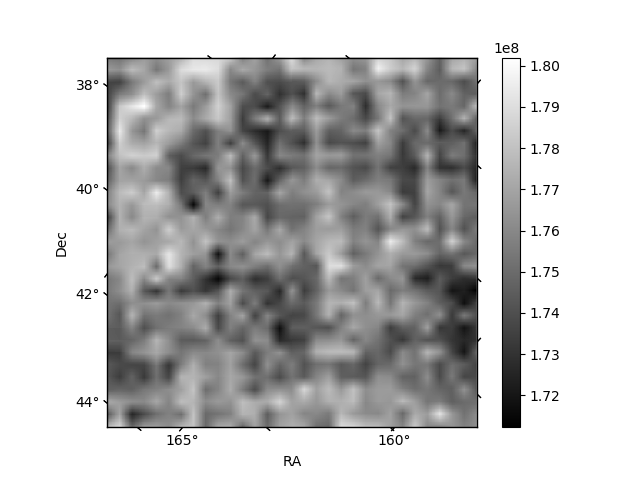
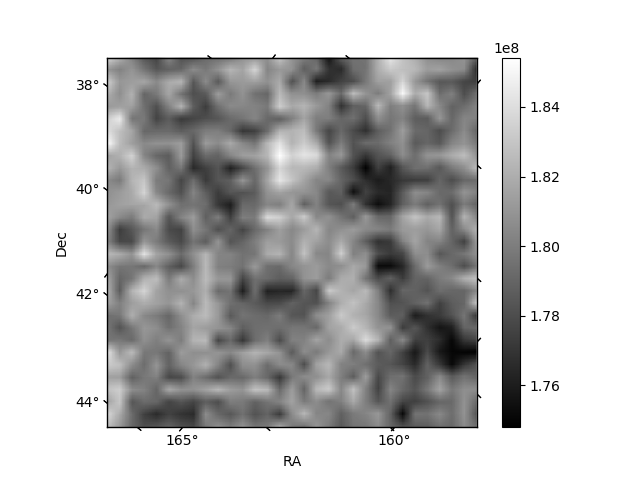
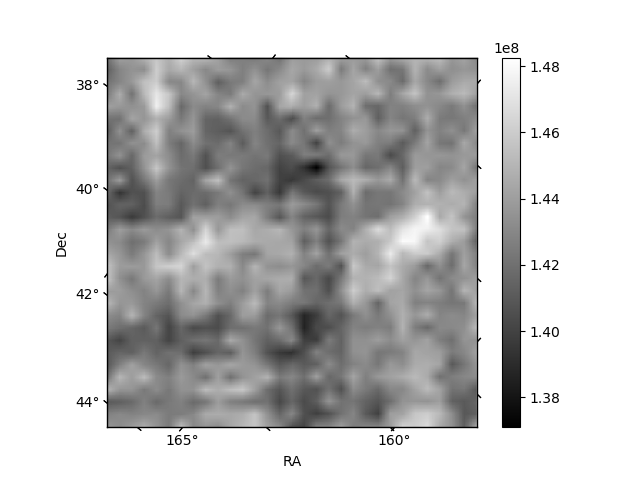
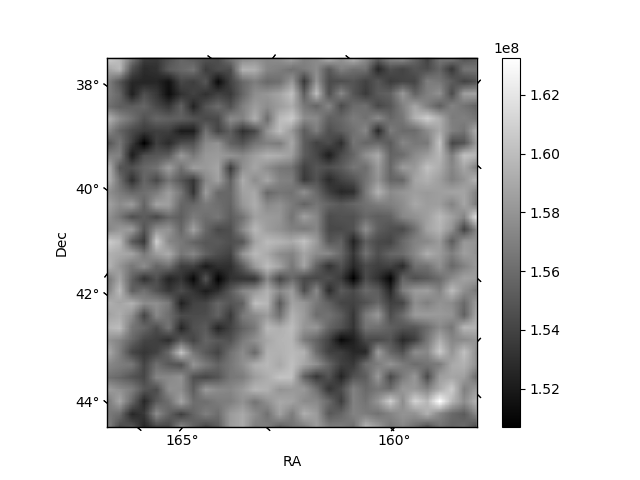
Histogram calculated using DETX and DETY for each event in the final _common_clean file
| Quadrant A | 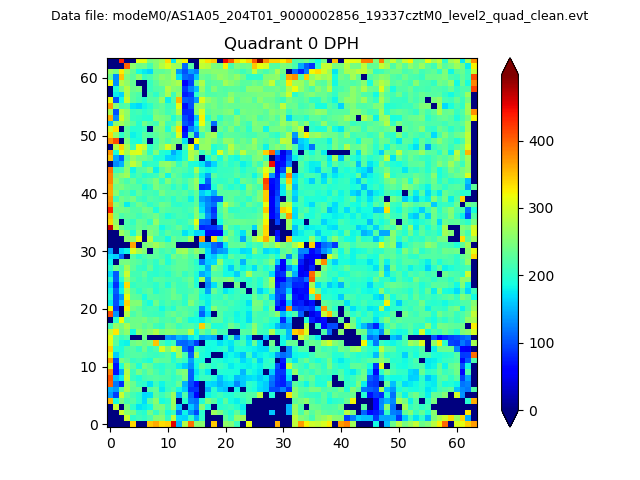 |
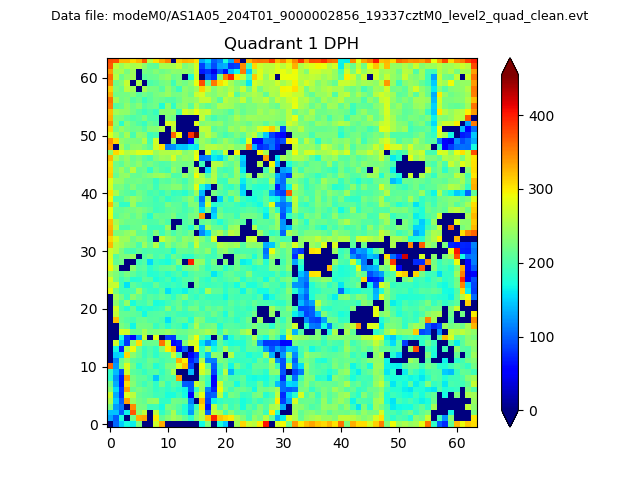 |
Quadrant B |
|---|---|---|---|
| Quadrant D |  |
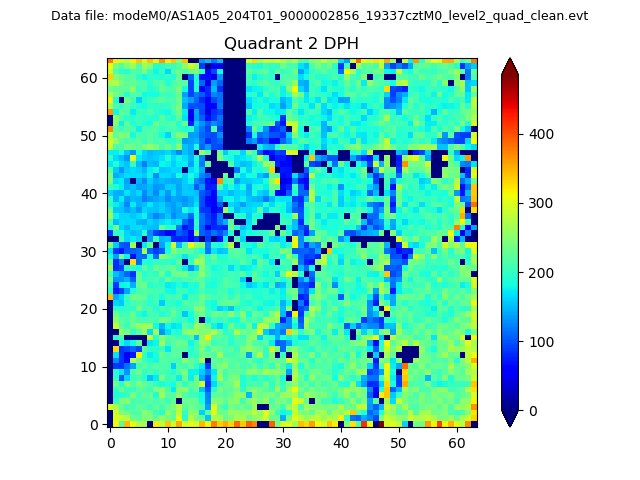 |
Quadrant C |
| Plot type | Count rate plots | Images |
|---|---|---|
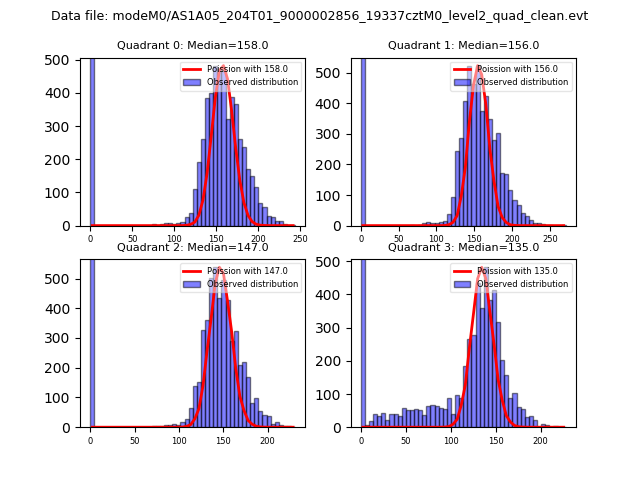
| Comparison with Poisson distribution Blue bars denote a histogram of data divided into 1 sec bins. Red curve is a Poisson curve with rate = median count rate of data. |
 |
 |
| Quadrant-wise count rates Data is divided into 100 sec bins |
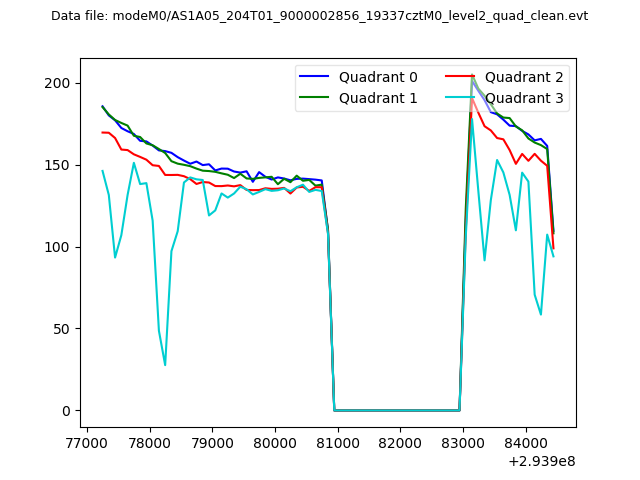 |
|
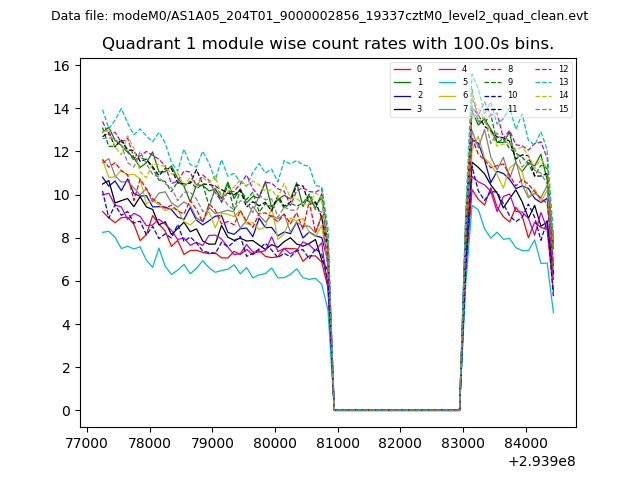
| Module-wise count rates for Quadrant A Data is divided into 100 sec bins |
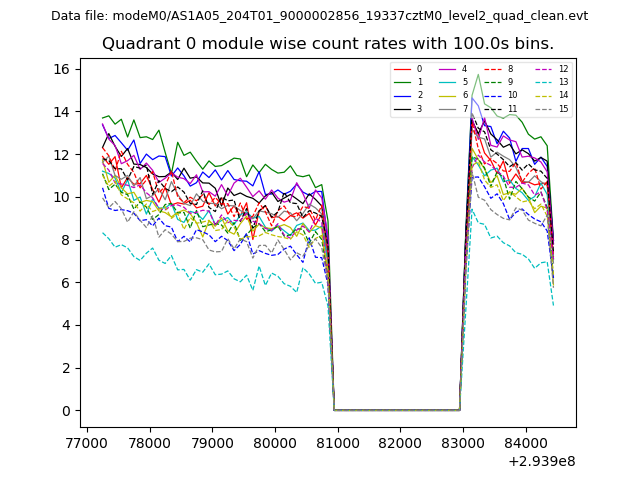 |
 |
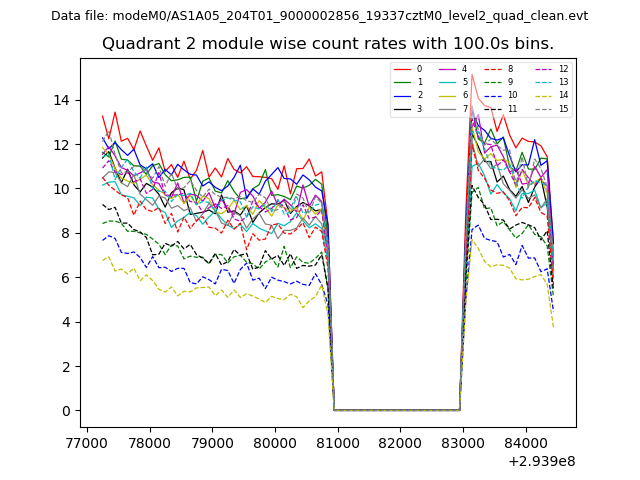
| Module-wise count rates for Quadrant B Data is divided into 100 sec bins |
 |
 |
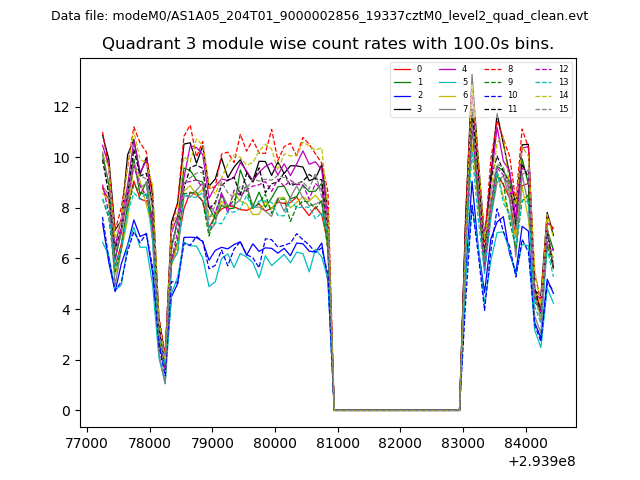
| Module-wise count rates for Quadrant C Data is divided into 100 sec bins |
 |
 |
| Module-wise count rates for Quadrant D Data is divided into 100 sec bins |
 |
 |
| Parameter | Plot |
|---|---|
| CZT HV Monitor | 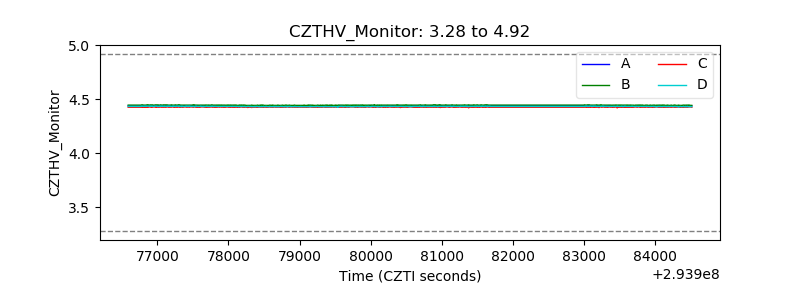 |
| D_VDD | 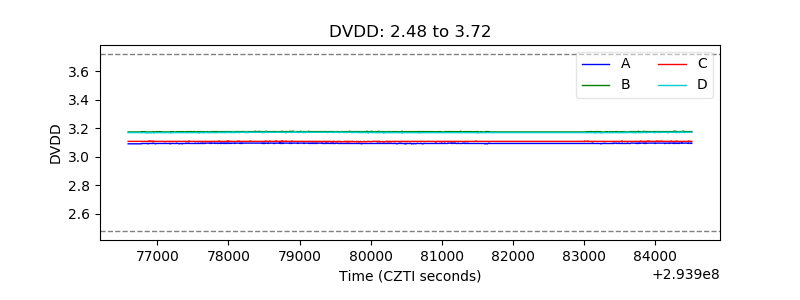 |
| Temperature 1 |  |
| Veto HV Monitor | 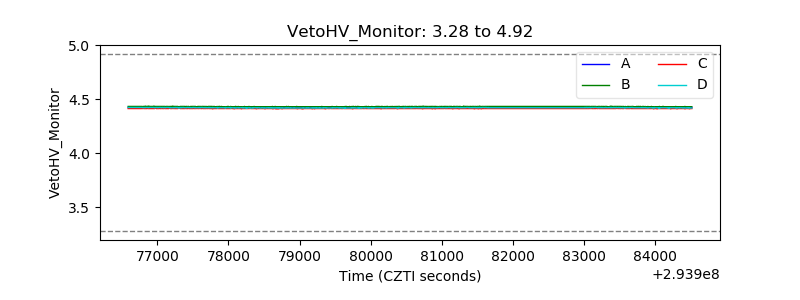 |
| Veto LLD | 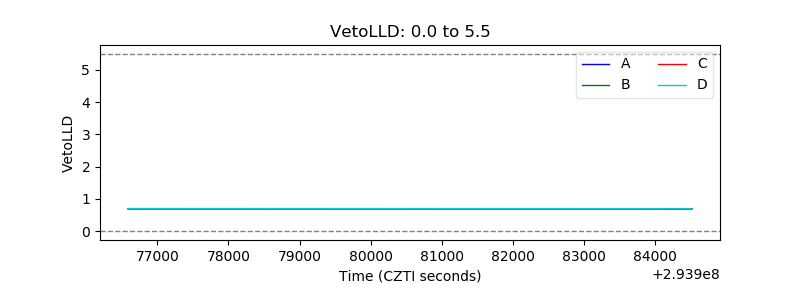 |
| Alpha Counter | 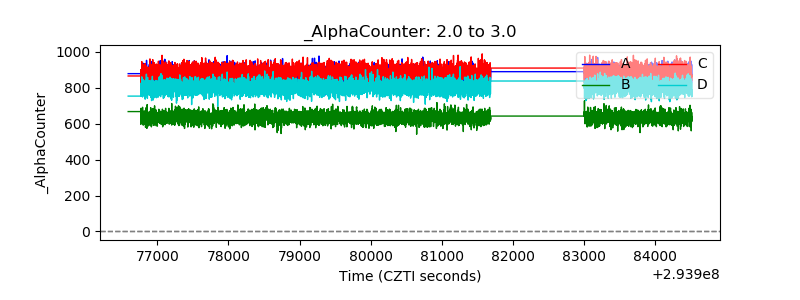 |
| _CPM_Rate | 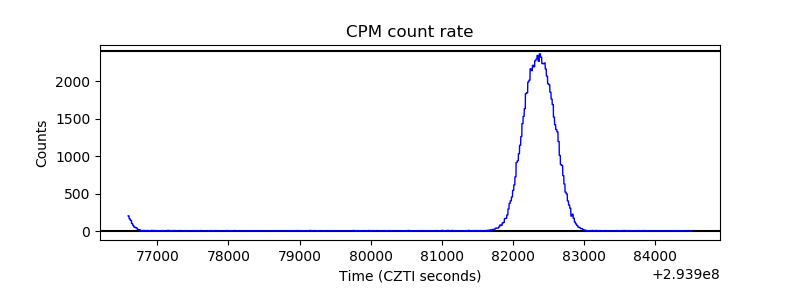 |
| CZT Counter | 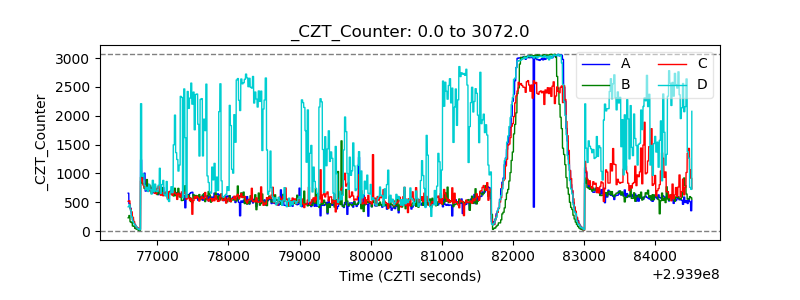 |
| +2.5 Volts monitor |  |
| +5 Volts monitor |  |
| _ROLL_ROT | 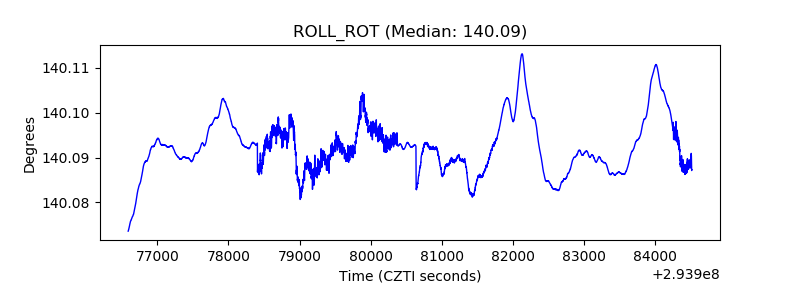 |
| _Roll_DEC | 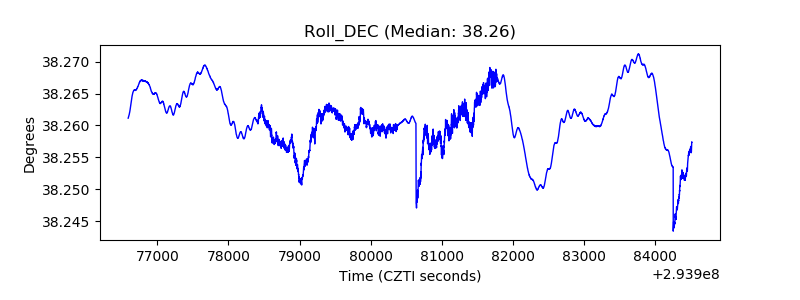 |
| _Roll_RA | 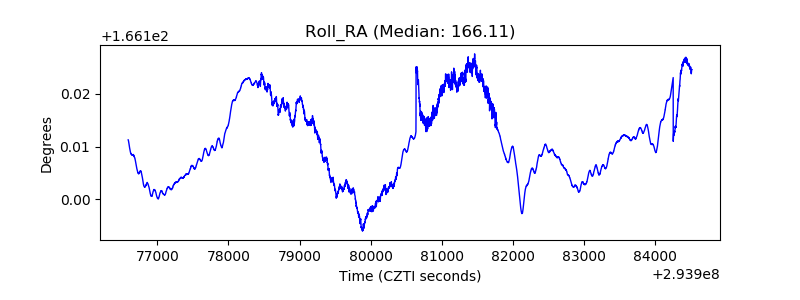 |
| Veto Counter | 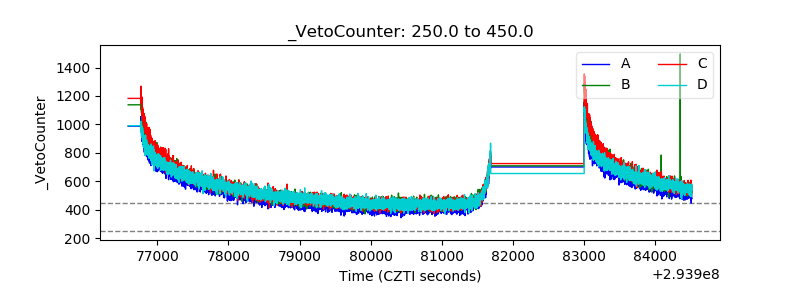 |