| Param | Original file | Final file |
|---|---|---|
| Filename | modeM0/AS1A05_204T01_9000002856_19339cztM0_level2.evt | modeM0/AS1A05_204T01_9000002856_19339cztM0_level2_quad_clean.evt |
| Size (bytes) | 562,049,280 | 96,310,080 |
| Size | 536.0 MB | 91.8 MB |
| Events in quadrant A | 3,033,142 | 656,308 |
| Events in quadrant B | 3,197,316 | 654,730 |
| Events in quadrant C | 3,566,179 | 626,831 |
| Events in quadrant D | 6,815,897 | 556,655 |
| Mode M0 | |||
|---|---|---|---|
| Quadrant | BADHDUFLAG | Total packets | Discarded packets |
| A | 0 | 12765 | 1 |
| B | 0 | 13239 | 1 |
| C | 0 | 14543 | 1 |
| D | 0 | 24456 | 1 |
| Mode M9 | |||
|---|---|---|---|
| Quadrant | BADHDUFLAG | Total packets | Discarded packets |
| A | 0 | 13 | 0 |
| B | 0 | 13 | 0 |
| C | 0 | 13 | 0 |
| D | 0 | 13 | 0 |
| Mode SS | |||
|---|---|---|---|
| Quadrant | BADHDUFLAG | Total packets | Discarded packets |
| A | 0 | 122 | 0 |
| B | 0 | 122 | 0 |
| C | 0 | 122 | 0 |
| D | 0 | 122 | 0 |
| Quadrant | Total seconds | Saturated seconds | Saturation percentage |
|---|---|---|---|
| A | 6040 | 97 | 1.605960% |
| B | 6041 | 131 | 2.168515% |
| C | 6041 | 177 | 2.929978% |
| D | 6041 | 1117 | 18.490316% |
Noise dominated data is calculated using 1-second bins in cleaned event files. If a bin has >2000 counts, and if more than 50% of those come from <1% of pixels, then it is considered to be noise-dominated and hence unusable.
| Quadrant | # 1 sec bins | Bins with >0 counts | Bins with >2000 counts | High rate bins dominated by noise | Noise dominated (total time) | Noise dominated (detector-on time) | Marked lightcurve |
|---|---|---|---|---|---|---|---|
| A | 7295 | 6041 | 0 | 0 | 0.00% | 0.00% | 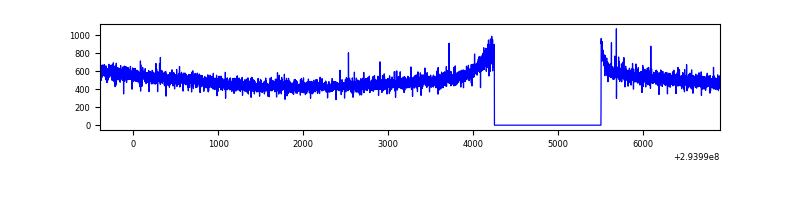 |
| B | 7296 | 6042 | 19 | 19 | 0.26% | 0.31% | 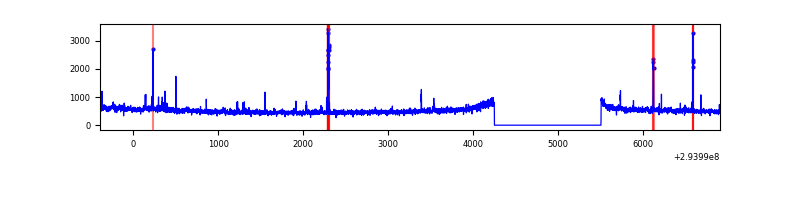 |
| C | 7296 | 6041 | 1 | 1 | 0.01% | 0.02% | 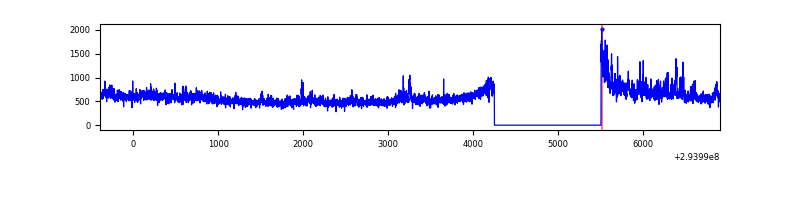 |
| D | 7296 | 6041 | 998 | 998 | 13.68% | 16.52% | 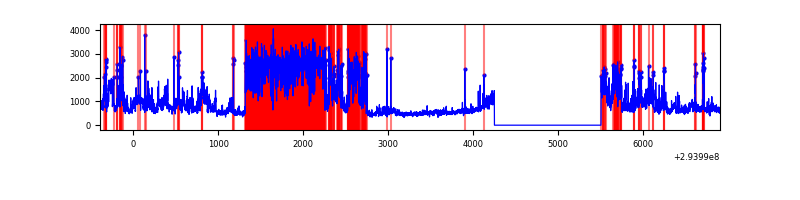 |
Top three noisy pixels from each quadrant. If the there are fewer than three noisy pixels in the level2.evt file, extra rows are filled as -1
| Pixel properties | Quadrant properties | ||||||
|---|---|---|---|---|---|---|---|
| Quadrant | DetID | PixID | Counts | Sigma | Mean | Median | Sigma |
| A | 0 | 226 | 6894 | 38.94 | 786 | 771 | 157.2 |
| A | 12 | 194 | 5885 | 32.53 | 786 | 771 | 157.2 |
| A | 3 | 137 | 5795 | 31.95 | 786 | 771 | 157.2 |
| B | 3 | 64 | 54244 | 369.92 | 775 | 758 | 144.6 |
| B | 0 | 190 | 30781 | 207.65 | 775 | 758 | 144.6 |
| B | 0 | 229 | 26273 | 176.47 | 775 | 758 | 144.6 |
| C | 3 | 233 | 504139 | 2870.02 | 754 | 760 | 175.4 |
| C | 14 | 238 | 117390 | 664.97 | 754 | 760 | 175.4 |
| C | 13 | 61 | 5327 | 26.04 | 754 | 760 | 175.4 |
| D | 7 | 238 | 2705642 | 15487.08 | 729 | 709 | 174.7 |
| D | 10 | 66 | 975622 | 5581.86 | 729 | 709 | 174.7 |
| D | 1 | 52 | 222020 | 1267.11 | 729 | 709 | 174.7 |
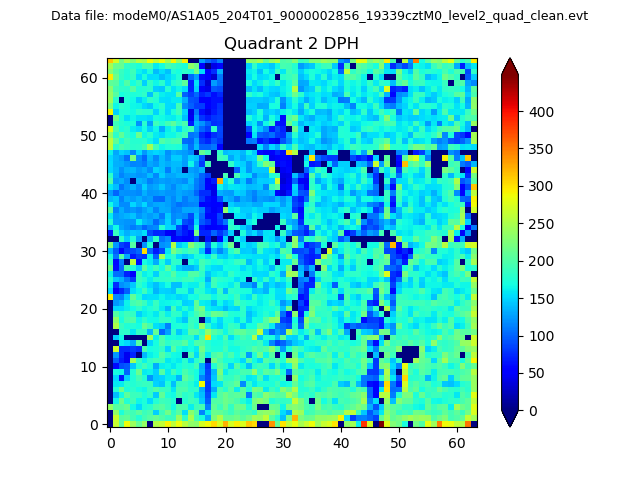
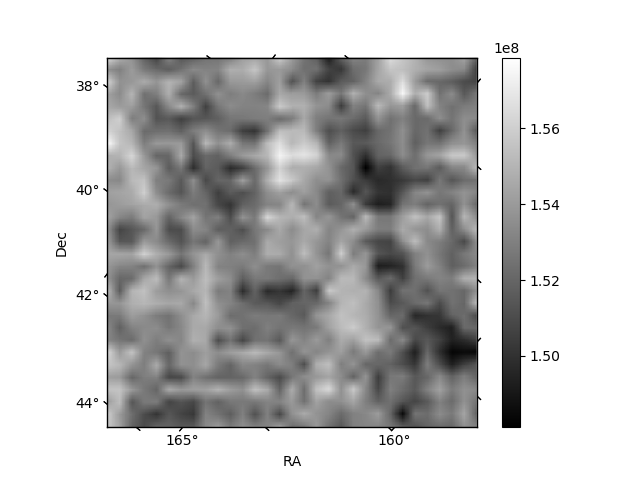
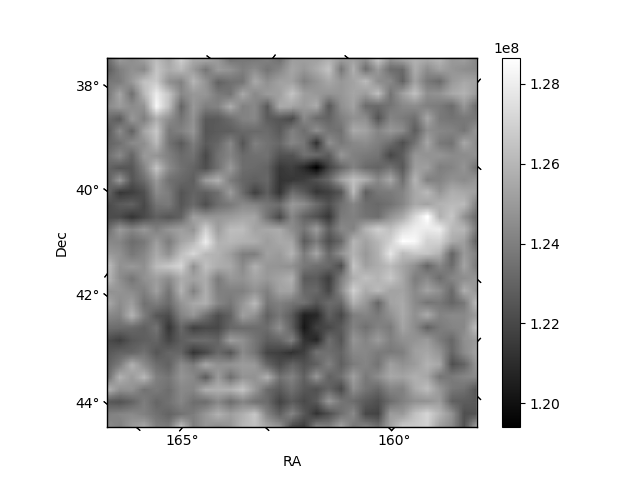
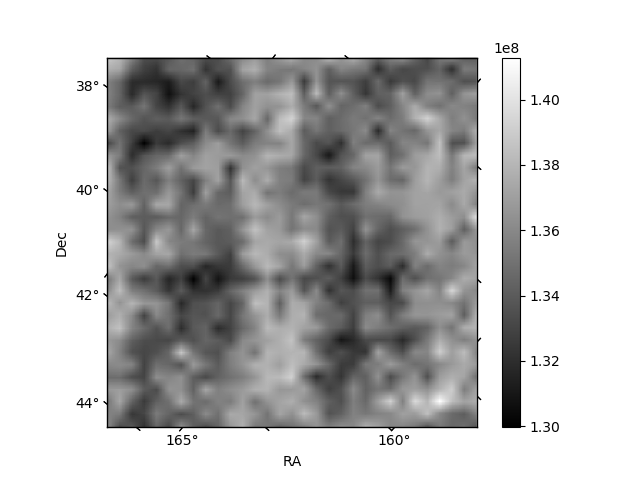
Histogram calculated using DETX and DETY for each event in the final _common_clean file
| Quadrant A | 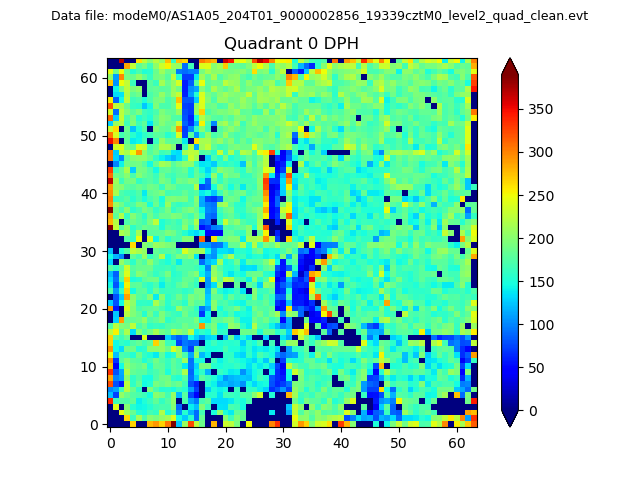 |
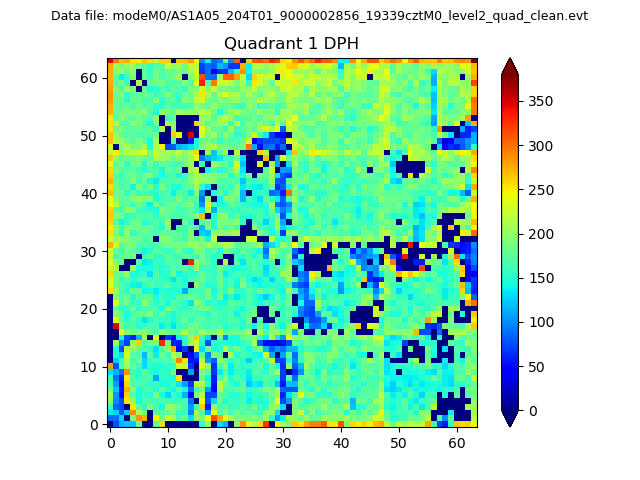 |
Quadrant B |
|---|---|---|---|
| Quadrant D | 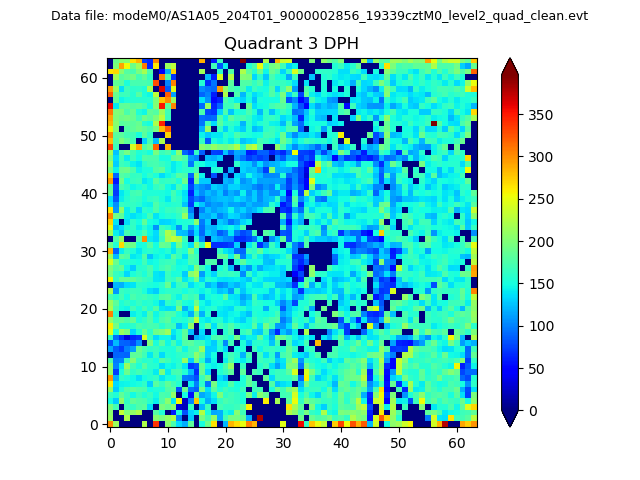 |
 |
Quadrant C |
| Plot type | Count rate plots | Images |
|---|---|---|
| Comparison with Poisson distribution Blue bars denote a histogram of data divided into 1 sec bins. Red curve is a Poisson curve with rate = median count rate of data. |
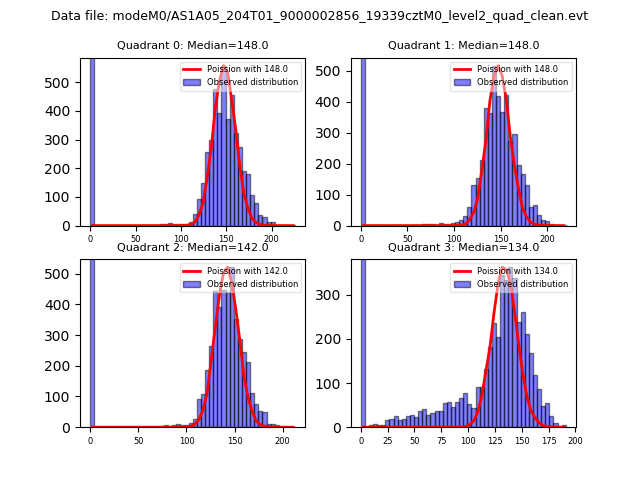 |
 |
| Quadrant-wise count rates Data is divided into 100 sec bins |
 |
|
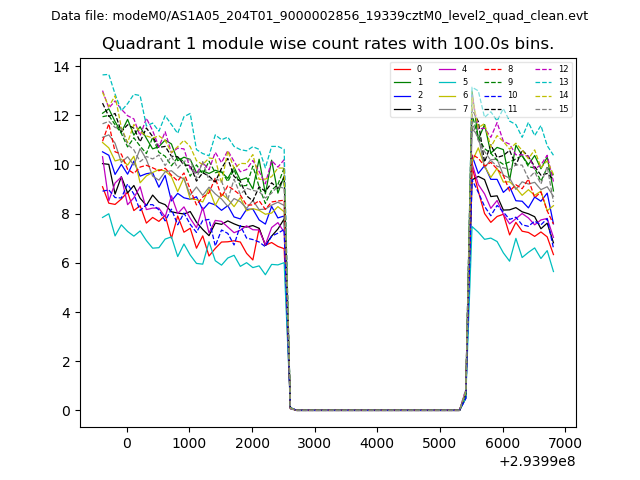
| Module-wise count rates for Quadrant A Data is divided into 100 sec bins |
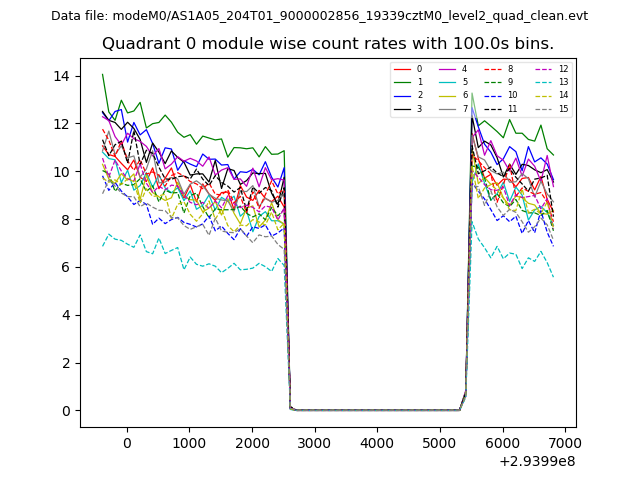 |
 |
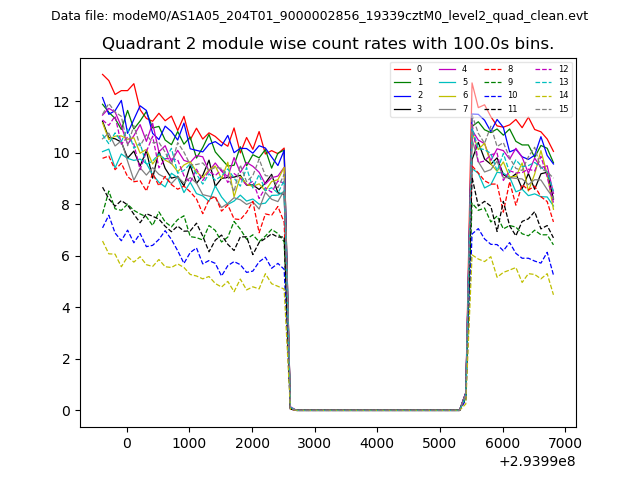
| Module-wise count rates for Quadrant B Data is divided into 100 sec bins |
 |
 |
| Module-wise count rates for Quadrant C Data is divided into 100 sec bins |
 |
 |
| Module-wise count rates for Quadrant D Data is divided into 100 sec bins |
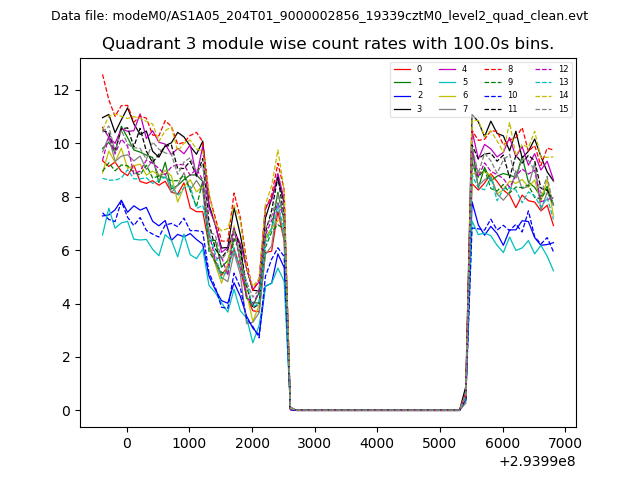 |
 |
| Parameter | Plot |
|---|---|
| CZT HV Monitor | 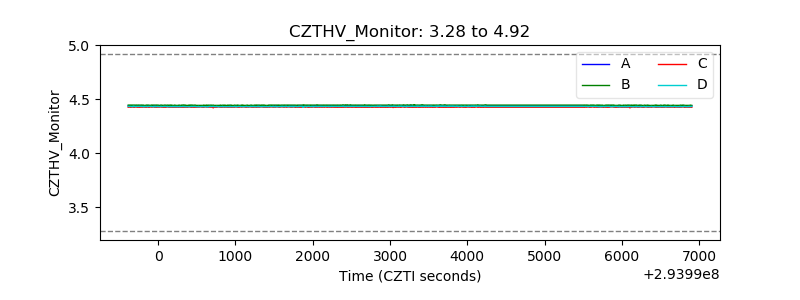 |
| D_VDD | 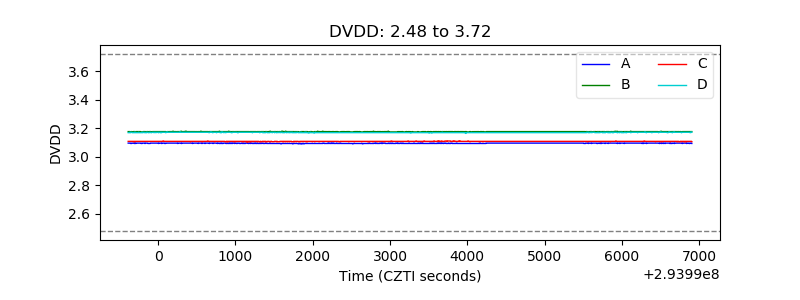 |
| Temperature 1 | 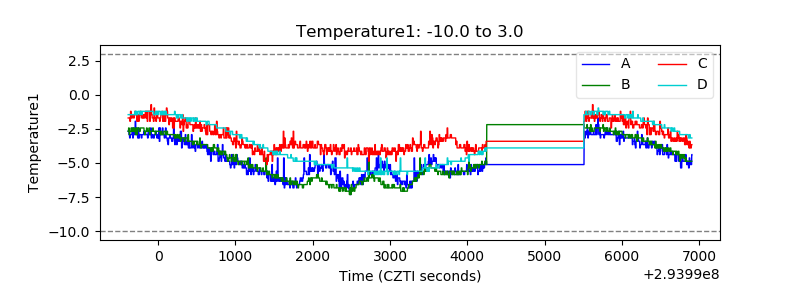 |
| Veto HV Monitor | 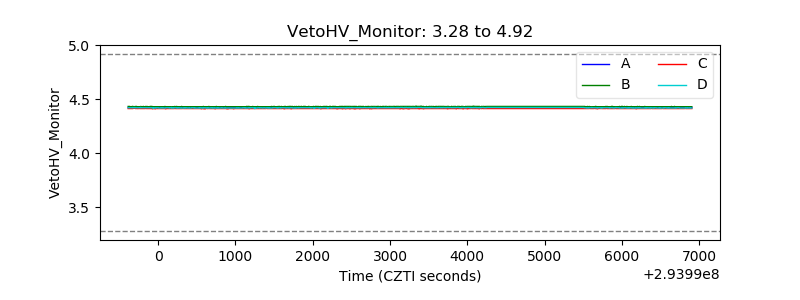 |
| Veto LLD | 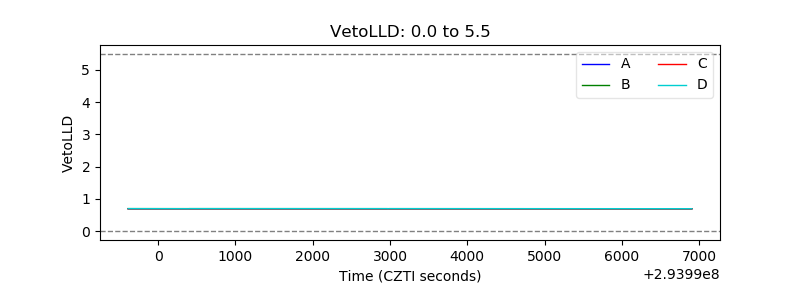 |
| Alpha Counter |  |
| _CPM_Rate | 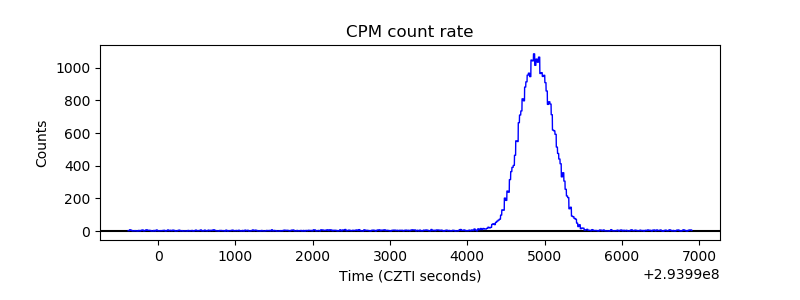 |
| CZT Counter | 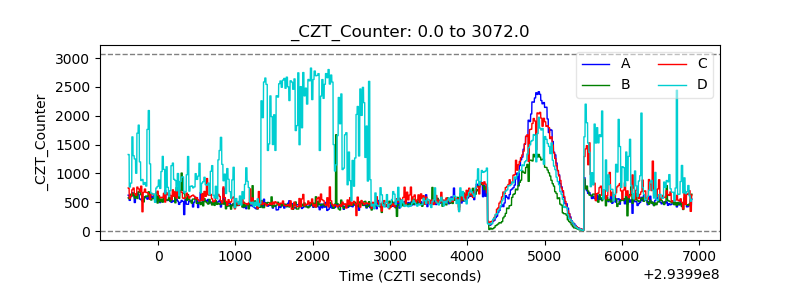 |
| +2.5 Volts monitor |  |
| +5 Volts monitor |  |
| _ROLL_ROT | 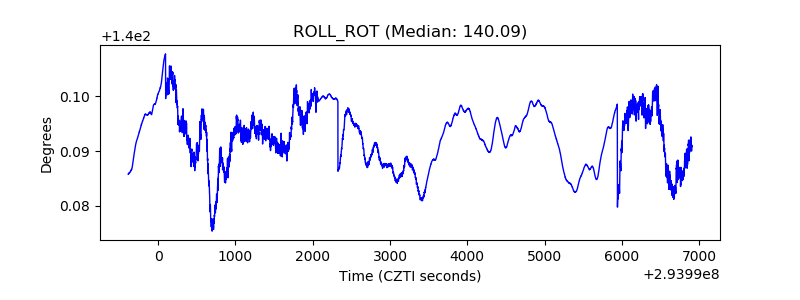 |
| _Roll_DEC | 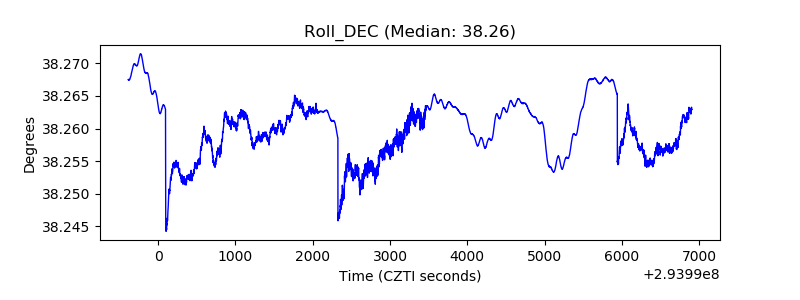 |
| _Roll_RA | 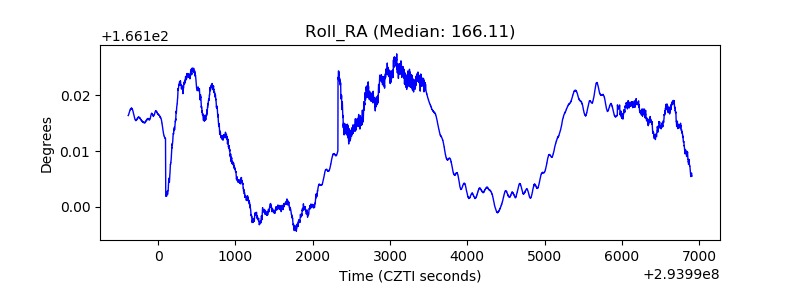 |
| Veto Counter | 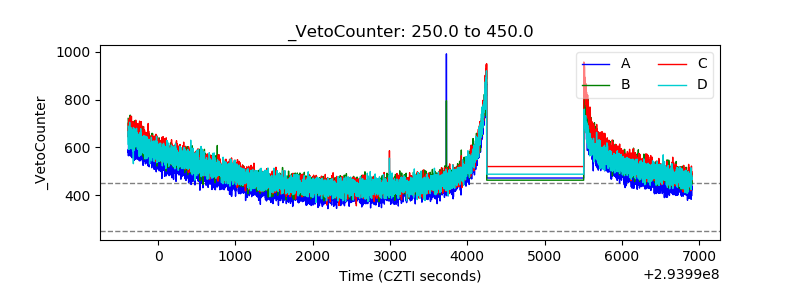 |