| Param | Original file | Final file |
|---|---|---|
| Filename | modeM0/AS1A05_204T01_9000002856_19341cztM0_level2.evt | modeM0/AS1A05_204T01_9000002856_19341cztM0_level2_quad_clean.evt |
| Size (bytes) | 625,757,760 | 93,916,800 |
| Size | 596.8 MB | 89.6 MB |
| Events in quadrant A | 3,324,580 | 638,058 |
| Events in quadrant B | 3,457,206 | 642,333 |
| Events in quadrant C | 3,636,653 | 615,909 |
| Events in quadrant D | 8,057,957 | 459,108 |
| Mode M0 | |||
|---|---|---|---|
| Quadrant | BADHDUFLAG | Total packets | Discarded packets |
| A | 0 | 14513 | 1 |
| B | 0 | 14772 | 1 |
| C | 0 | 15246 | 1 |
| D | 0 | 28524 | 2 |
| Mode M9 | |||
|---|---|---|---|
| Quadrant | BADHDUFLAG | Total packets | Discarded packets |
| A | 0 | 6 | 0 |
| B | 0 | 6 | 0 |
| C | 0 | 6 | 0 |
| D | 0 | 6 | 0 |
| Mode SS | |||
|---|---|---|---|
| Quadrant | BADHDUFLAG | Total packets | Discarded packets |
| A | 0 | 142 | 0 |
| B | 0 | 142 | 0 |
| C | 0 | 142 | 0 |
| D | 0 | 142 | 0 |
| Quadrant | Total seconds | Saturated seconds | Saturation percentage |
|---|---|---|---|
| A | 7004 | 66 | 0.942319% |
| B | 7004 | 84 | 1.199315% |
| C | 7005 | 109 | 1.556031% |
| D | 7004 | 1763 | 25.171331% |
Noise dominated data is calculated using 1-second bins in cleaned event files. If a bin has >2000 counts, and if more than 50% of those come from <1% of pixels, then it is considered to be noise-dominated and hence unusable.
| Quadrant | # 1 sec bins | Bins with >0 counts | Bins with >2000 counts | High rate bins dominated by noise | Noise dominated (total time) | Noise dominated (detector-on time) | Marked lightcurve |
|---|---|---|---|---|---|---|---|
| A | 7569 | 7005 | 0 | 0 | 0.00% | 0.00% | 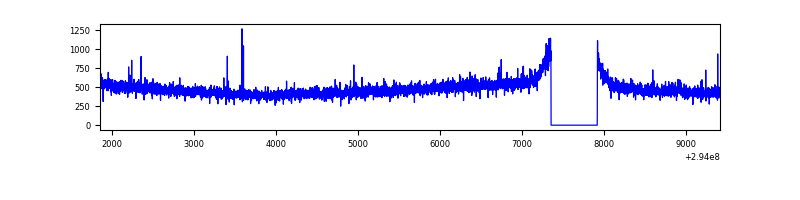 |
| B | 7569 | 7004 | 12 | 12 | 0.16% | 0.17% | 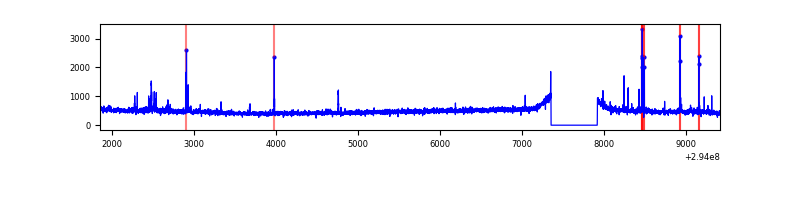 |
| C | 7570 | 7006 | 3 | 3 | 0.04% | 0.04% | 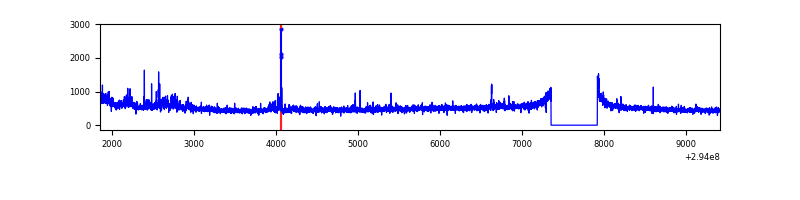 |
| D | 7569 | 7004 | 1691 | 1691 | 22.34% | 24.14% | 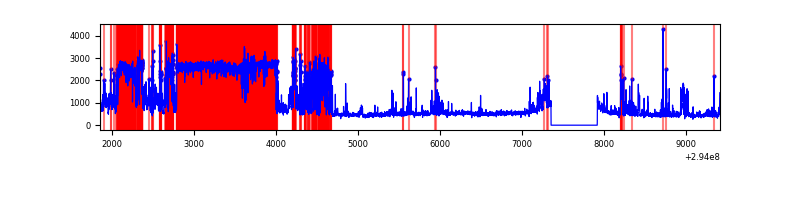 |
Top three noisy pixels from each quadrant. If the there are fewer than three noisy pixels in the level2.evt file, extra rows are filled as -1
| Pixel properties | Quadrant properties | ||||||
|---|---|---|---|---|---|---|---|
| Quadrant | DetID | PixID | Counts | Sigma | Mean | Median | Sigma |
| A | 11 | 29 | 15246 | 83.65 | 853 | 834 | 172.3 |
| A | 5 | 16 | 7851 | 40.73 | 853 | 834 | 172.3 |
| A | 0 | 226 | 7507 | 38.73 | 853 | 834 | 172.3 |
| B | 7 | 220 | 28428 | 171.19 | 847 | 824 | 161.3 |
| B | 15 | 32 | 24813 | 148.77 | 847 | 824 | 161.3 |
| B | 0 | 229 | 24188 | 144.89 | 847 | 824 | 161.3 |
| C | 3 | 233 | 316334 | 1637.36 | 819 | 825 | 192.7 |
| C | 14 | 238 | 125924 | 649.21 | 819 | 825 | 192.7 |
| C | 13 | 61 | 5882 | 26.24 | 819 | 825 | 192.7 |
| D | 7 | 238 | 4053767 | 23069.85 | 713 | 691 | 175.7 |
| D | 1 | 52 | 740205 | 4209.27 | 713 | 691 | 175.7 |
| D | 10 | 66 | 423242 | 2405.13 | 713 | 691 | 175.7 |
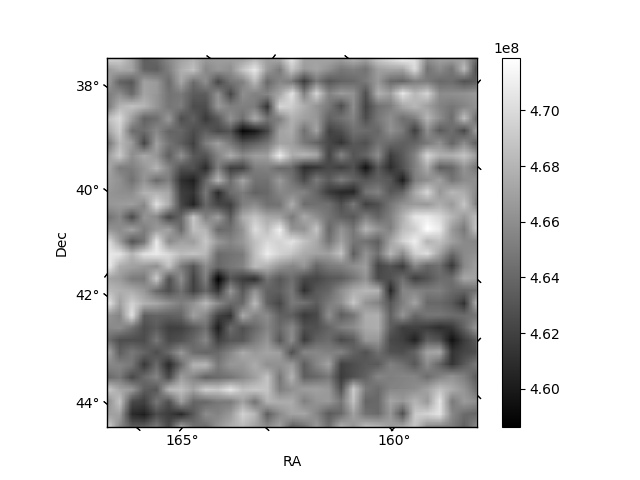
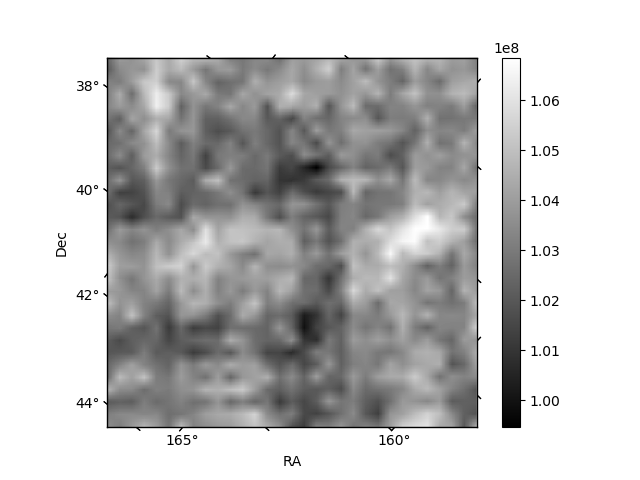
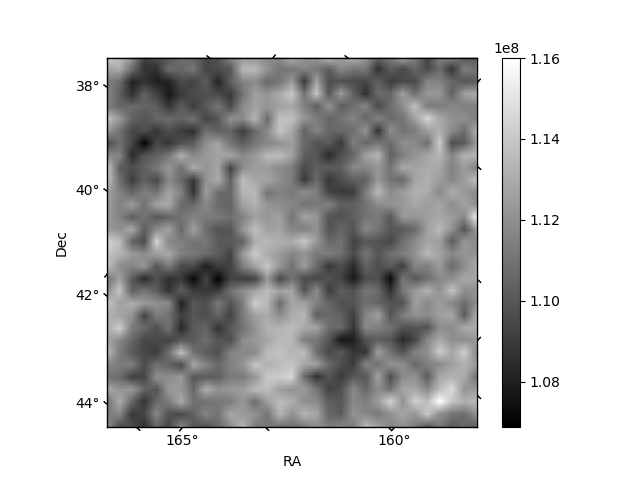
Histogram calculated using DETX and DETY for each event in the final _common_clean file
| Quadrant A | 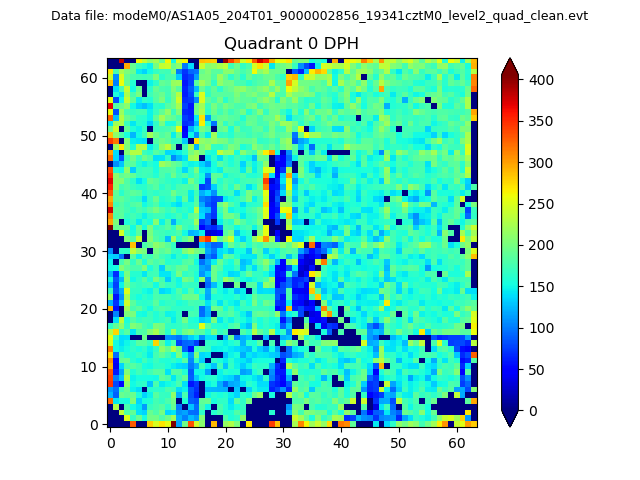 |
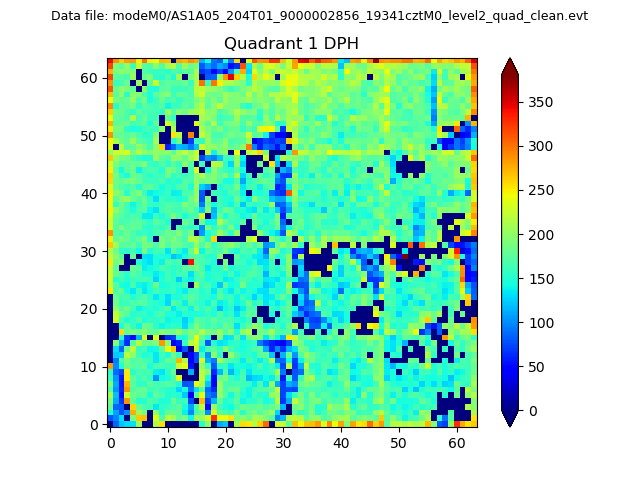 |
Quadrant B |
|---|---|---|---|
| Quadrant D | 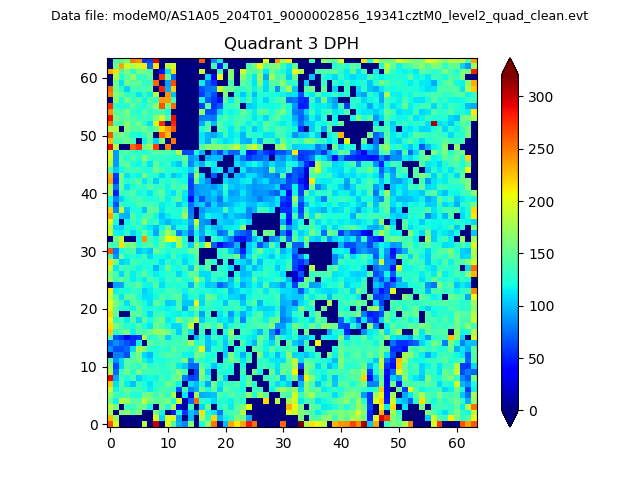 |
 |
Quadrant C |
| Plot type | Count rate plots | Images |
|---|---|---|
| Comparison with Poisson distribution Blue bars denote a histogram of data divided into 1 sec bins. Red curve is a Poisson curve with rate = median count rate of data. |
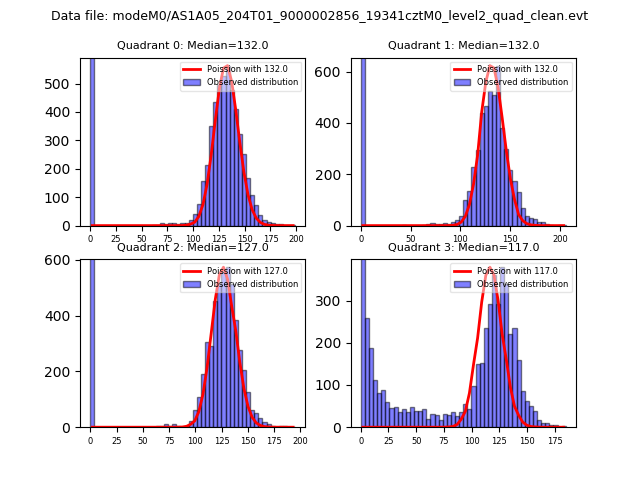 |
 |
| Quadrant-wise count rates Data is divided into 100 sec bins |
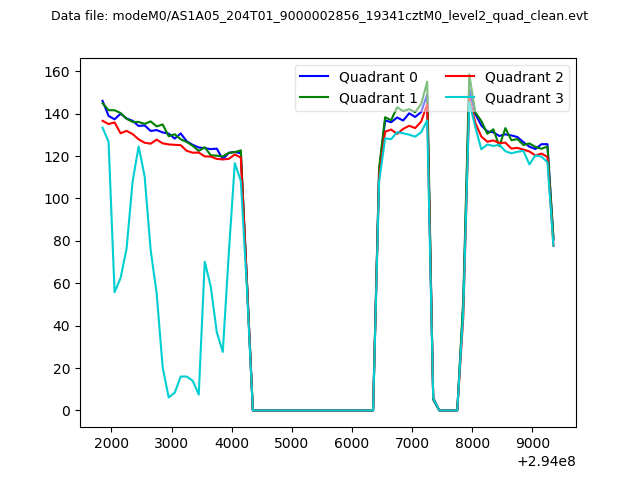 |
|
| Module-wise count rates for Quadrant A Data is divided into 100 sec bins |
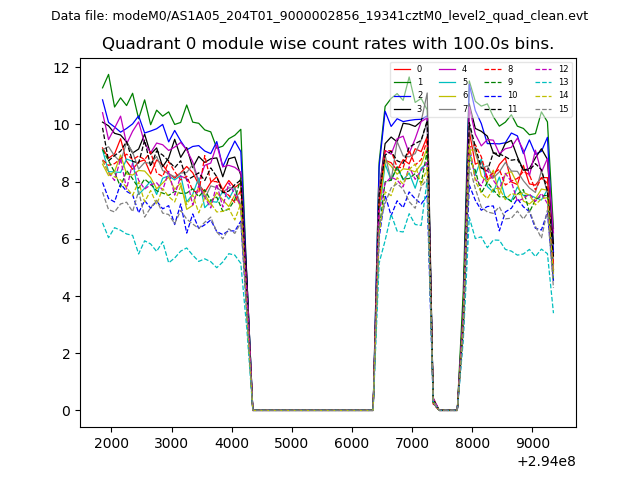 |
 |
| Module-wise count rates for Quadrant B Data is divided into 100 sec bins |
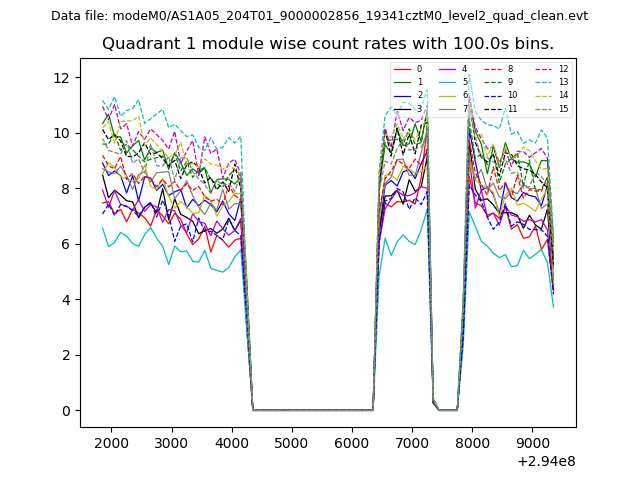 |
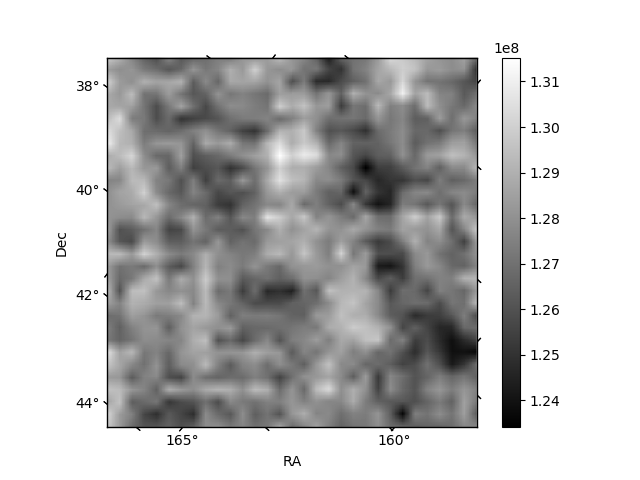 |
| Module-wise count rates for Quadrant C Data is divided into 100 sec bins |
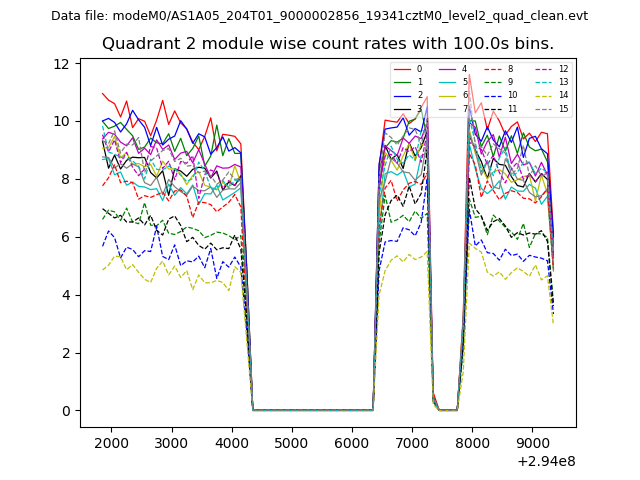 |
 |
| Module-wise count rates for Quadrant D Data is divided into 100 sec bins |
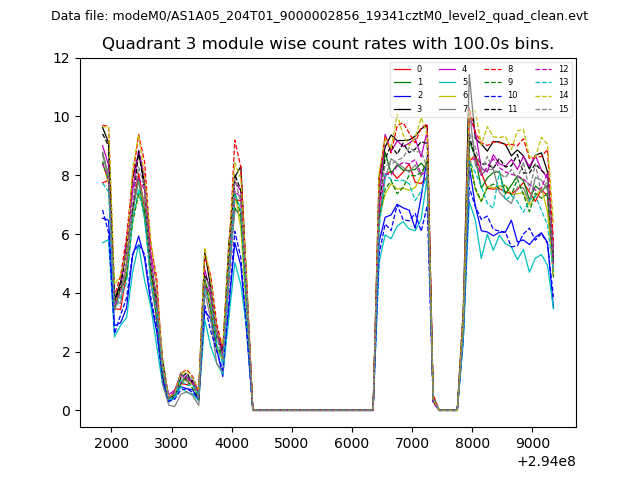 |
 |
| Parameter | Plot |
|---|---|
| CZT HV Monitor | 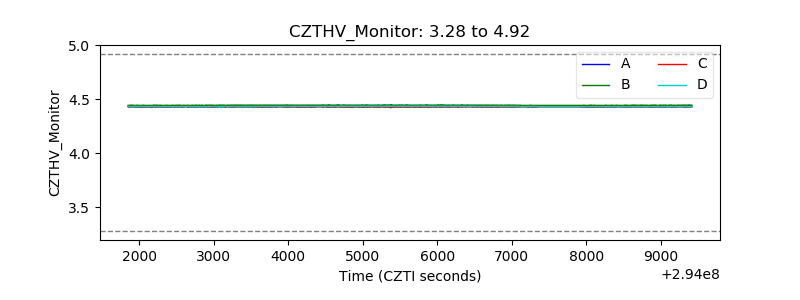 |
| D_VDD | 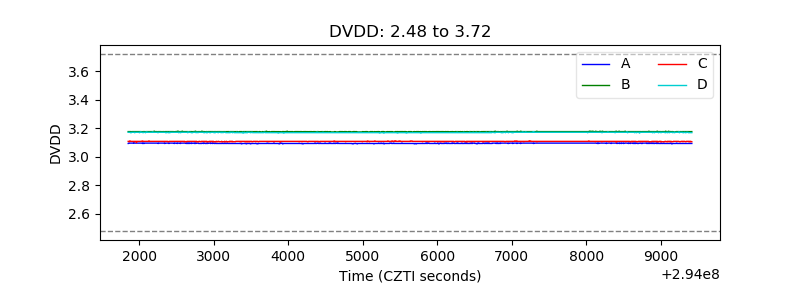 |
| Temperature 1 | 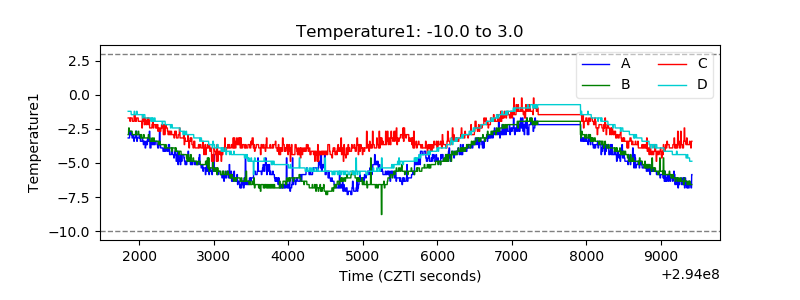 |
| Veto HV Monitor | 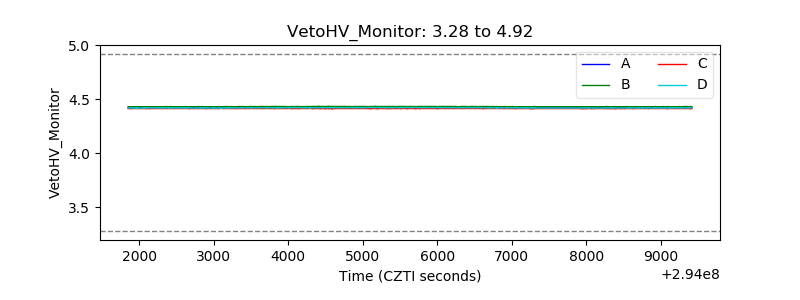 |
| Veto LLD | 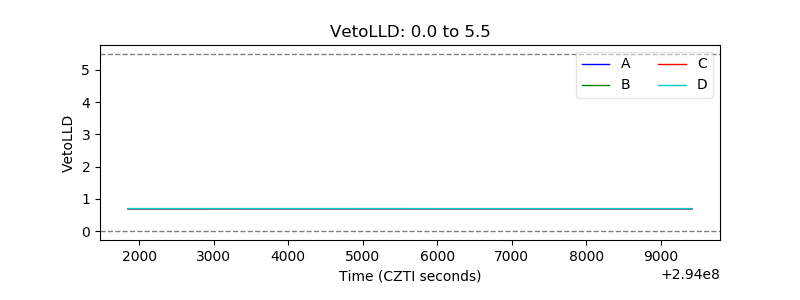 |
| Alpha Counter | 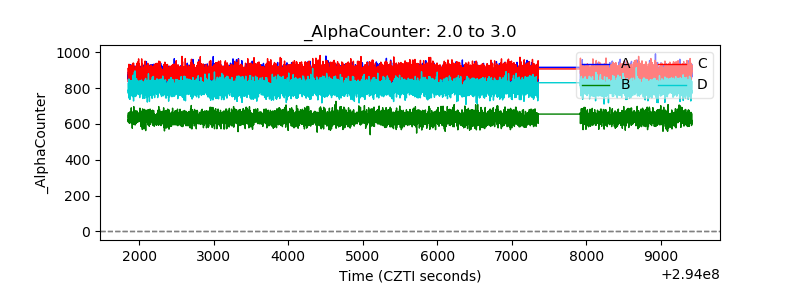 |
| _CPM_Rate | 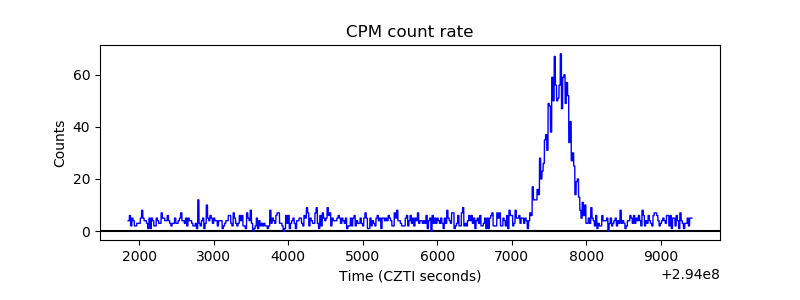 |
| CZT Counter |  |
| +2.5 Volts monitor | 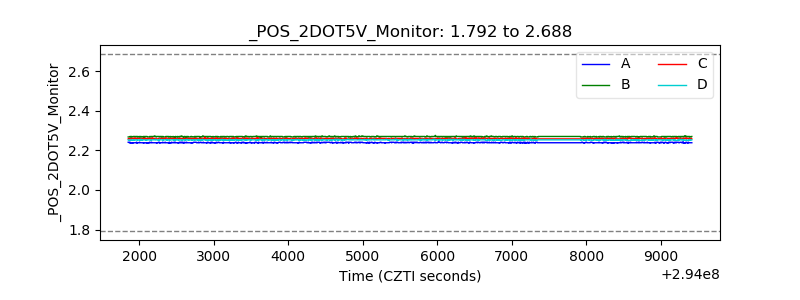 |
| +5 Volts monitor | 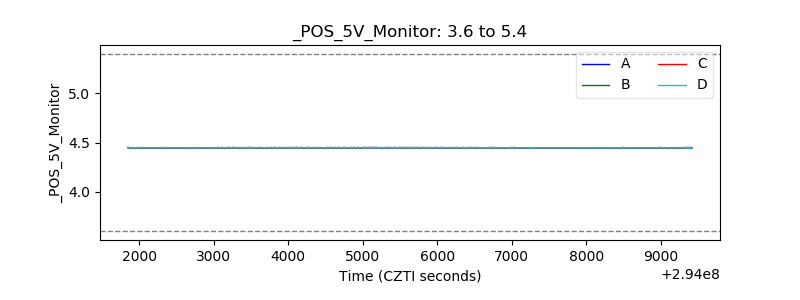 |
| _ROLL_ROT | 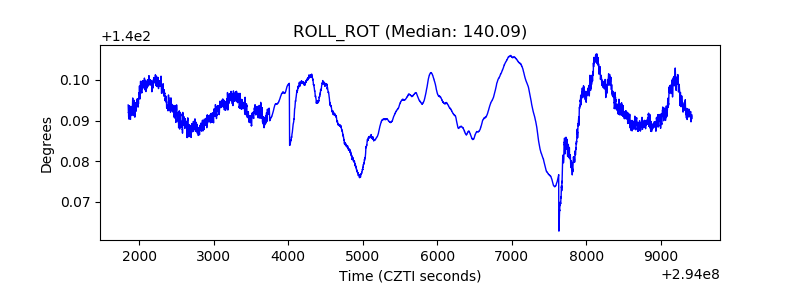 |
| _Roll_DEC | 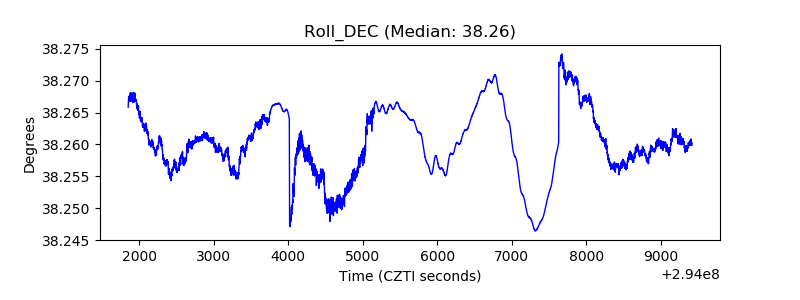 |
| _Roll_RA | 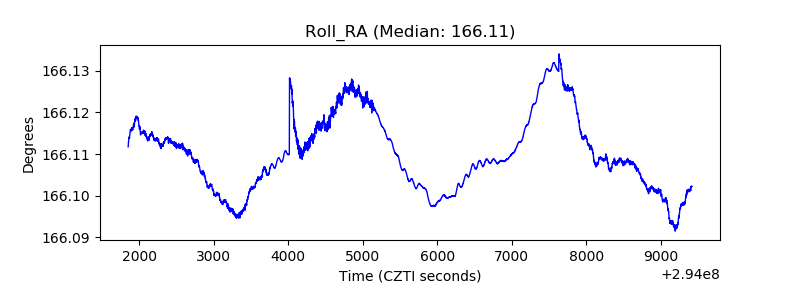 |
| Veto Counter | 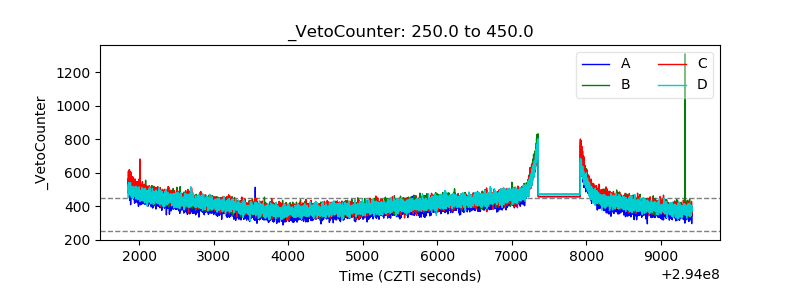 |