| Param | Original file | Final file |
|---|---|---|
| Filename | modeM0/AS1A05_204T01_9000002856_19343cztM0_level2.evt | modeM0/AS1A05_204T01_9000002856_19343cztM0_level2_quad_clean.evt |
| Size (bytes) | 610,724,160 | 104,302,080 |
| Size | 582.4 MB | 99.5 MB |
| Events in quadrant A | 3,587,012 | 678,744 |
| Events in quadrant B | 3,781,592 | 681,360 |
| Events in quadrant C | 3,688,417 | 654,703 |
| Events in quadrant D | 6,916,534 | 607,777 |
| Mode M0 | |||
|---|---|---|---|
| Quadrant | BADHDUFLAG | Total packets | Discarded packets |
| A | 0 | 15928 | 2 |
| B | 0 | 16338 | 2 |
| C | 0 | 15999 | 2 |
| D | 0 | 25826 | 2 |
| Mode M9 | |||
|---|---|---|---|
| Quadrant | BADHDUFLAG | Total packets | Discarded packets |
| A | 0 | 3 | 0 |
| B | 0 | 3 | 0 |
| C | 0 | 3 | 0 |
| D | 0 | 3 | 0 |
| Mode SS | |||
|---|---|---|---|
| Quadrant | BADHDUFLAG | Total packets | Discarded packets |
| A | 0 | 156 | 0 |
| B | 0 | 156 | 0 |
| C | 0 | 156 | 0 |
| D | 0 | 156 | 0 |
| Quadrant | Total seconds | Saturated seconds | Saturation percentage |
|---|---|---|---|
| A | 7704 | 51 | 0.661994% |
| B | 7705 | 114 | 1.479559% |
| C | 7705 | 120 | 1.557430% |
| D | 7705 | 827 | 10.733290% |
Noise dominated data is calculated using 1-second bins in cleaned event files. If a bin has >2000 counts, and if more than 50% of those come from <1% of pixels, then it is considered to be noise-dominated and hence unusable.
| Quadrant | # 1 sec bins | Bins with >0 counts | Bins with >2000 counts | High rate bins dominated by noise | Noise dominated (total time) | Noise dominated (detector-on time) | Marked lightcurve |
|---|---|---|---|---|---|---|---|
| A | 7949 | 7706 | 2 | 2 | 0.03% | 0.03% | 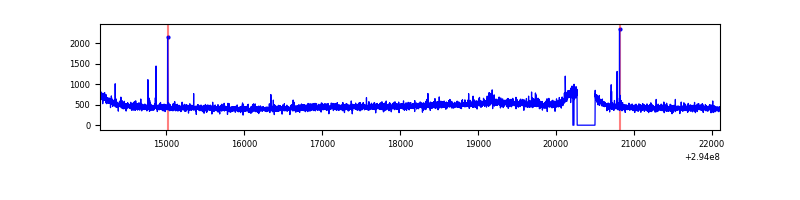 |
| B | 7950 | 7707 | 20 | 20 | 0.25% | 0.26% | 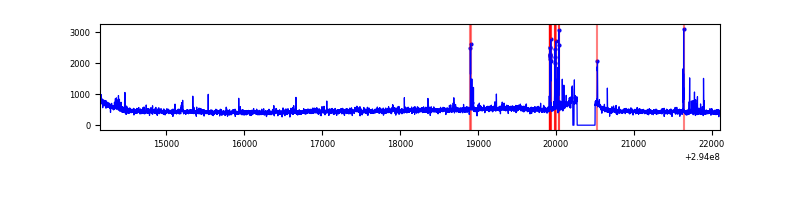 |
| C | 7950 | 7707 | 0 | 0 | 0.00% | 0.00% | 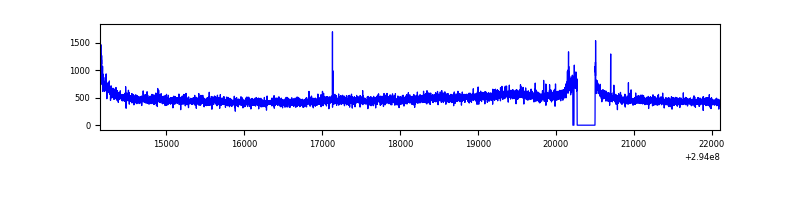 |
| D | 7950 | 7707 | 732 | 732 | 9.21% | 9.50% | 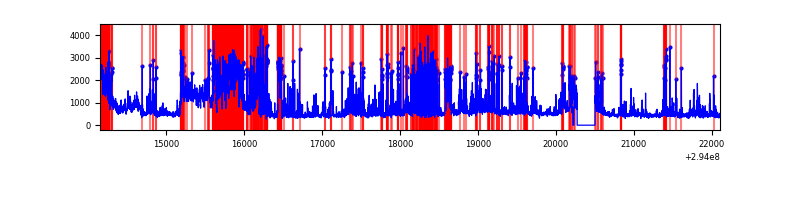 |
Top three noisy pixels from each quadrant. If the there are fewer than three noisy pixels in the level2.evt file, extra rows are filled as -1
| Pixel properties | Quadrant properties | ||||||
|---|---|---|---|---|---|---|---|
| Quadrant | DetID | PixID | Counts | Sigma | Mean | Median | Sigma |
| A | 4 | 2 | 27697 | 143.46 | 914 | 892 | 186.8 |
| A | 11 | 29 | 23548 | 121.26 | 914 | 892 | 186.8 |
| A | 5 | 16 | 8207 | 39.15 | 914 | 892 | 186.8 |
| B | 7 | 220 | 73852 | 419.3 | 910 | 885 | 174.0 |
| B | 0 | 230 | 28923 | 161.12 | 910 | 885 | 174.0 |
| B | 3 | 64 | 25894 | 143.71 | 910 | 885 | 174.0 |
| C | 14 | 238 | 136427 | 652.8 | 883 | 888 | 207.6 |
| C | 3 | 233 | 88729 | 423.07 | 883 | 888 | 207.6 |
| C | 8 | 128 | 13100 | 58.82 | 883 | 888 | 207.6 |
| D | 11 | 176 | 1313046 | 6292.82 | 858 | 833 | 208.5 |
| D | 10 | 66 | 899041 | 4307.42 | 858 | 833 | 208.5 |
| D | 1 | 52 | 751928 | 3601.93 | 858 | 833 | 208.5 |
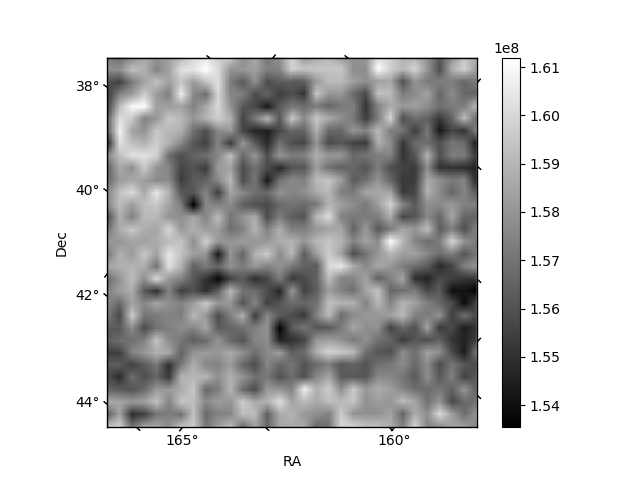
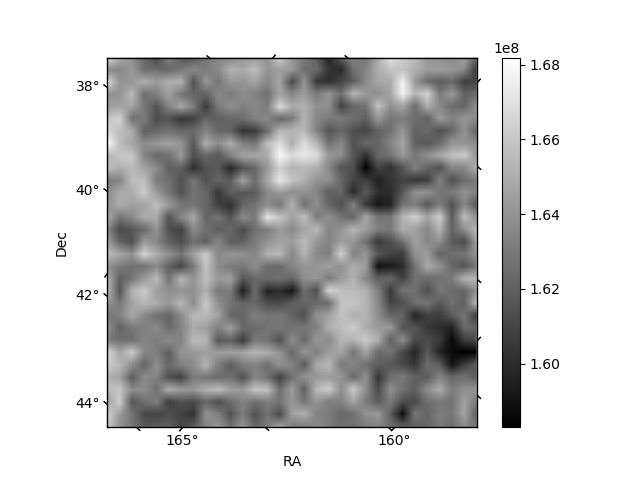
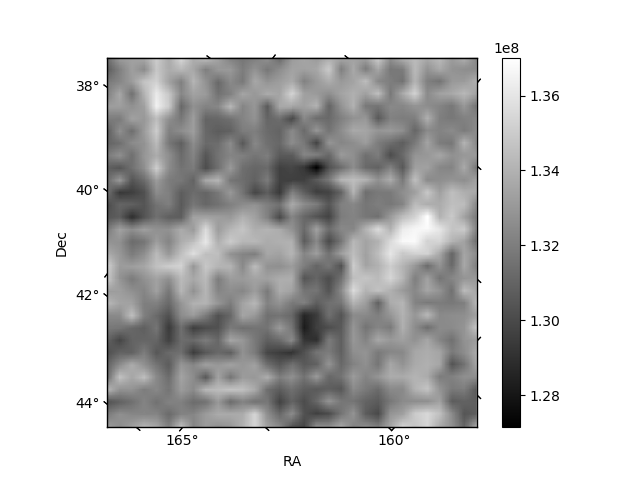
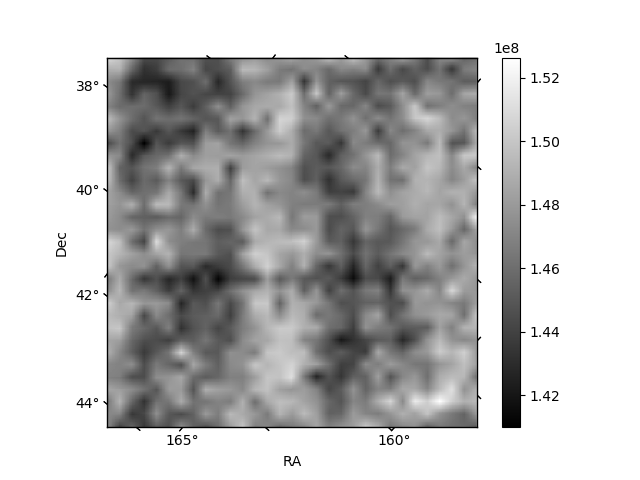
Histogram calculated using DETX and DETY for each event in the final _common_clean file
| Quadrant A |  |
 |
Quadrant B |
|---|---|---|---|
| Quadrant D |  |
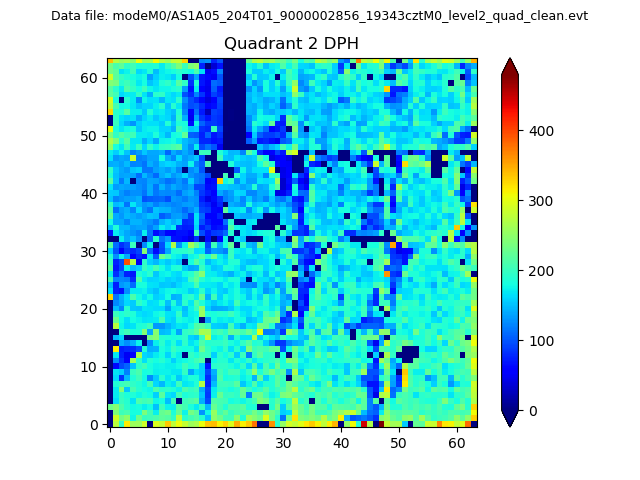 |
Quadrant C |
| Plot type | Count rate plots | Images |
|---|---|---|
| Comparison with Poisson distribution Blue bars denote a histogram of data divided into 1 sec bins. Red curve is a Poisson curve with rate = median count rate of data. |
 |
 |
| Quadrant-wise count rates Data is divided into 100 sec bins |
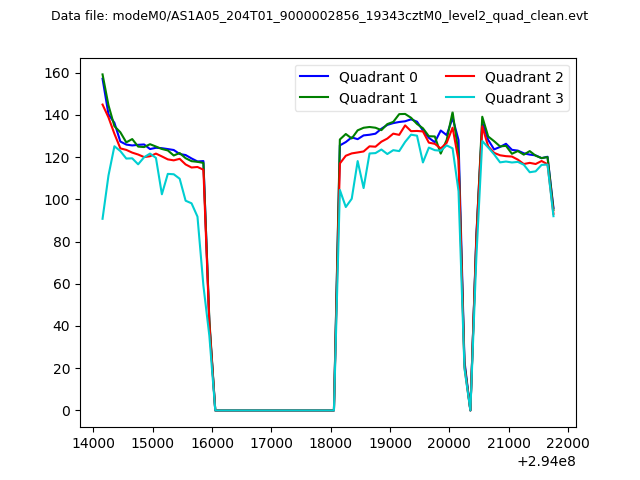 |
|
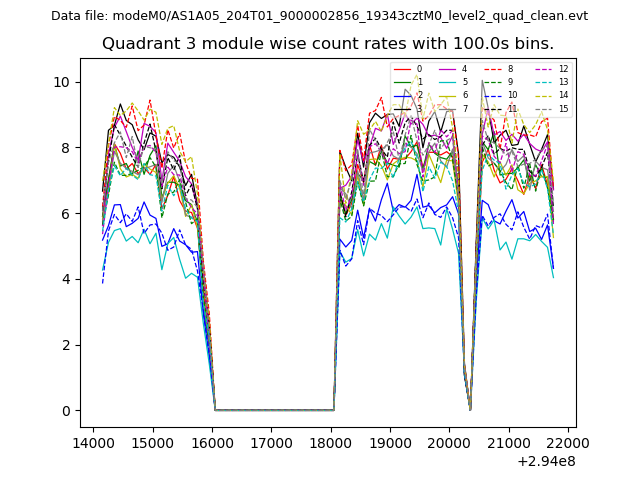
| Module-wise count rates for Quadrant A Data is divided into 100 sec bins |
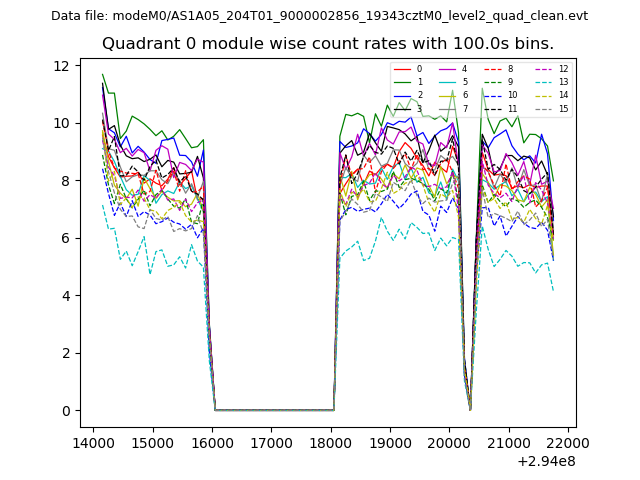 |
 |
| Module-wise count rates for Quadrant B Data is divided into 100 sec bins |
 |
 |
| Module-wise count rates for Quadrant C Data is divided into 100 sec bins |
 |
 |
| Module-wise count rates for Quadrant D Data is divided into 100 sec bins |
 |
 |
| Parameter | Plot |
|---|---|
| CZT HV Monitor |  |
| D_VDD | 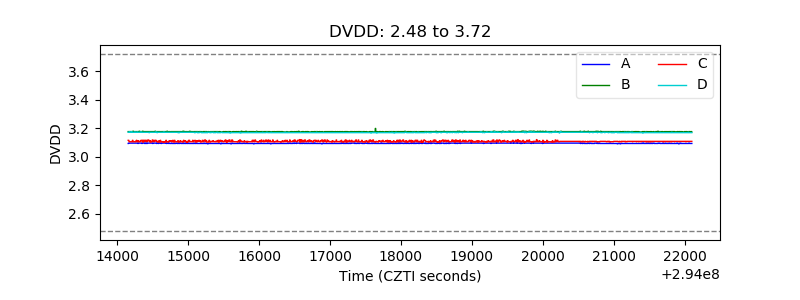 |
| Temperature 1 | 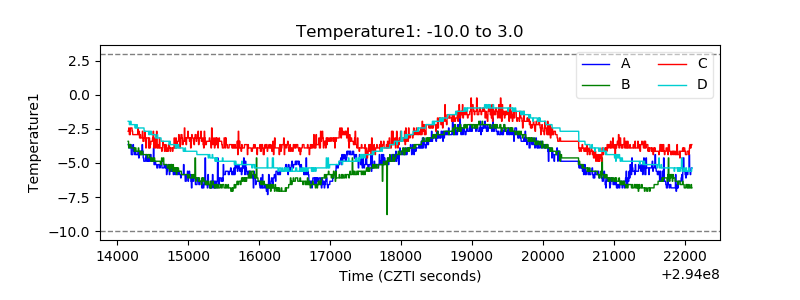 |
| Veto HV Monitor | 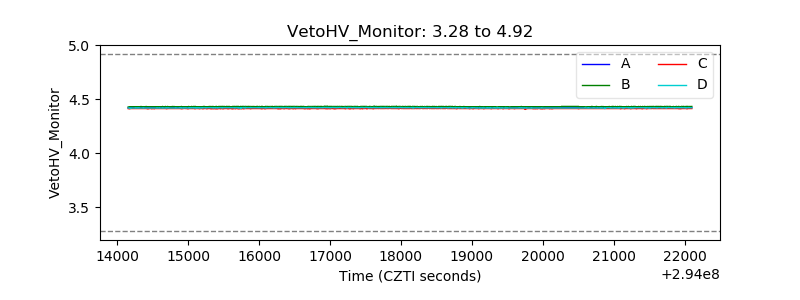 |
| Veto LLD | 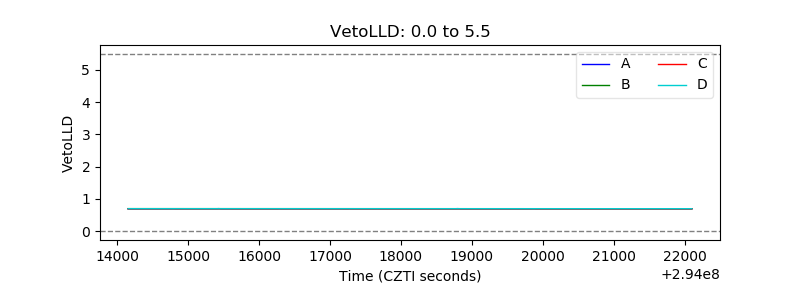 |
| Alpha Counter | 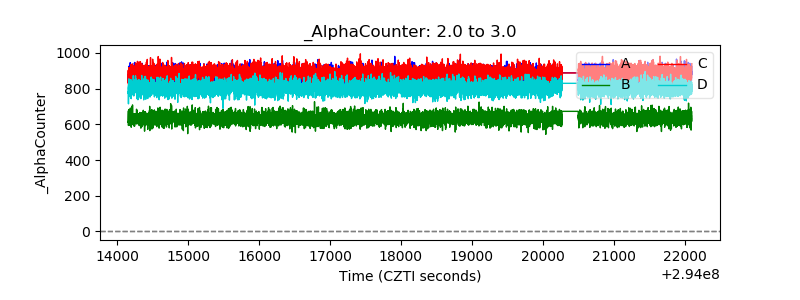 |
| _CPM_Rate | 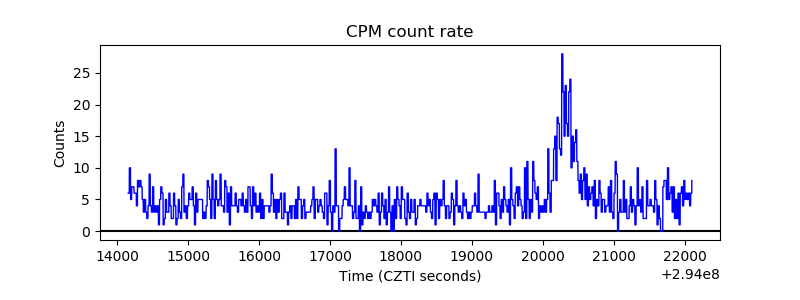 |
| CZT Counter | 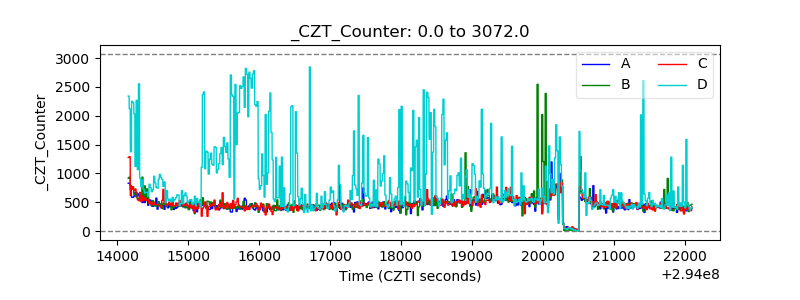 |
| +2.5 Volts monitor |  |
| +5 Volts monitor |  |
| _ROLL_ROT | 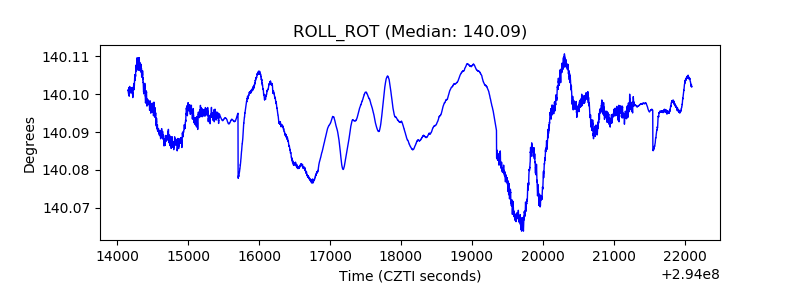 |
| _Roll_DEC | 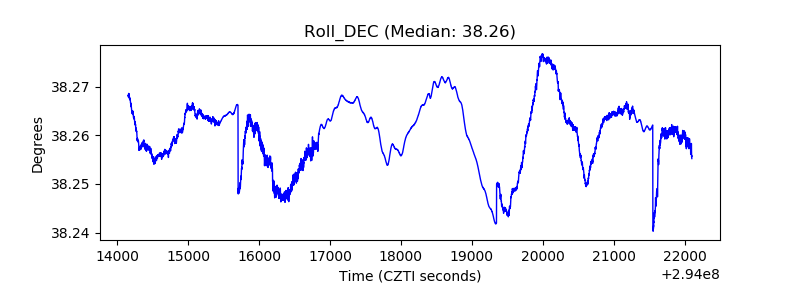 |
| _Roll_RA | 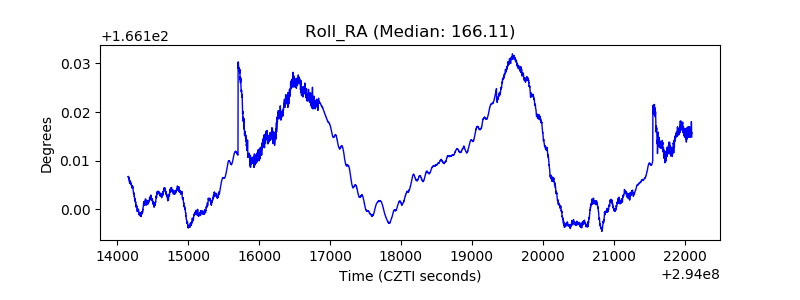 |
| Veto Counter | 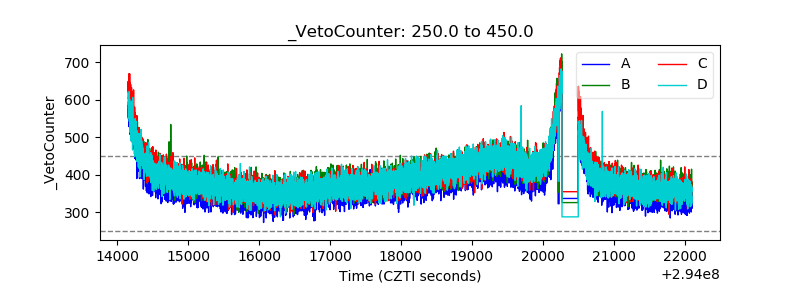 |