| Param | Original file | Final file |
|---|---|---|
| Filename | modeM0/AS1A05_204T01_9000002856_19346cztM0_level2.evt | modeM0/AS1A05_204T01_9000002856_19346cztM0_level2_quad_clean.evt |
| Size (bytes) | 1,677,841,920 | 214,698,240 |
| Size | 1.6 GB | 204.8 MB |
| Events in quadrant A | 9,842,623 | 1,334,961 |
| Events in quadrant B | 9,094,701 | 1,389,985 |
| Events in quadrant C | 8,995,929 | 1,334,465 |
| Events in quadrant D | 21,613,978 | 1,148,067 |
| Mode M0 | |||
|---|---|---|---|
| Quadrant | BADHDUFLAG | Total packets | Discarded packets |
| A | 0 | 41645 | 4 |
| B | 0 | 39047 | 4 |
| C | 0 | 38738 | 4 |
| D | 0 | 77068 | 4 |
| Mode M9 | |||
|---|---|---|---|
| Quadrant | BADHDUFLAG | Total packets | Discarded packets |
| A | 0 | 22 | 0 |
| B | 0 | 22 | 0 |
| C | 0 | 22 | 0 |
| D | 0 | 22 | 0 |
| Mode SS | |||
|---|---|---|---|
| Quadrant | BADHDUFLAG | Total packets | Discarded packets |
| A | 0 | 380 | 0 |
| B | 0 | 380 | 0 |
| C | 0 | 380 | 0 |
| D | 0 | 380 | 0 |
| Quadrant | Total seconds | Saturated seconds | Saturation percentage |
|---|---|---|---|
| A | 18786 | 609 | 3.241776% |
| B | 18786 | 228 | 1.213670% |
| C | 18786 | 237 | 1.261578% |
| D | 18786 | 4008 | 21.335037% |
Noise dominated data is calculated using 1-second bins in cleaned event files. If a bin has >2000 counts, and if more than 50% of those come from <1% of pixels, then it is considered to be noise-dominated and hence unusable.
| Quadrant | # 1 sec bins | Bins with >0 counts | Bins with >2000 counts | High rate bins dominated by noise | Noise dominated (total time) | Noise dominated (detector-on time) | Marked lightcurve |
|---|---|---|---|---|---|---|---|
| A | 20801 | 18790 | 434 | 434 | 2.09% | 2.31% | 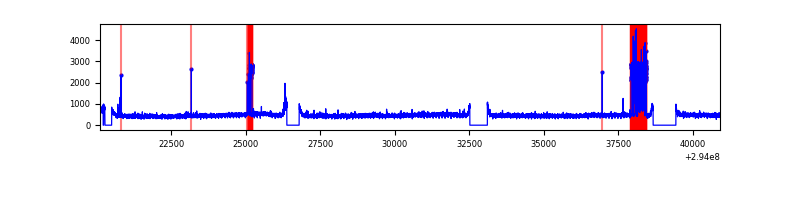 |
| B | 20801 | 18789 | 14 | 14 | 0.07% | 0.07% | 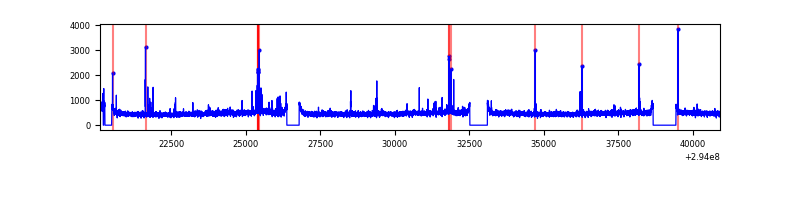 |
| C | 20801 | 18790 | 3 | 3 | 0.01% | 0.02% | 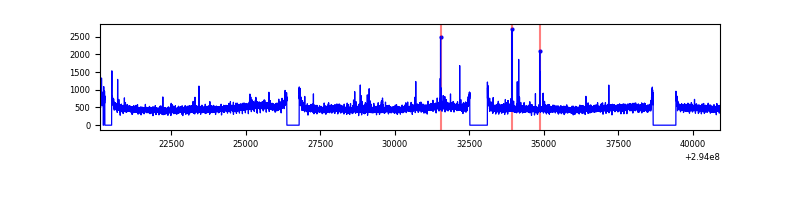 |
| D | 20801 | 18790 | 3633 | 3633 | 17.47% | 19.33% | 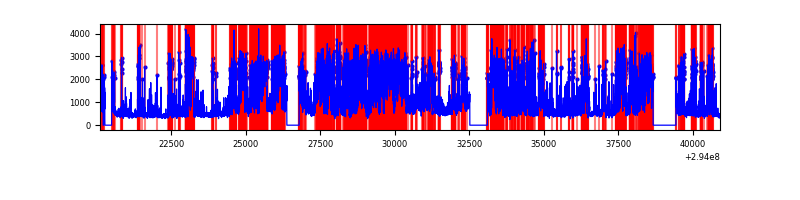 |
Top three noisy pixels from each quadrant. If the there are fewer than three noisy pixels in the level2.evt file, extra rows are filled as -1
| Pixel properties | Quadrant properties | ||||||
|---|---|---|---|---|---|---|---|
| Quadrant | DetID | PixID | Counts | Sigma | Mean | Median | Sigma |
| A | 11 | 29 | 1108815 | 2491.52 | 2207 | 2155 | 444.2 |
| A | 15 | 174 | 224190 | 499.89 | 2207 | 2155 | 444.2 |
| A | 0 | 226 | 19216 | 38.41 | 2207 | 2155 | 444.2 |
| B | 7 | 220 | 86760 | 197.0 | 2235 | 2174 | 429.4 |
| B | 0 | 230 | 69338 | 156.43 | 2235 | 2174 | 429.4 |
| B | 0 | 198 | 54378 | 121.58 | 2235 | 2174 | 429.4 |
| C | 14 | 238 | 335734 | 661.23 | 2158 | 2172 | 504.5 |
| C | 3 | 233 | 205831 | 403.72 | 2158 | 2172 | 504.5 |
| C | 9 | 160 | 27489 | 50.19 | 2158 | 2172 | 504.5 |
| D | 7 | 238 | 8194726 | 17024.62 | 1991 | 1935 | 481.2 |
| D | 1 | 52 | 2103760 | 4367.59 | 1991 | 1935 | 481.2 |
| D | 11 | 176 | 1715121 | 3560.0 | 1991 | 1935 | 481.2 |
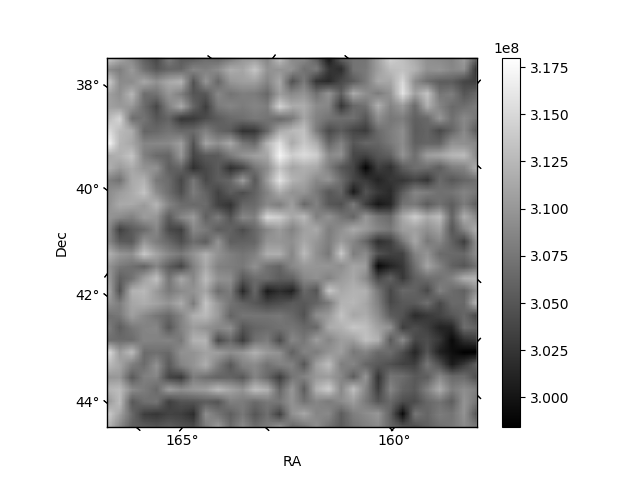
Histogram calculated using DETX and DETY for each event in the final _common_clean file
| Quadrant A | 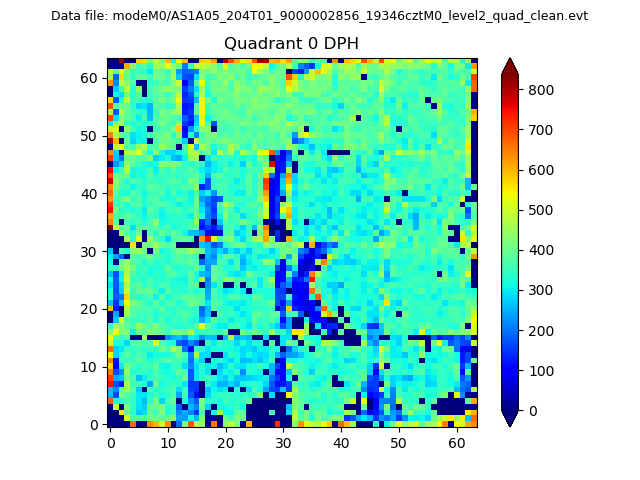 |
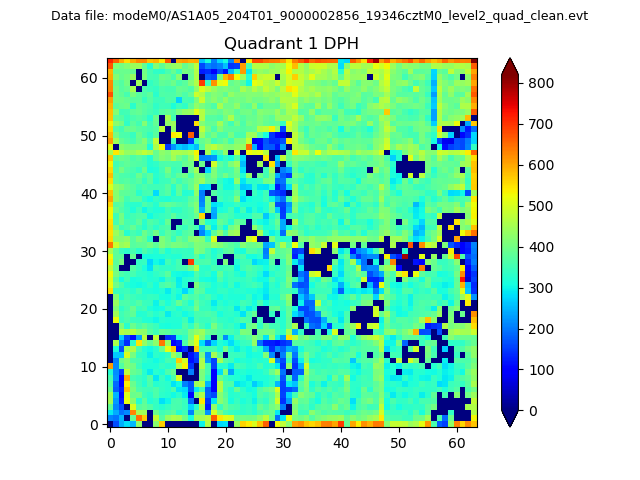 |
Quadrant B |
|---|---|---|---|
| Quadrant D |  |
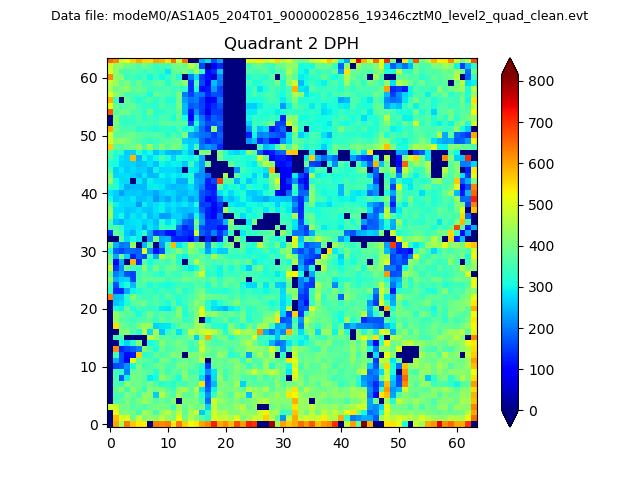 |
Quadrant C |
| Plot type | Count rate plots | Images |
|---|---|---|
| Comparison with Poisson distribution Blue bars denote a histogram of data divided into 1 sec bins. Red curve is a Poisson curve with rate = median count rate of data. |
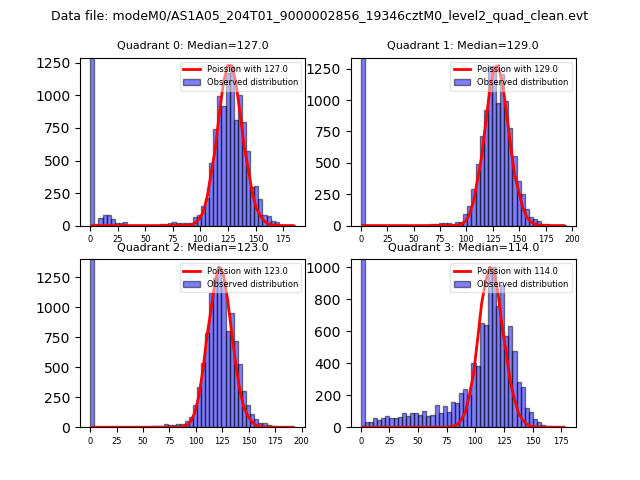 |
 |
| Quadrant-wise count rates Data is divided into 100 sec bins |
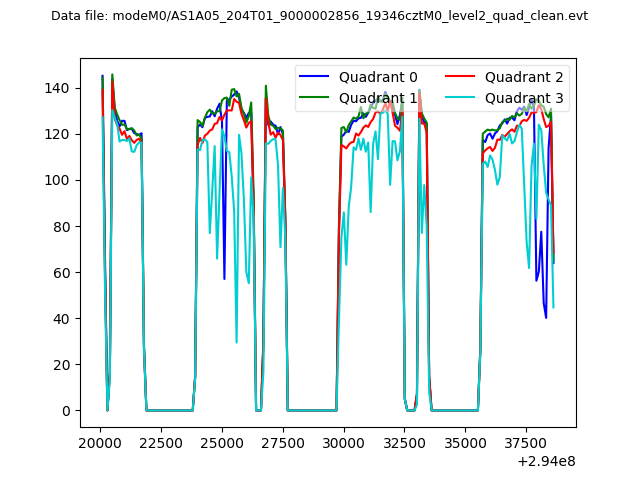 |
|
| Module-wise count rates for Quadrant A Data is divided into 100 sec bins |
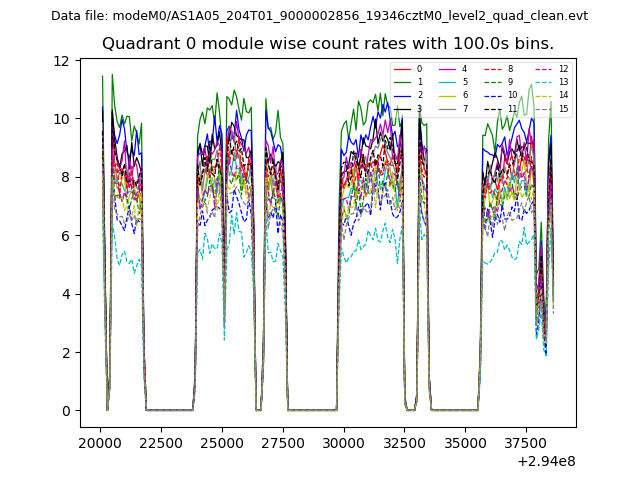 |
 |
| Module-wise count rates for Quadrant B Data is divided into 100 sec bins |
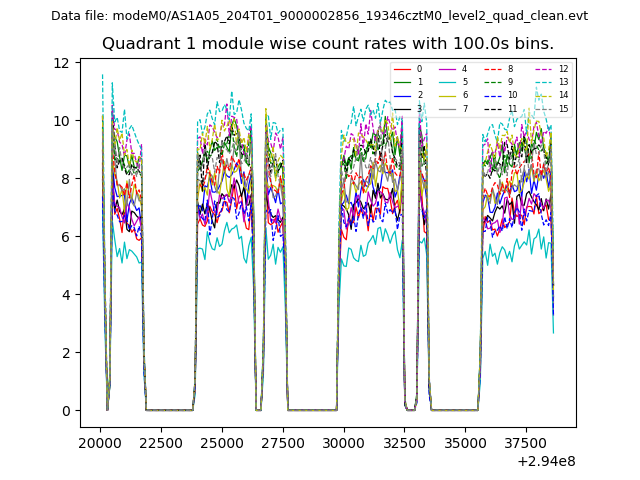 |
 |
| Module-wise count rates for Quadrant C Data is divided into 100 sec bins |
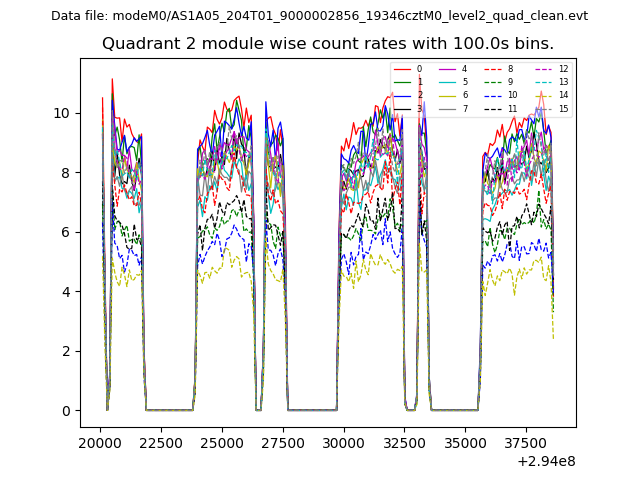 |
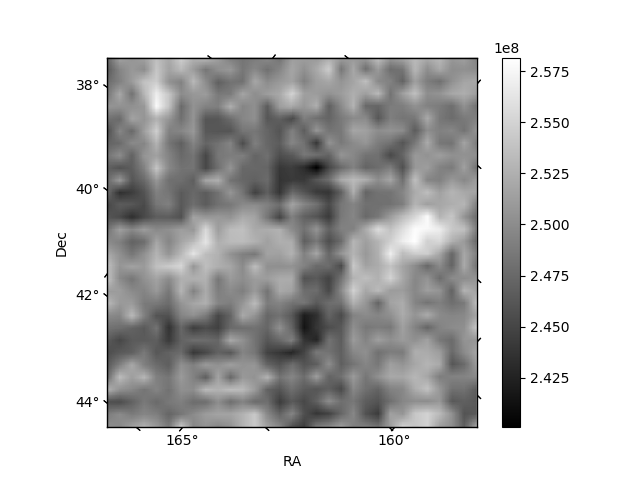 |
| Module-wise count rates for Quadrant D Data is divided into 100 sec bins |
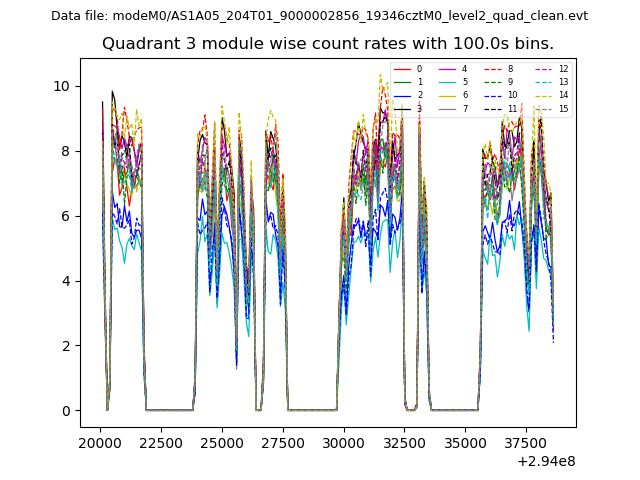 |
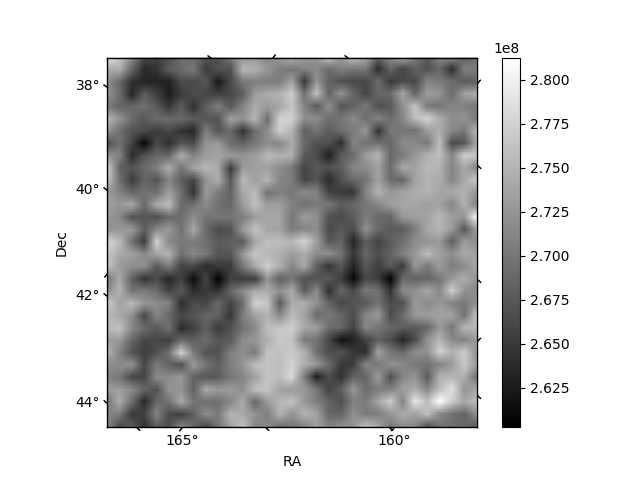 |
| Parameter | Plot |
|---|---|
| CZT HV Monitor | 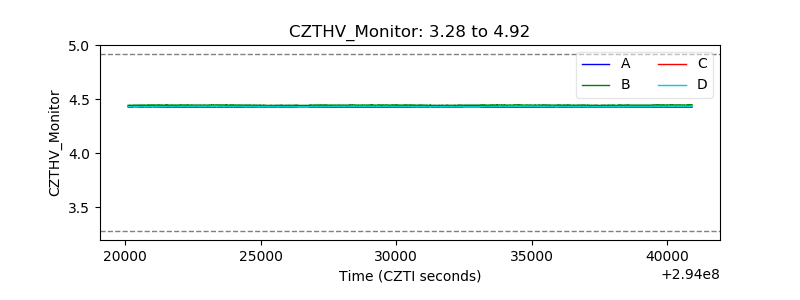 |
| D_VDD | 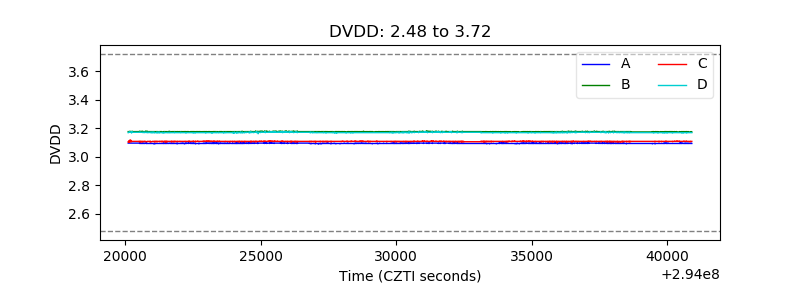 |
| Temperature 1 | 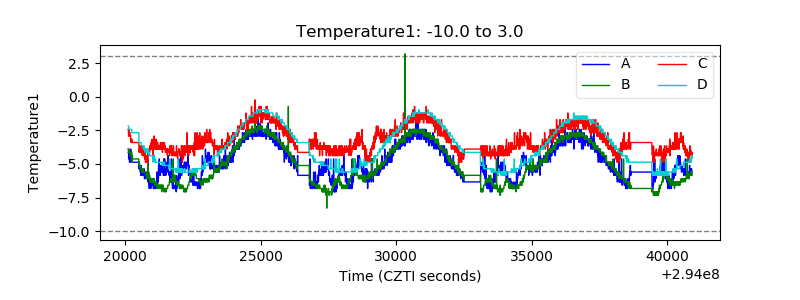 |
| Veto HV Monitor | 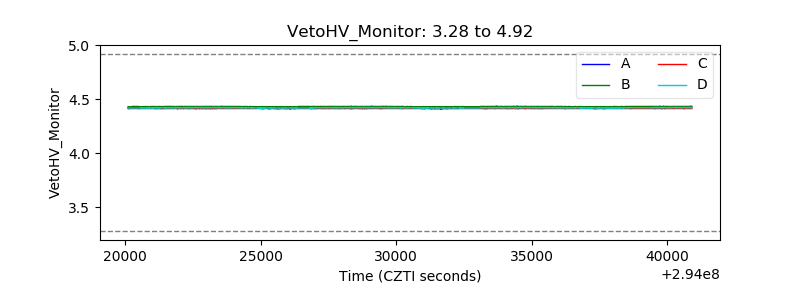 |
| Veto LLD |  |
| Alpha Counter |  |
| _CPM_Rate |  |
| CZT Counter | 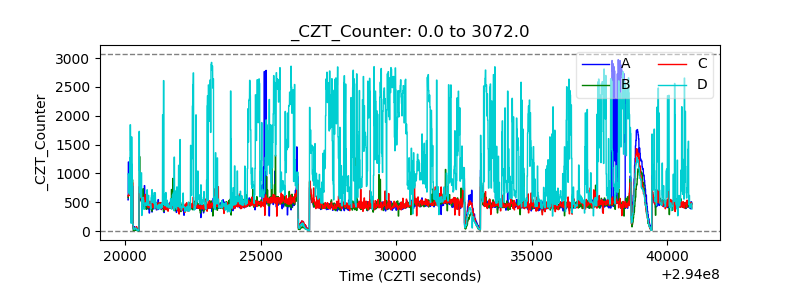 |
| +2.5 Volts monitor |  |
| +5 Volts monitor |  |
| _ROLL_ROT | 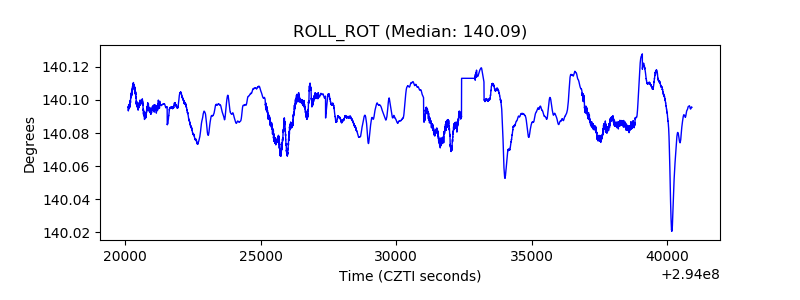 |
| _Roll_DEC | 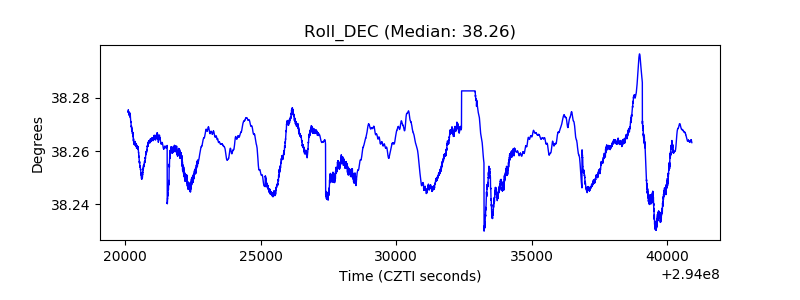 |
| _Roll_RA |  |
| Veto Counter | 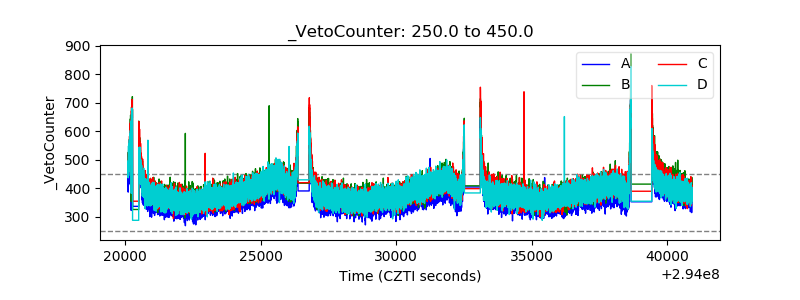 |