| Param | Original file | Final file |
|---|---|---|
| Filename | modeM0/AS1A05_204T01_9000002856_19349cztM0_level2.evt | modeM0/AS1A05_204T01_9000002856_19349cztM0_level2_quad_clean.evt |
| Size (bytes) | 578,024,640 | 88,963,200 |
| Size | 551.2 MB | 84.8 MB |
| Events in quadrant A | 3,602,317 | 564,543 |
| Events in quadrant B | 3,647,225 | 567,861 |
| Events in quadrant C | 3,589,757 | 540,677 |
| Events in quadrant D | 6,176,410 | 518,223 |
| Mode M0 | |||
|---|---|---|---|
| Quadrant | BADHDUFLAG | Total packets | Discarded packets |
| A | 0 | 15227 | 2 |
| B | 0 | 15318 | 2 |
| C | 0 | 15085 | 3 |
| D | 0 | 23191 | 2 |
| Mode M9 | |||
|---|---|---|---|
| Quadrant | BADHDUFLAG | Total packets | Discarded packets |
| A | 0 | 20 | 0 |
| B | 0 | 20 | 0 |
| C | 0 | 20 | 0 |
| D | 0 | 20 | 0 |
| Mode SS | |||
|---|---|---|---|
| Quadrant | BADHDUFLAG | Total packets | Discarded packets |
| A | 0 | 148 | 0 |
| B | 0 | 148 | 0 |
| C | 0 | 148 | 0 |
| D | 0 | 148 | 0 |
| Quadrant | Total seconds | Saturated seconds | Saturation percentage |
|---|---|---|---|
| A | 7221 | 134 | 1.855699% |
| B | 7222 | 147 | 2.035447% |
| C | 7221 | 142 | 1.966487% |
| D | 7221 | 751 | 10.400222% |
Noise dominated data is calculated using 1-second bins in cleaned event files. If a bin has >2000 counts, and if more than 50% of those come from <1% of pixels, then it is considered to be noise-dominated and hence unusable.
| Quadrant | # 1 sec bins | Bins with >0 counts | Bins with >2000 counts | High rate bins dominated by noise | Noise dominated (total time) | Noise dominated (detector-on time) | Marked lightcurve |
|---|---|---|---|---|---|---|---|
| A | 9211 | 7221 | 0 | 0 | 0.00% | 0.00% | 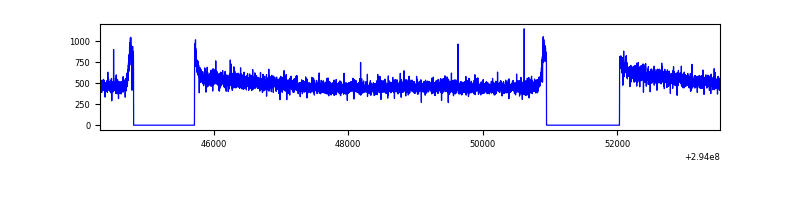 |
| B | 9212 | 7222 | 1 | 1 | 0.01% | 0.01% | 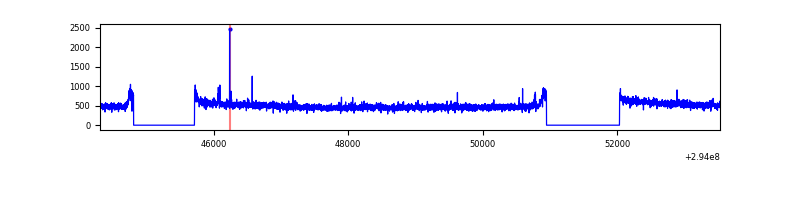 |
| C | 9211 | 7221 | 0 | 0 | 0.00% | 0.00% | 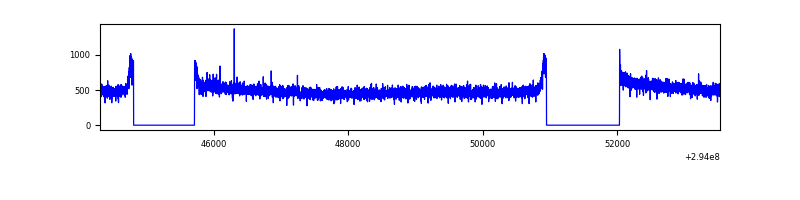 |
| D | 9210 | 7220 | 564 | 564 | 6.12% | 7.81% | 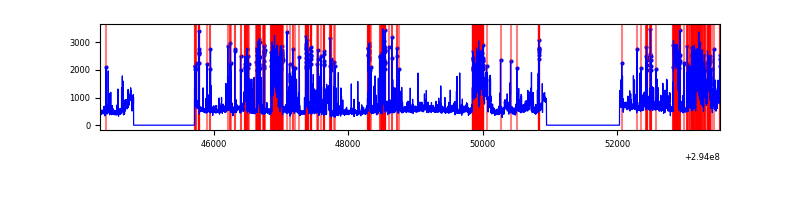 |
Top three noisy pixels from each quadrant. If the there are fewer than three noisy pixels in the level2.evt file, extra rows are filled as -1
| Pixel properties | Quadrant properties | ||||||
|---|---|---|---|---|---|---|---|
| Quadrant | DetID | PixID | Counts | Sigma | Mean | Median | Sigma |
| A | 13 | 254 | 8005 | 37.69 | 934 | 915 | 188.1 |
| A | 0 | 226 | 7982 | 37.57 | 934 | 915 | 188.1 |
| A | 3 | 137 | 7339 | 34.15 | 934 | 915 | 188.1 |
| B | 12 | 111 | 21524 | 116.38 | 923 | 901 | 177.2 |
| B | 0 | 230 | 19967 | 107.59 | 923 | 901 | 177.2 |
| B | 11 | 111 | 19267 | 103.64 | 923 | 901 | 177.2 |
| C | 14 | 238 | 138159 | 663.28 | 882 | 888 | 207.0 |
| C | 3 | 233 | 11768 | 52.57 | 882 | 888 | 207.0 |
| C | 13 | 61 | 6109 | 25.23 | 882 | 888 | 207.0 |
| D | 7 | 238 | 1951163 | 9270.04 | 864 | 841 | 210.4 |
| D | 13 | 104 | 289317 | 1371.15 | 864 | 841 | 210.4 |
| D | 10 | 66 | 216364 | 1024.4 | 864 | 841 | 210.4 |
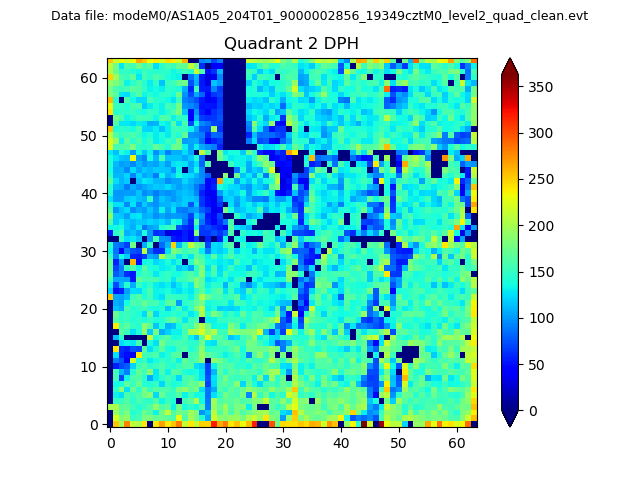
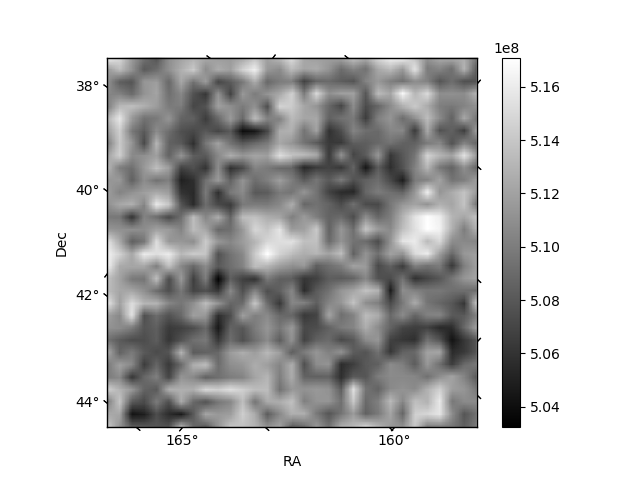
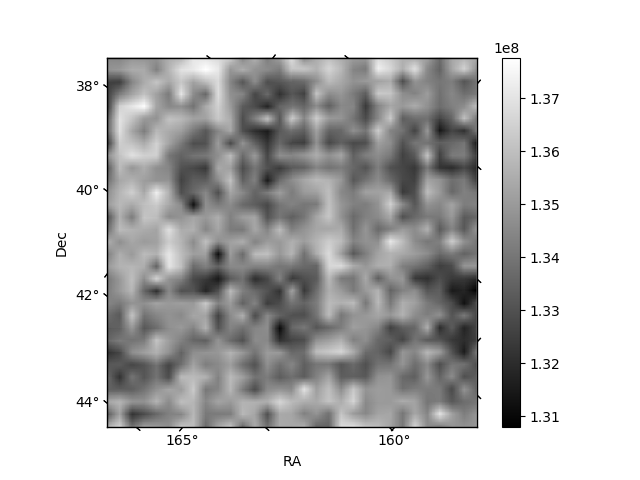
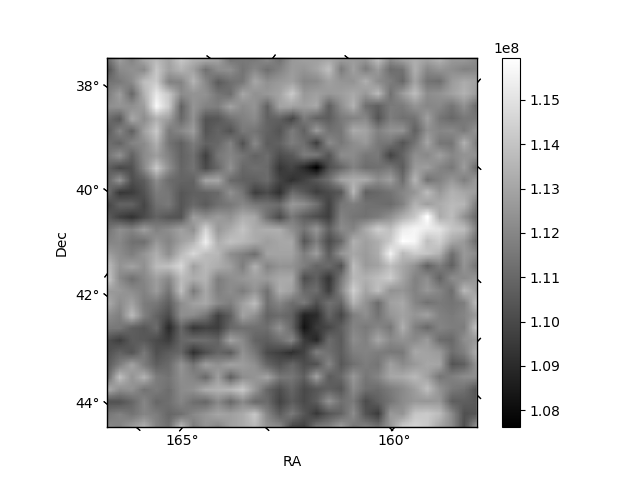
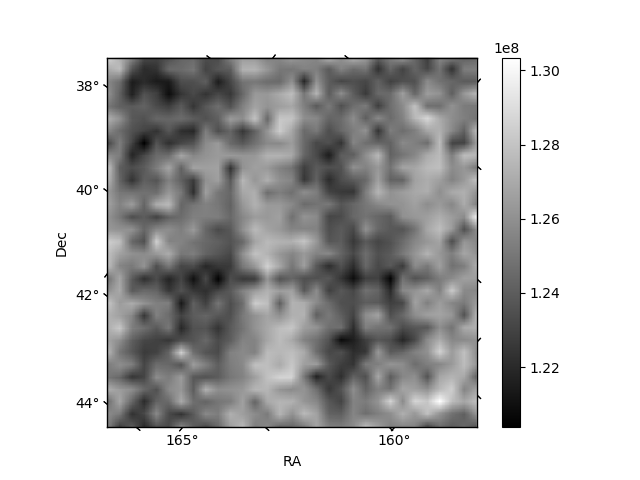
Histogram calculated using DETX and DETY for each event in the final _common_clean file
| Quadrant A | 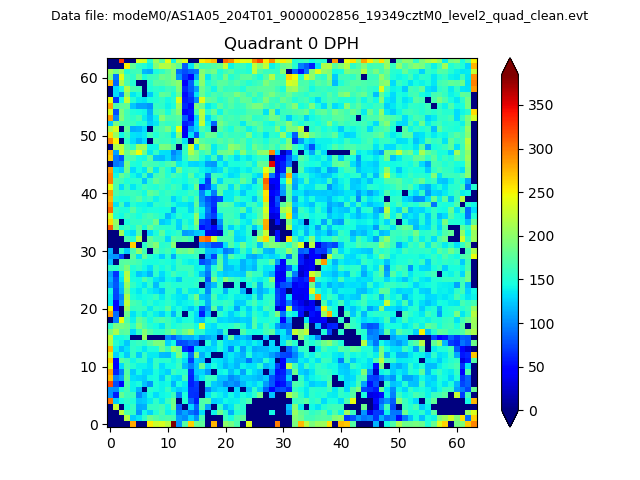 |
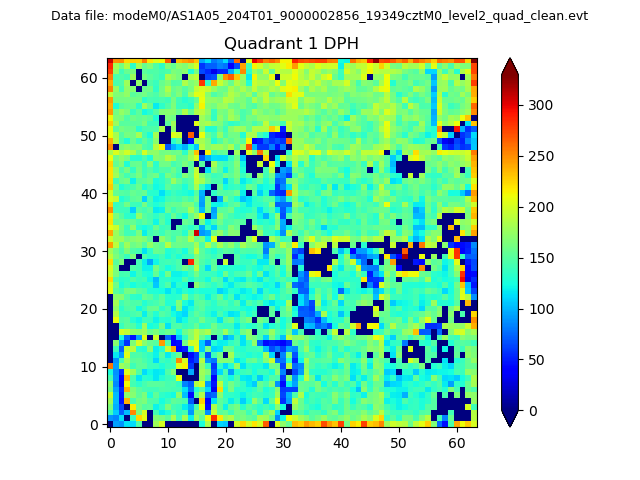 |
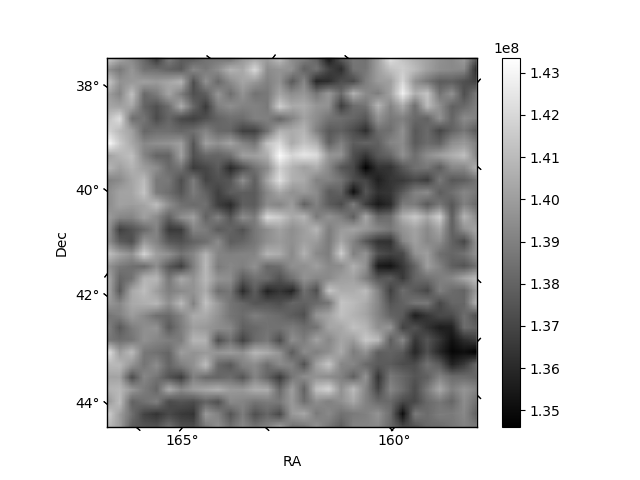
Quadrant B |
|---|---|---|---|
| Quadrant D | 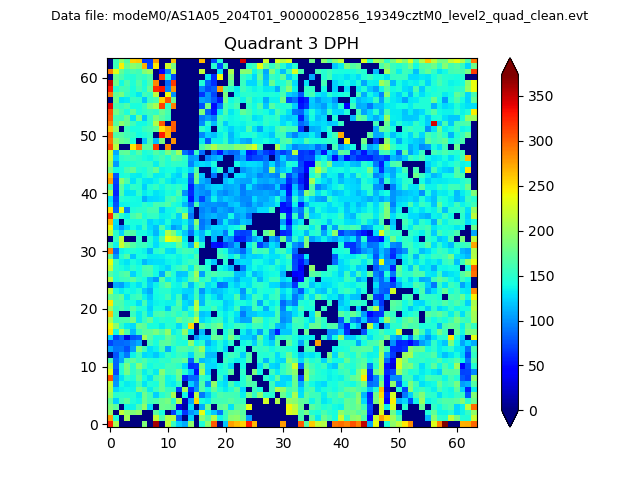 |
 |
Quadrant C |
| Plot type | Count rate plots | Images |
|---|---|---|
| Comparison with Poisson distribution Blue bars denote a histogram of data divided into 1 sec bins. Red curve is a Poisson curve with rate = median count rate of data. |
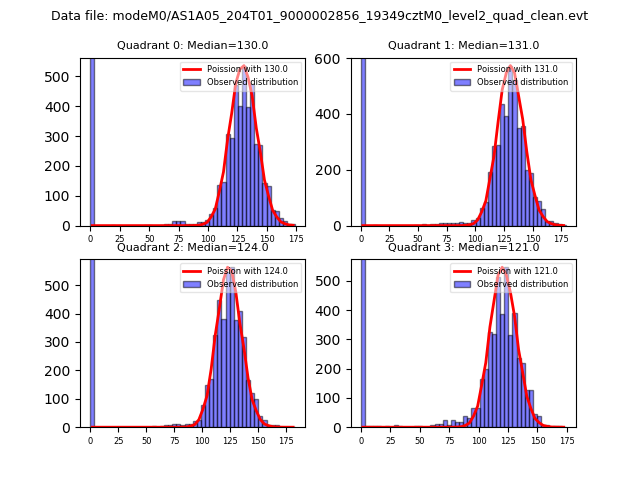 |
 |
| Quadrant-wise count rates Data is divided into 100 sec bins |
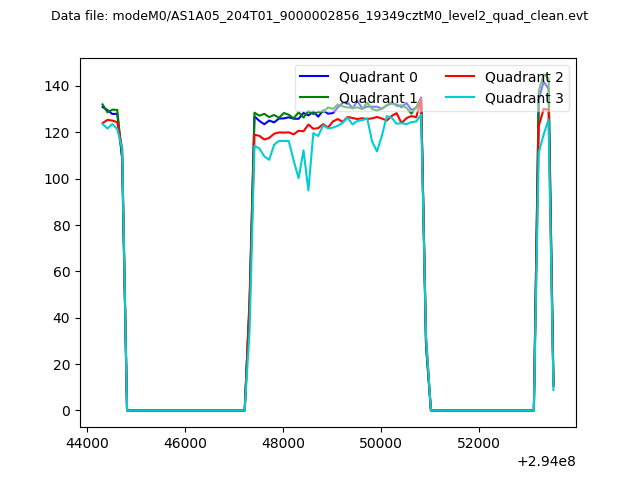 |
|
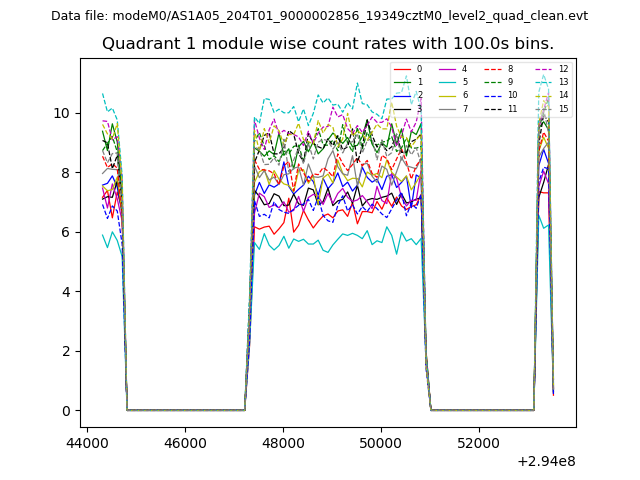
| Module-wise count rates for Quadrant A Data is divided into 100 sec bins |
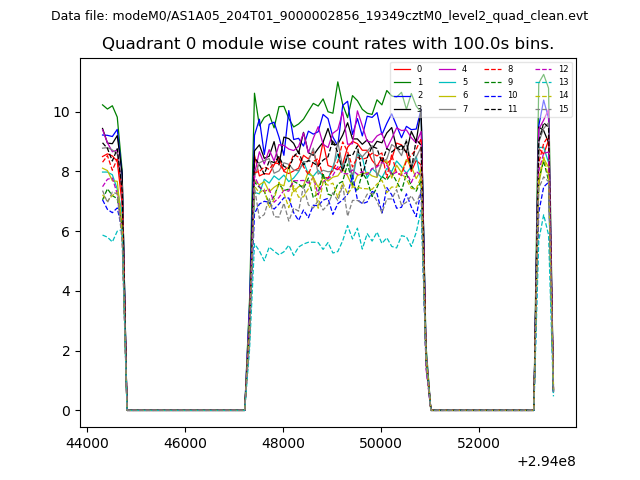 |
 |
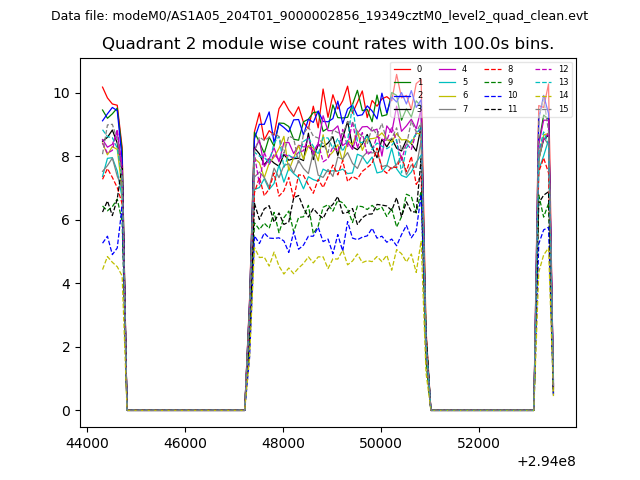
| Module-wise count rates for Quadrant B Data is divided into 100 sec bins |
 |
 |
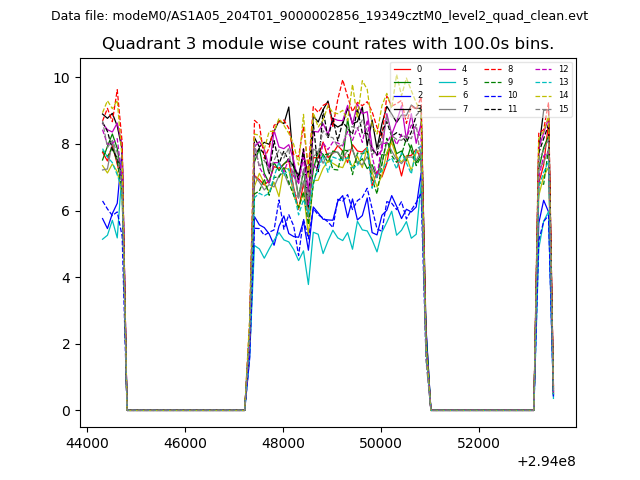
| Module-wise count rates for Quadrant C Data is divided into 100 sec bins |
 |
 |
| Module-wise count rates for Quadrant D Data is divided into 100 sec bins |
 |
 |
| Parameter | Plot |
|---|---|
| CZT HV Monitor | 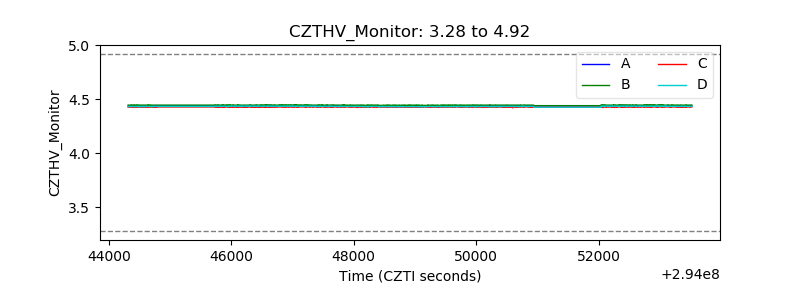 |
| D_VDD | 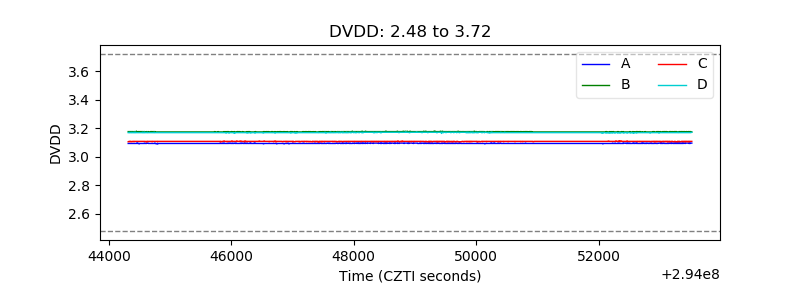 |
| Temperature 1 | 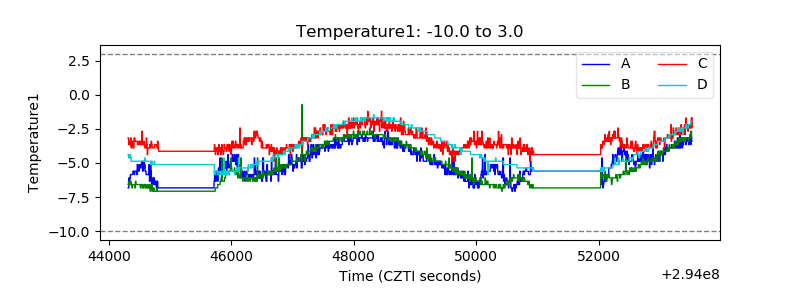 |
| Veto HV Monitor |  |
| Veto LLD | 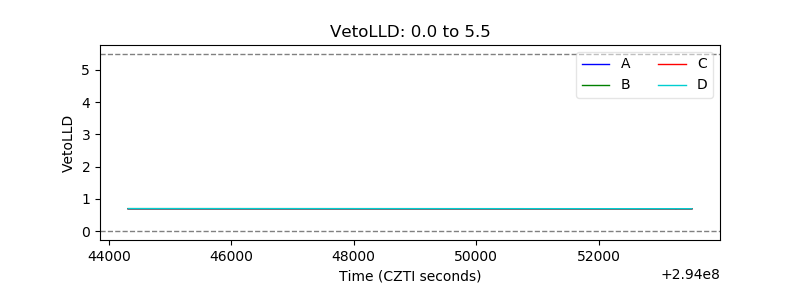 |
| Alpha Counter |  |
| _CPM_Rate | 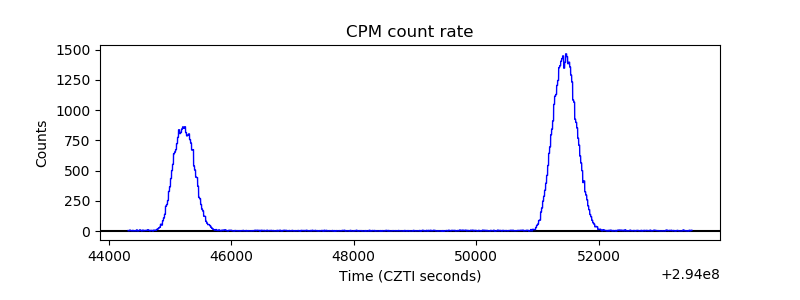 |
| CZT Counter | 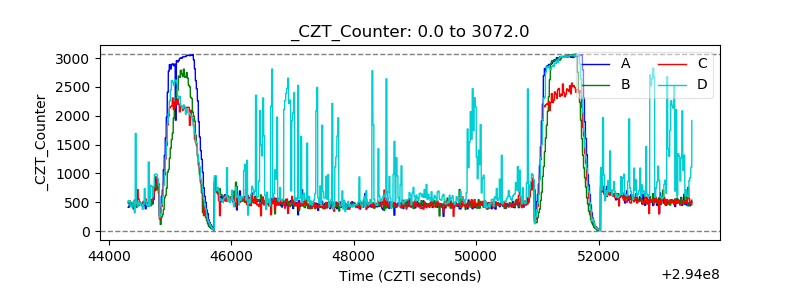 |
| +2.5 Volts monitor |  |
| +5 Volts monitor |  |
| _ROLL_ROT | 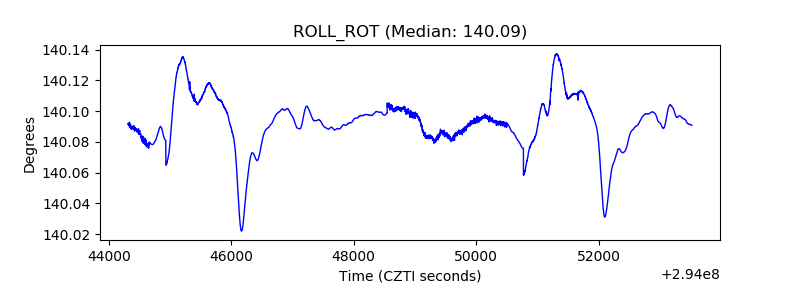 |
| _Roll_DEC | 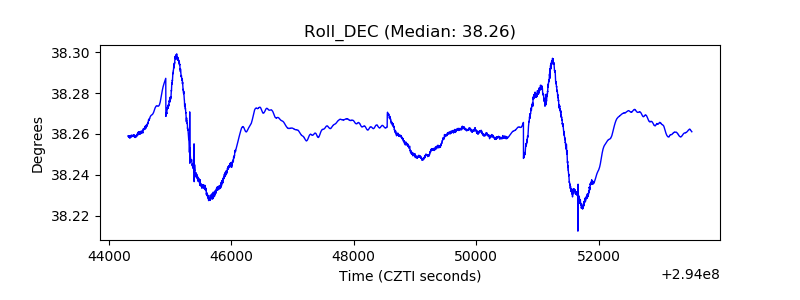 |
| _Roll_RA | 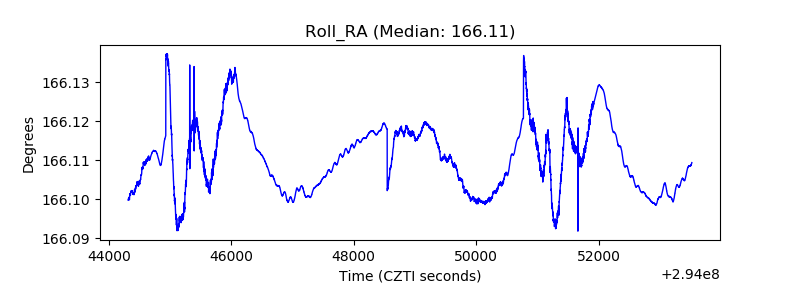 |
| Veto Counter | 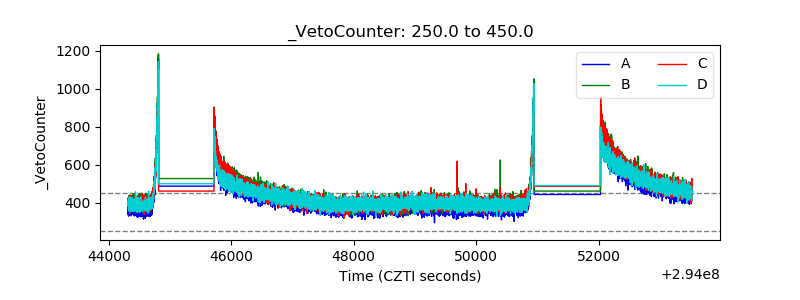 |