| Param | Original file | Final file |
|---|---|---|
| Filename | modeM0/AS1A05_204T01_9000002856_19351cztM0_level2.evt | modeM0/AS1A05_204T01_9000002856_19351cztM0_level2_quad_clean.evt |
| Size (bytes) | 472,164,480 | 106,822,080 |
| Size | 450.3 MB | 101.9 MB |
| Events in quadrant A | 3,170,429 | 731,265 |
| Events in quadrant B | 3,371,429 | 726,698 |
| Events in quadrant C | 3,144,851 | 685,959 |
| Events in quadrant D | 4,208,241 | 674,766 |
| Mode M0 | |||
|---|---|---|---|
| Quadrant | BADHDUFLAG | Total packets | Discarded packets |
| A | 0 | 13147 | 1 |
| B | 0 | 13740 | 1 |
| C | 0 | 12930 | 1 |
| D | 0 | 16439 | 1 |
| Mode M9 | |||
|---|---|---|---|
| Quadrant | BADHDUFLAG | Total packets | Discarded packets |
| A | 0 | 13 | 0 |
| B | 0 | 13 | 0 |
| C | 0 | 13 | 0 |
| D | 0 | 13 | 0 |
| Mode SS | |||
|---|---|---|---|
| Quadrant | BADHDUFLAG | Total packets | Discarded packets |
| A | 0 | 122 | 0 |
| B | 0 | 122 | 0 |
| C | 0 | 122 | 0 |
| D | 0 | 122 | 0 |
| Quadrant | Total seconds | Saturated seconds | Saturation percentage |
|---|---|---|---|
| A | 5961 | 88 | 1.476262% |
| B | 5961 | 115 | 1.929207% |
| C | 5961 | 101 | 1.694347% |
| D | 5962 | 238 | 3.991949% |
Noise dominated data is calculated using 1-second bins in cleaned event files. If a bin has >2000 counts, and if more than 50% of those come from <1% of pixels, then it is considered to be noise-dominated and hence unusable.
| Quadrant | # 1 sec bins | Bins with >0 counts | Bins with >2000 counts | High rate bins dominated by noise | Noise dominated (total time) | Noise dominated (detector-on time) | Marked lightcurve |
|---|---|---|---|---|---|---|---|
| A | 7236 | 5961 | 0 | 0 | 0.00% | 0.00% | 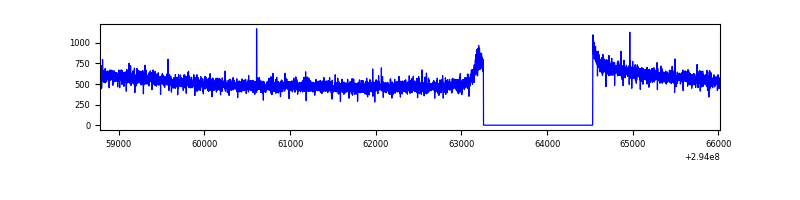 |
| B | 7236 | 5961 | 26 | 26 | 0.36% | 0.44% | 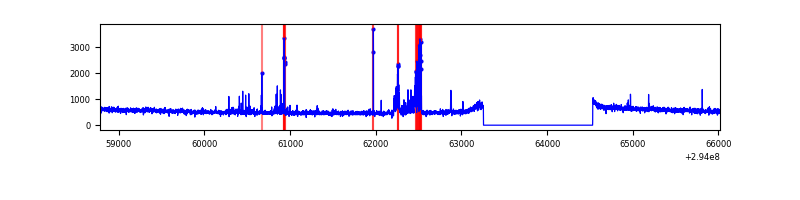 |
| C | 7236 | 5961 | 0 | 0 | 0.00% | 0.00% | 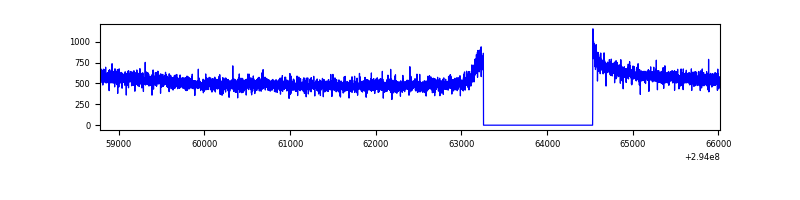 |
| D | 7237 | 5962 | 155 | 155 | 2.14% | 2.60% | 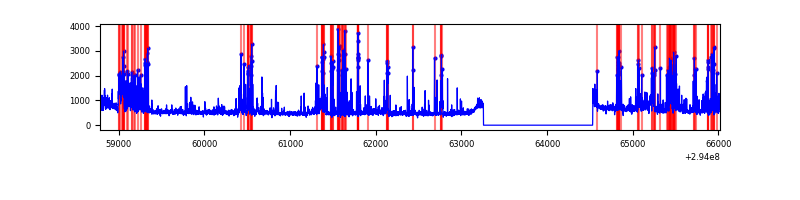 |
Top three noisy pixels from each quadrant. If the there are fewer than three noisy pixels in the level2.evt file, extra rows are filled as -1
| Pixel properties | Quadrant properties | ||||||
|---|---|---|---|---|---|---|---|
| Quadrant | DetID | PixID | Counts | Sigma | Mean | Median | Sigma |
| A | 5 | 203 | 8371 | 46.54 | 821 | 805 | 162.6 |
| A | 0 | 226 | 7149 | 39.02 | 821 | 805 | 162.6 |
| A | 13 | 254 | 6746 | 36.54 | 821 | 805 | 162.6 |
| B | 5 | 255 | 145987 | 969.85 | 799 | 781 | 149.7 |
| B | 0 | 190 | 25891 | 167.71 | 799 | 781 | 149.7 |
| B | 7 | 220 | 25390 | 164.36 | 799 | 781 | 149.7 |
| C | 14 | 238 | 121670 | 674.29 | 770 | 777 | 179.3 |
| C | 3 | 233 | 12673 | 66.35 | 770 | 777 | 179.3 |
| C | 5 | 175 | 7397 | 36.92 | 770 | 777 | 179.3 |
| D | 11 | 176 | 532075 | 2805.15 | 786 | 765 | 189.4 |
| D | 7 | 238 | 428656 | 2259.13 | 786 | 765 | 189.4 |
| D | 1 | 52 | 138746 | 728.5 | 786 | 765 | 189.4 |
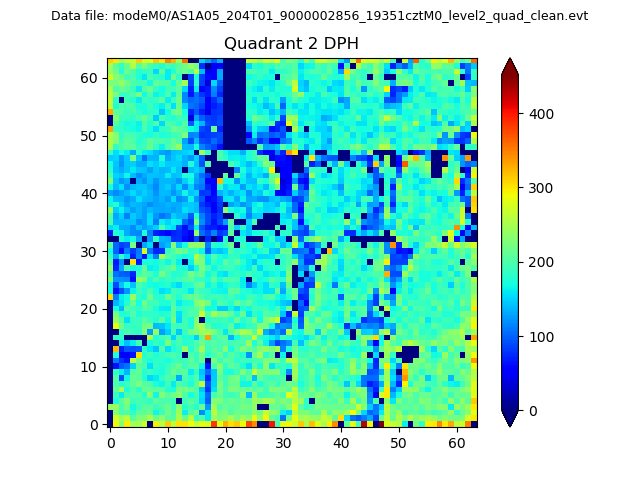
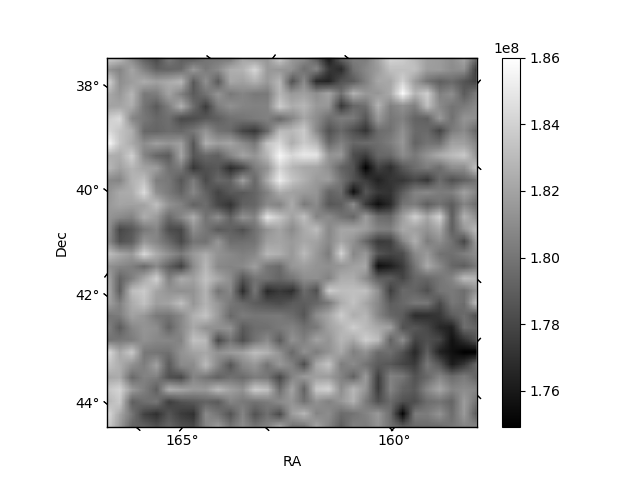
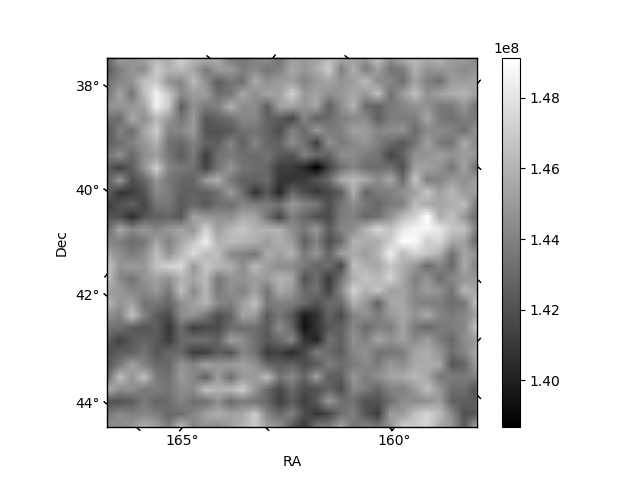
Histogram calculated using DETX and DETY for each event in the final _common_clean file
| Quadrant A | 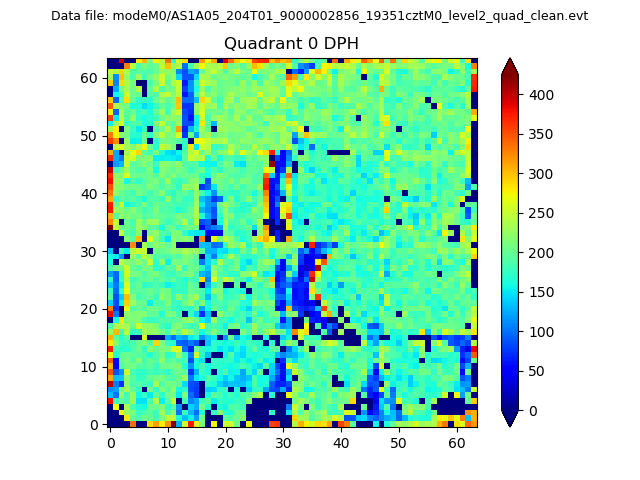 |
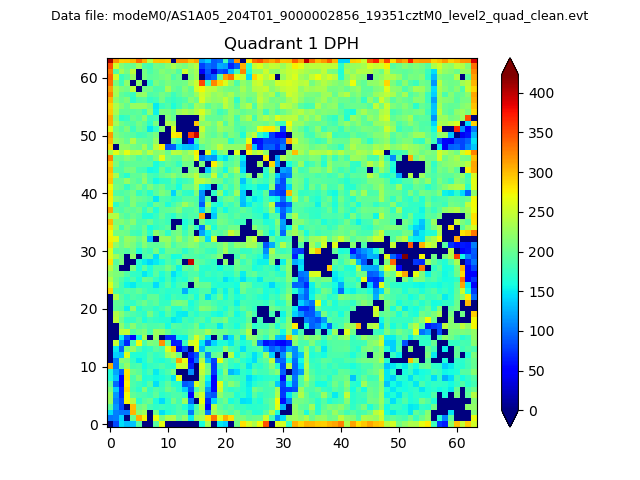 |
Quadrant B |
|---|---|---|---|
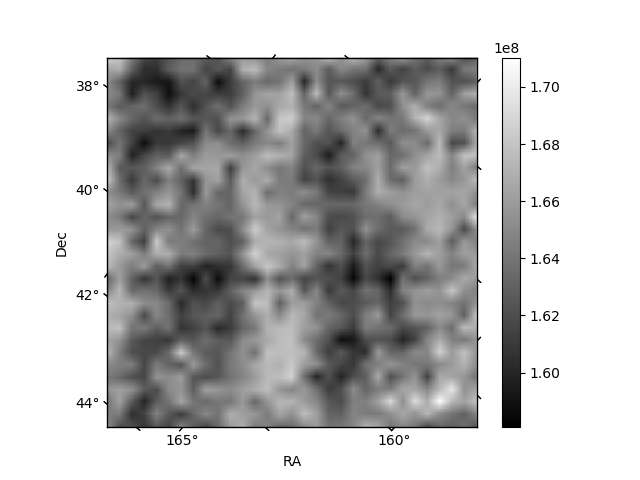
| Quadrant D | 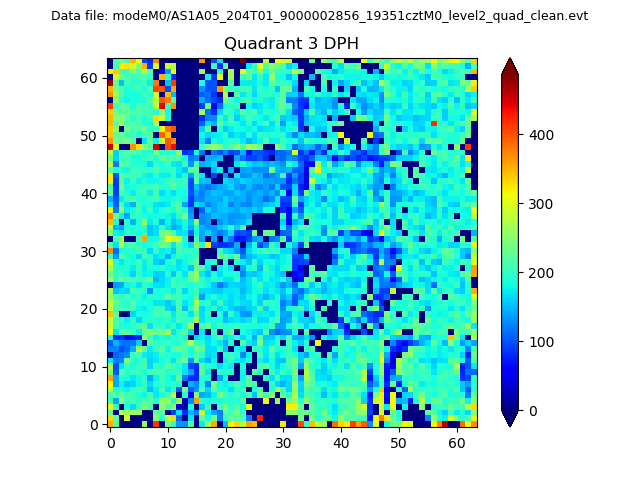 |
 |
Quadrant C |
| Plot type | Count rate plots | Images |
|---|---|---|
| Comparison with Poisson distribution Blue bars denote a histogram of data divided into 1 sec bins. Red curve is a Poisson curve with rate = median count rate of data. |
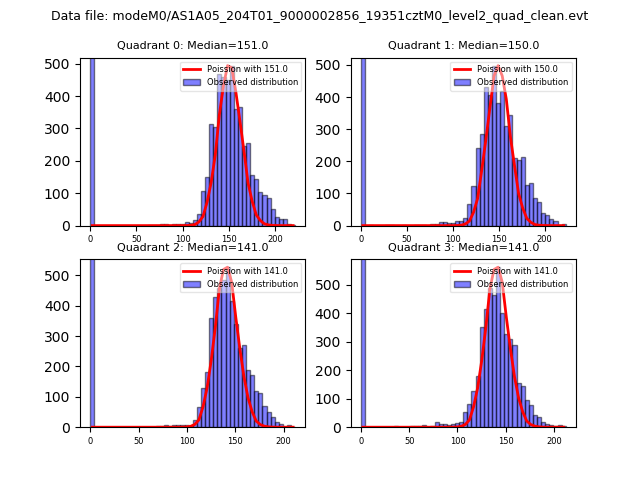 |
 |
| Quadrant-wise count rates Data is divided into 100 sec bins |
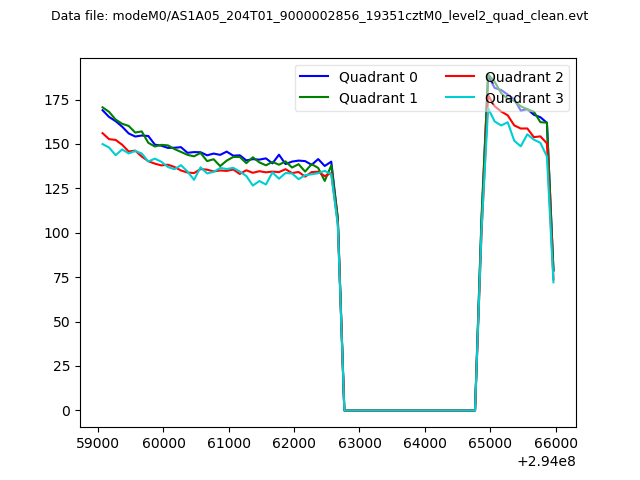 |
|
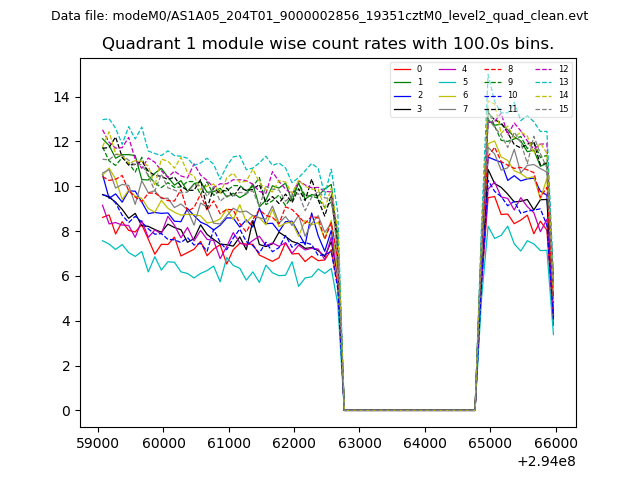
| Module-wise count rates for Quadrant A Data is divided into 100 sec bins |
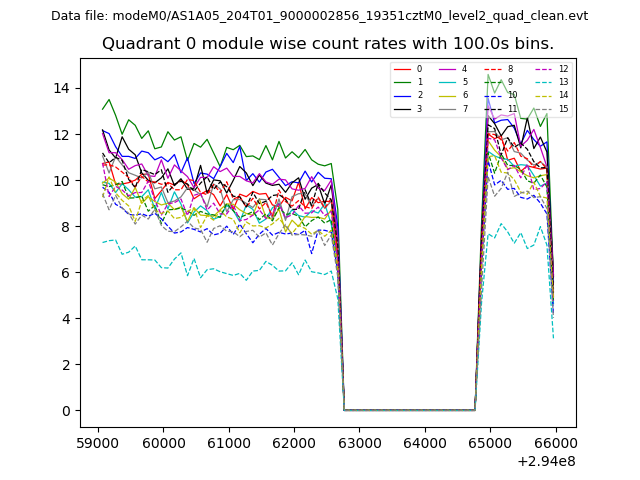 |
 |
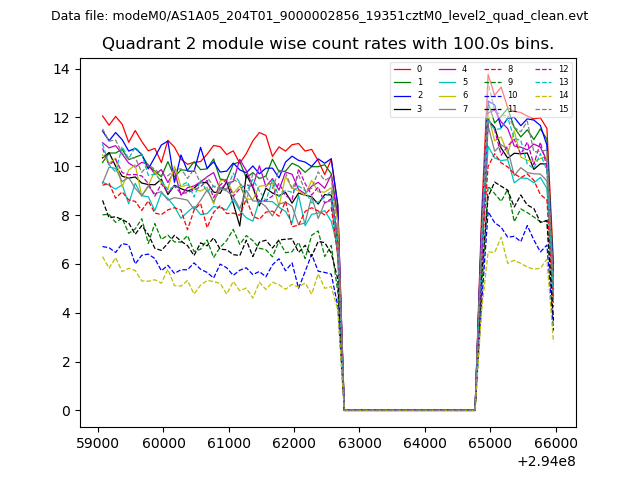
| Module-wise count rates for Quadrant B Data is divided into 100 sec bins |
 |
 |
| Module-wise count rates for Quadrant C Data is divided into 100 sec bins |
 |
 |
| Module-wise count rates for Quadrant D Data is divided into 100 sec bins |
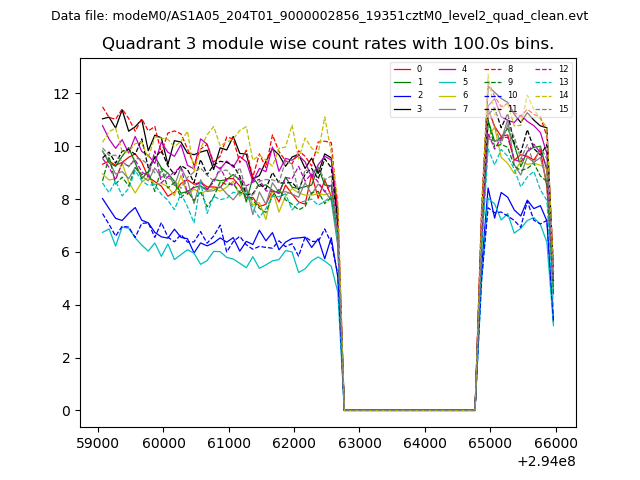 |
 |
| Parameter | Plot |
|---|---|
| CZT HV Monitor | 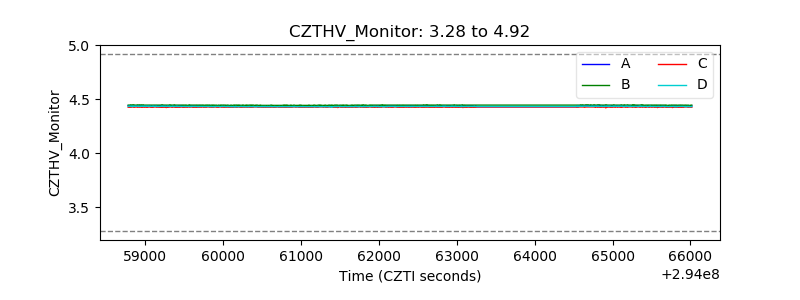 |
| D_VDD | 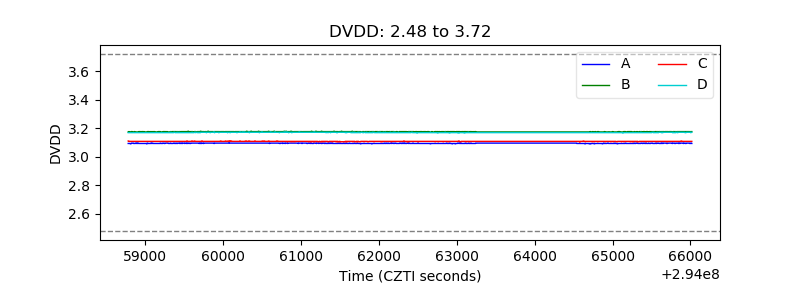 |
| Temperature 1 | 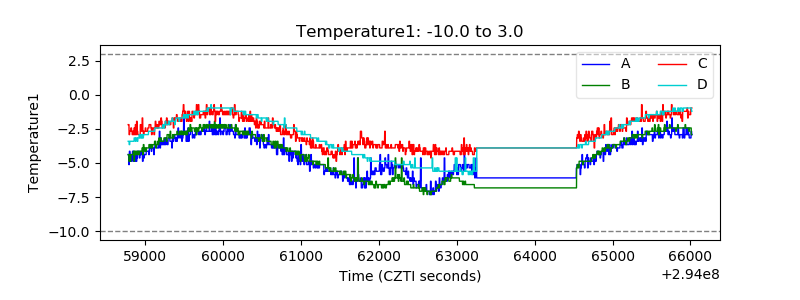 |
| Veto HV Monitor | 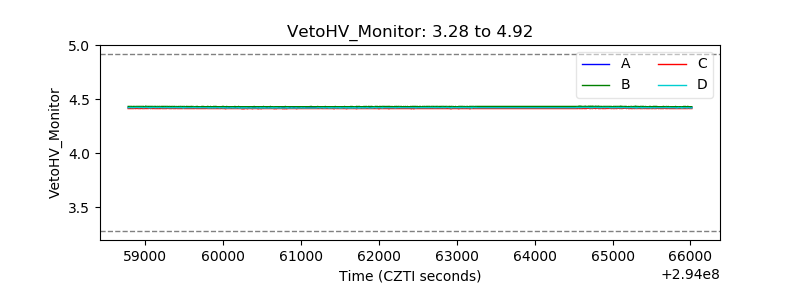 |
| Veto LLD | 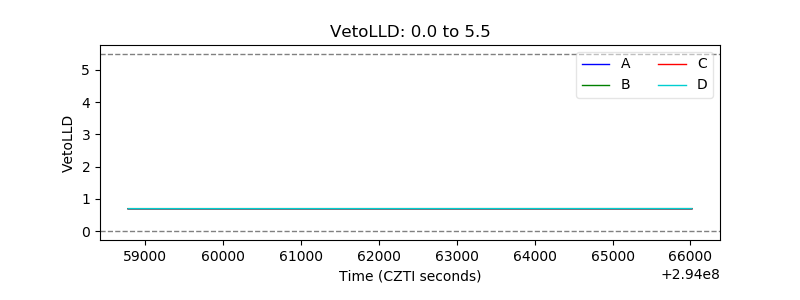 |
| Alpha Counter | 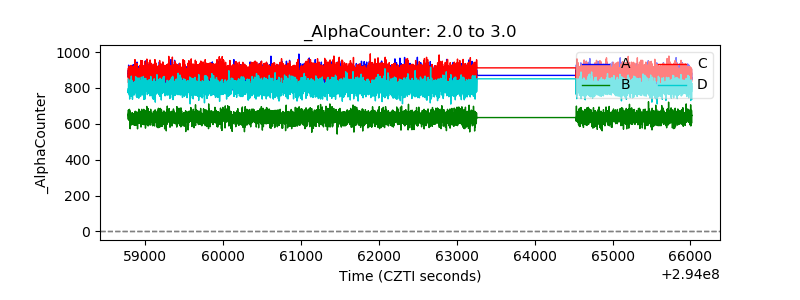 |
| _CPM_Rate | 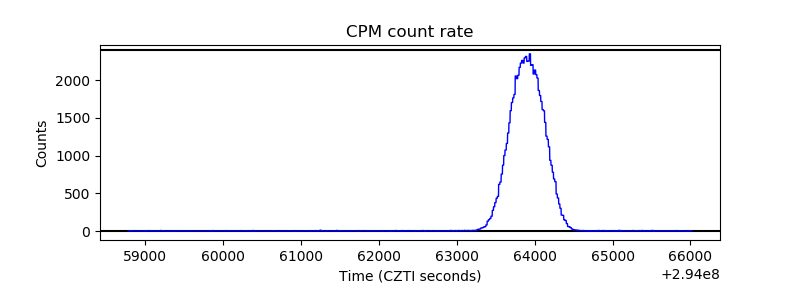 |
| CZT Counter |  |
| +2.5 Volts monitor |  |
| +5 Volts monitor |  |
| _ROLL_ROT | 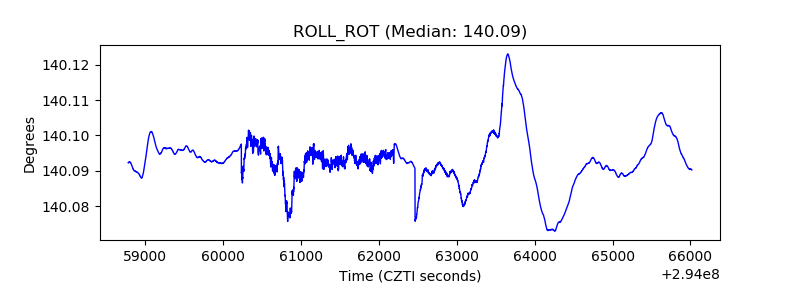 |
| _Roll_DEC | 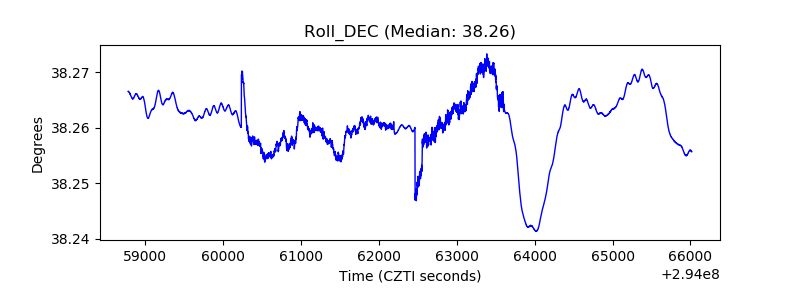 |
| _Roll_RA | 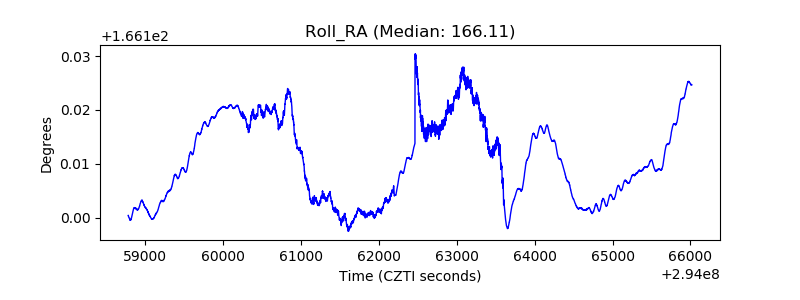 |
| Veto Counter | 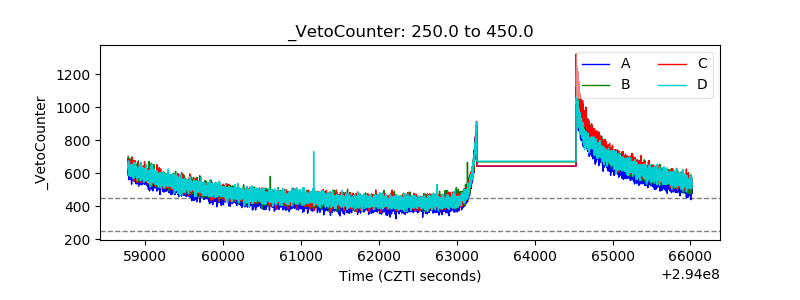 |