| Param | Original file | Final file |
|---|---|---|
| Filename | modeM0/AS1A05_204T01_9000002856_19352cztM0_level2.evt | modeM0/AS1A05_204T01_9000002856_19352cztM0_level2_quad_clean.evt |
| Size (bytes) | 455,414,400 | 111,496,320 |
| Size | 434.3 MB | 106.3 MB |
| Events in quadrant A | 3,445,569 | 763,278 |
| Events in quadrant B | 3,055,327 | 769,913 |
| Events in quadrant C | 3,009,224 | 728,238 |
| Events in quadrant D | 3,895,410 | 717,164 |
| Mode M0 | |||
|---|---|---|---|
| Quadrant | BADHDUFLAG | Total packets | Discarded packets |
| A | 0 | 13833 | 1 |
| B | 0 | 12597 | 1 |
| C | 0 | 12344 | 1 |
| D | 0 | 15411 | 1 |
| Mode M9 | |||
|---|---|---|---|
| Quadrant | BADHDUFLAG | Total packets | Discarded packets |
| A | 0 | 13 | 0 |
| B | 0 | 13 | 0 |
| C | 0 | 13 | 0 |
| D | 0 | 13 | 0 |
| Mode SS | |||
|---|---|---|---|
| Quadrant | BADHDUFLAG | Total packets | Discarded packets |
| A | 0 | 118 | 0 |
| B | 0 | 118 | 0 |
| C | 0 | 118 | 0 |
| D | 0 | 118 | 0 |
| Quadrant | Total seconds | Saturated seconds | Saturation percentage |
|---|---|---|---|
| A | 5690 | 215 | 3.778559% |
| B | 5690 | 86 | 1.511424% |
| C | 5690 | 105 | 1.845343% |
| D | 5691 | 182 | 3.198032% |
Noise dominated data is calculated using 1-second bins in cleaned event files. If a bin has >2000 counts, and if more than 50% of those come from <1% of pixels, then it is considered to be noise-dominated and hence unusable.
| Quadrant | # 1 sec bins | Bins with >0 counts | Bins with >2000 counts | High rate bins dominated by noise | Noise dominated (total time) | Noise dominated (detector-on time) | Marked lightcurve |
|---|---|---|---|---|---|---|---|
| A | 7030 | 5690 | 120 | 120 | 1.71% | 2.11% | 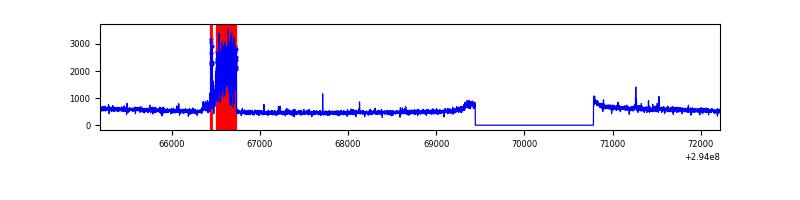 |
| B | 7030 | 5690 | 5 | 5 | 0.07% | 0.09% | 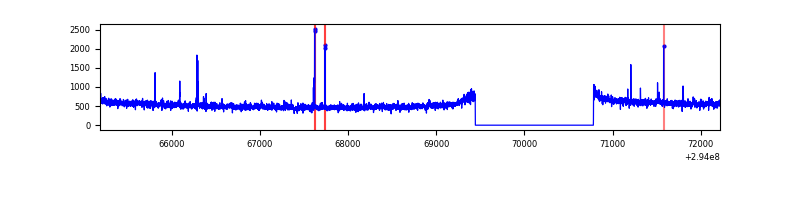 |
| C | 7030 | 5691 | 0 | 0 | 0.00% | 0.00% | 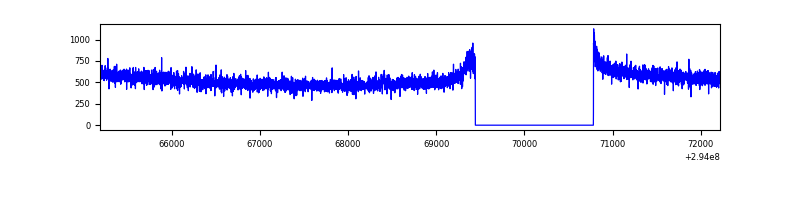 |
| D | 7031 | 5691 | 91 | 91 | 1.29% | 1.60% | 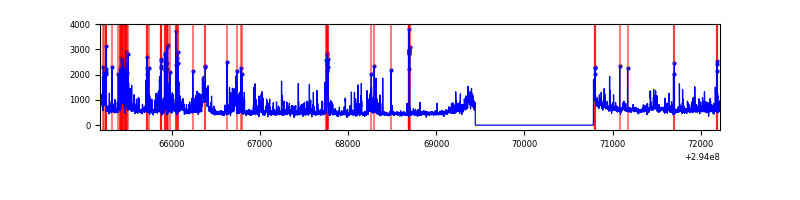 |
Top three noisy pixels from each quadrant. If the there are fewer than three noisy pixels in the level2.evt file, extra rows are filled as -1
| Pixel properties | Quadrant properties | ||||||
|---|---|---|---|---|---|---|---|
| Quadrant | DetID | PixID | Counts | Sigma | Mean | Median | Sigma |
| A | 15 | 174 | 440077 | 2856.35 | 775 | 762 | 153.8 |
| A | 8 | 205 | 13116 | 80.32 | 775 | 762 | 153.8 |
| A | 13 | 254 | 7128 | 41.39 | 775 | 762 | 153.8 |
| B | 0 | 229 | 29937 | 207.51 | 760 | 744 | 140.7 |
| B | 3 | 64 | 25259 | 174.26 | 760 | 744 | 140.7 |
| B | 0 | 190 | 21770 | 149.46 | 760 | 744 | 140.7 |
| C | 14 | 238 | 116491 | 680.28 | 737 | 743 | 170.1 |
| C | 3 | 233 | 18901 | 106.72 | 737 | 743 | 170.1 |
| C | 13 | 61 | 5205 | 26.22 | 737 | 743 | 170.1 |
| D | 7 | 238 | 709174 | 3967.01 | 754 | 737 | 178.6 |
| D | 11 | 176 | 107725 | 599.1 | 754 | 737 | 178.6 |
| D | 1 | 52 | 74748 | 414.44 | 754 | 737 | 178.6 |
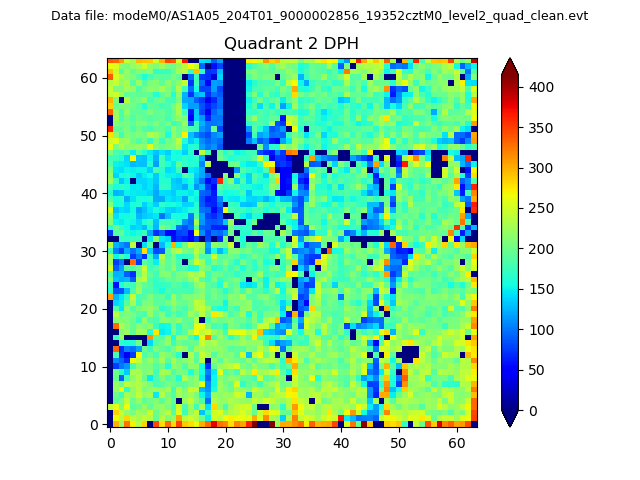
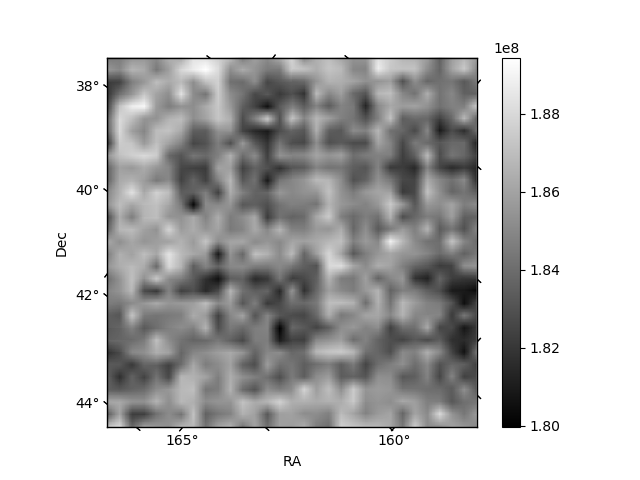
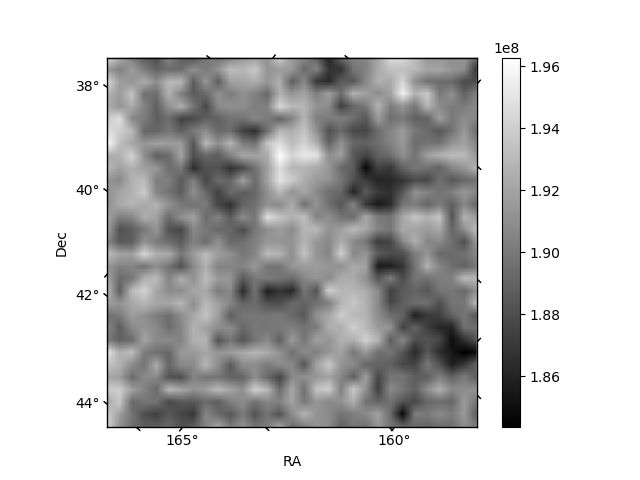
Histogram calculated using DETX and DETY for each event in the final _common_clean file
| Quadrant A |  |
 |
Quadrant B |
|---|---|---|---|
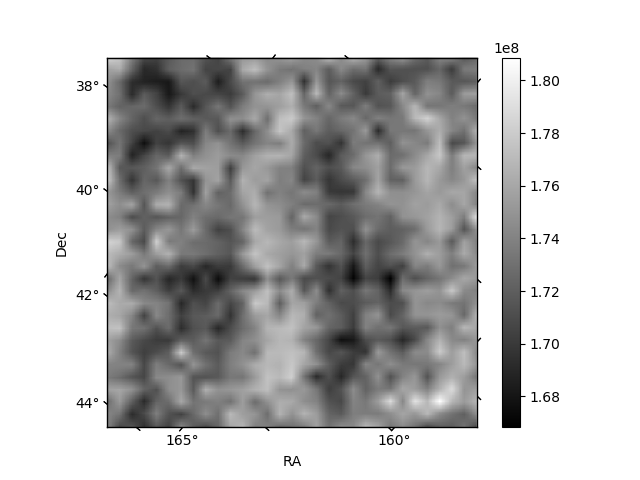
| Quadrant D | 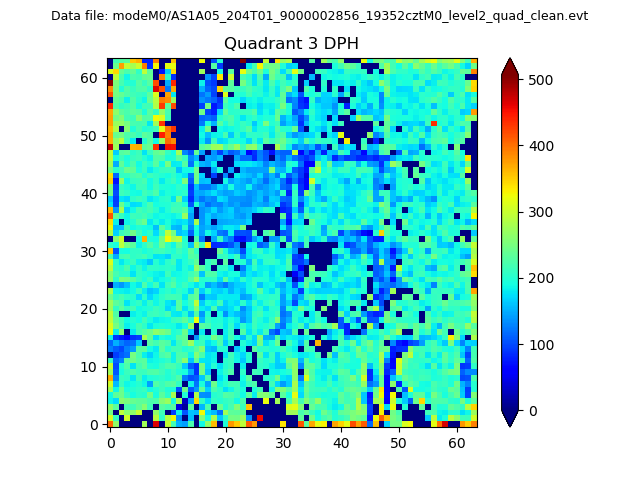 |
 |
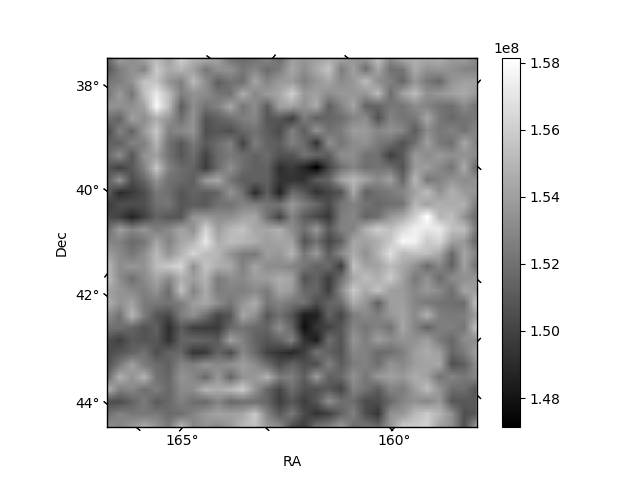
Quadrant C |
| Plot type | Count rate plots | Images |
|---|---|---|
| Comparison with Poisson distribution Blue bars denote a histogram of data divided into 1 sec bins. Red curve is a Poisson curve with rate = median count rate of data. |
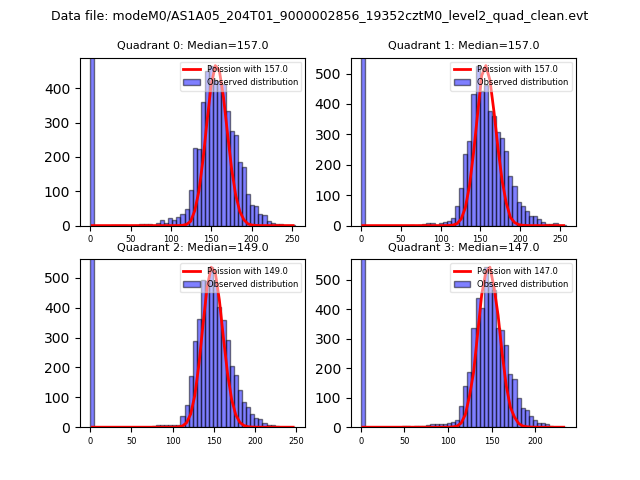 |
 |
| Quadrant-wise count rates Data is divided into 100 sec bins |
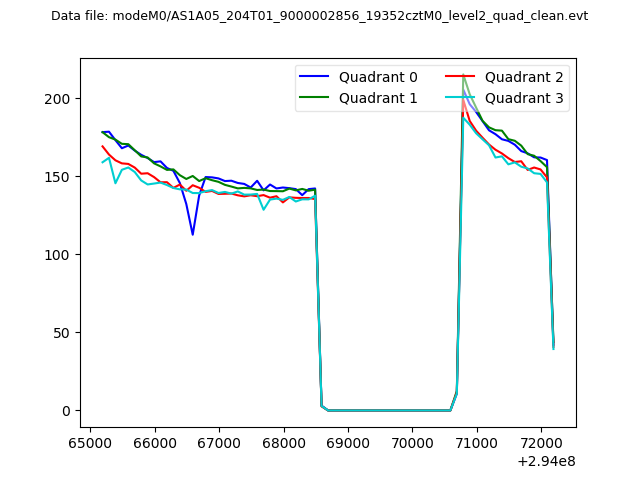 |
|
| Module-wise count rates for Quadrant A Data is divided into 100 sec bins |
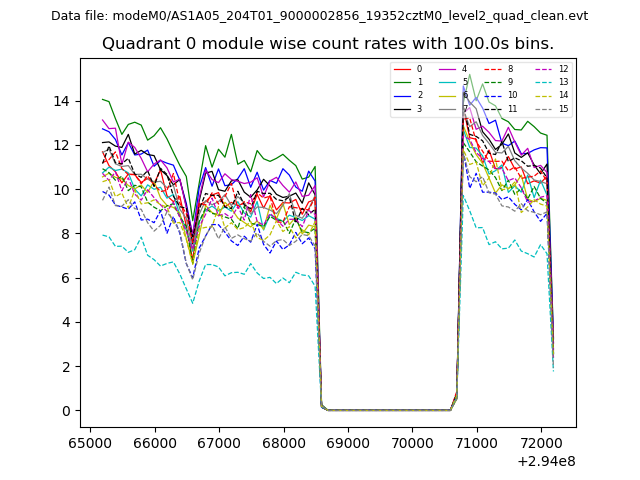 |
 |
| Module-wise count rates for Quadrant B Data is divided into 100 sec bins |
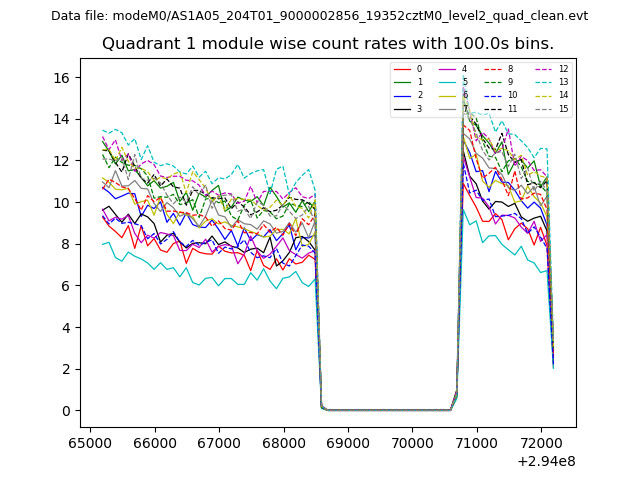 |
 |
| Module-wise count rates for Quadrant C Data is divided into 100 sec bins |
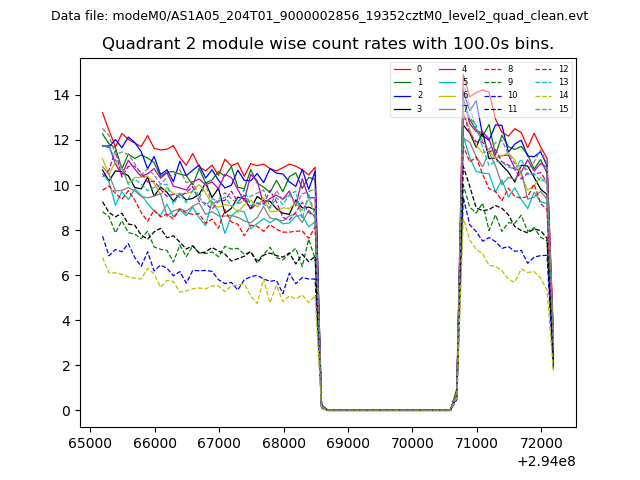 |
 |
| Module-wise count rates for Quadrant D Data is divided into 100 sec bins |
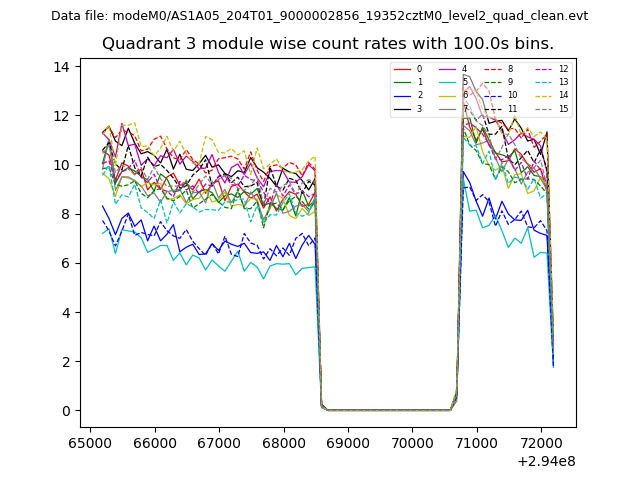 |
 |
| Parameter | Plot |
|---|---|
| CZT HV Monitor | 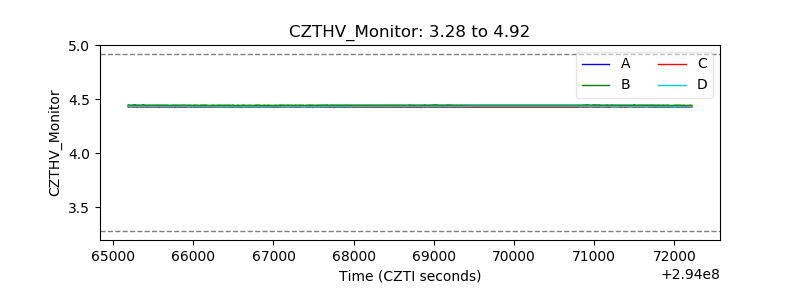 |
| D_VDD | 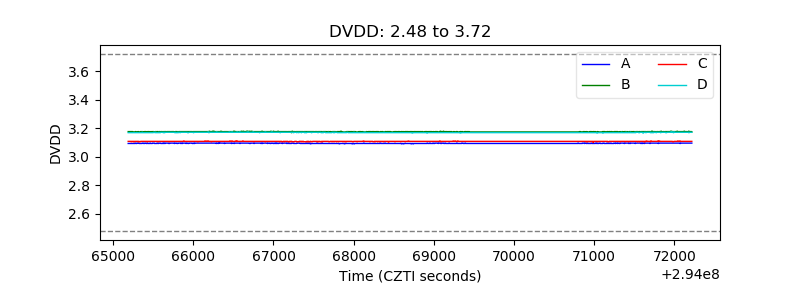 |
| Temperature 1 | 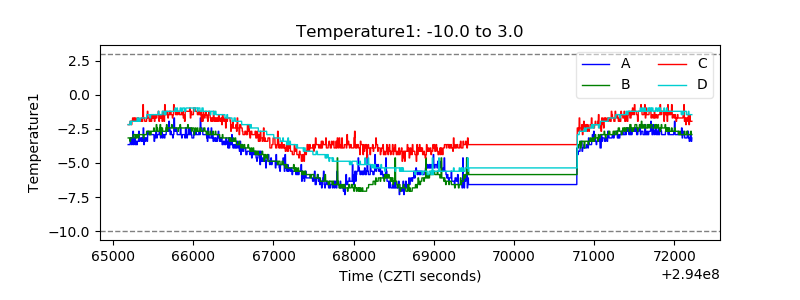 |
| Veto HV Monitor |  |
| Veto LLD | 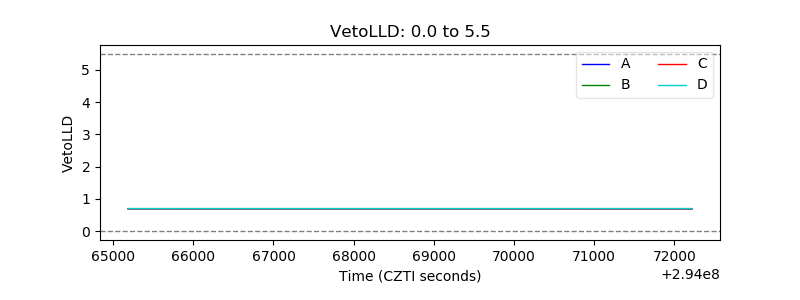 |
| Alpha Counter | 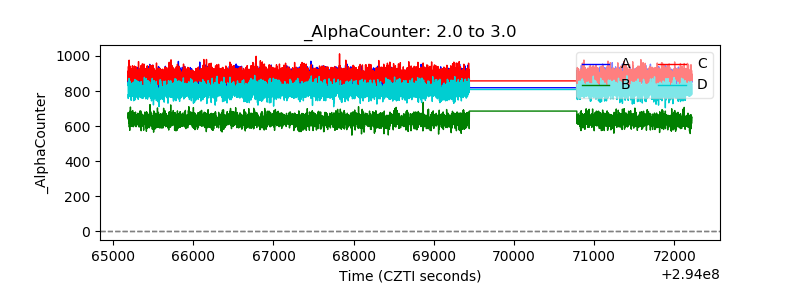 |
| _CPM_Rate | 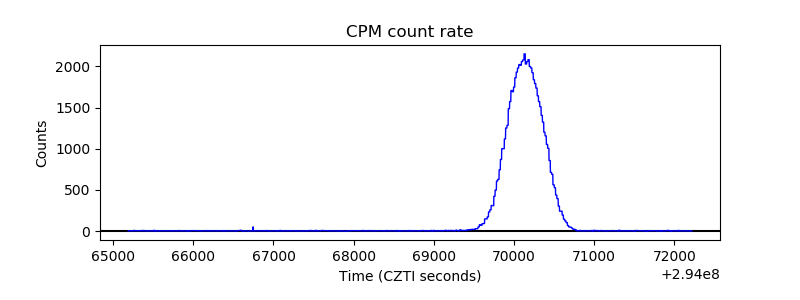 |
| CZT Counter | 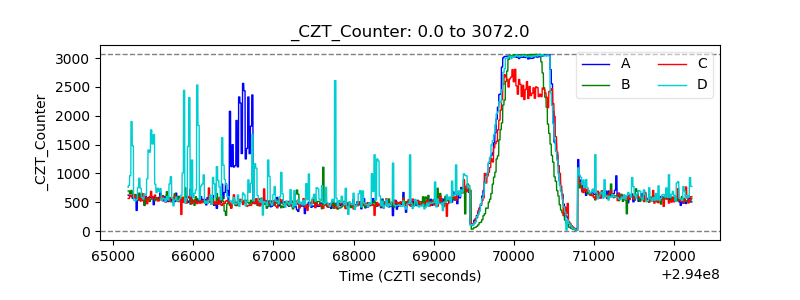 |
| +2.5 Volts monitor | 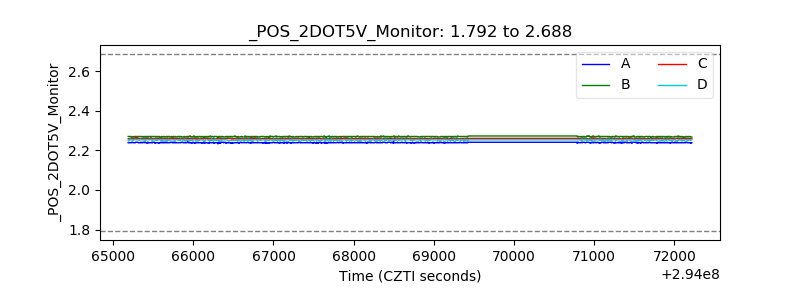 |
| +5 Volts monitor | 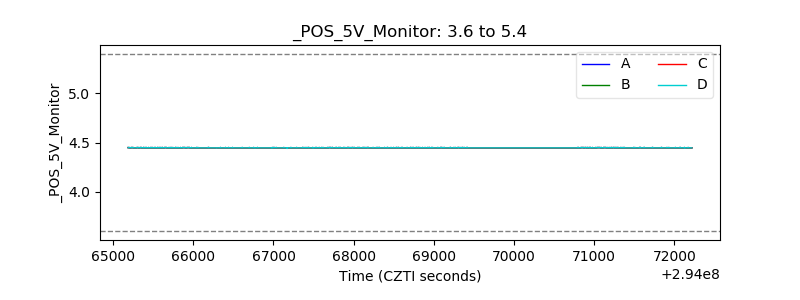 |
| _ROLL_ROT | 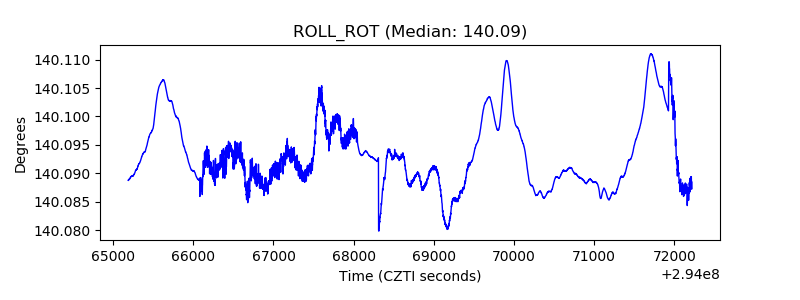 |
| _Roll_DEC | 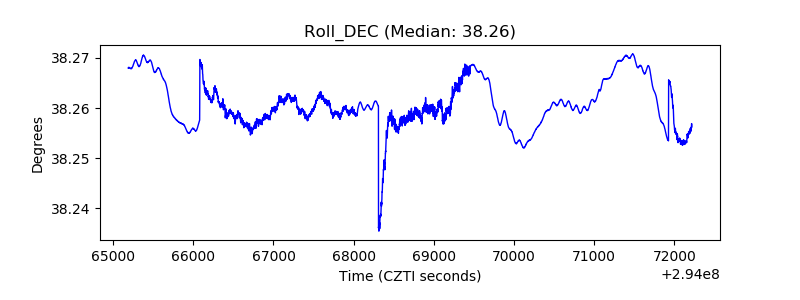 |
| _Roll_RA |  |
| Veto Counter | 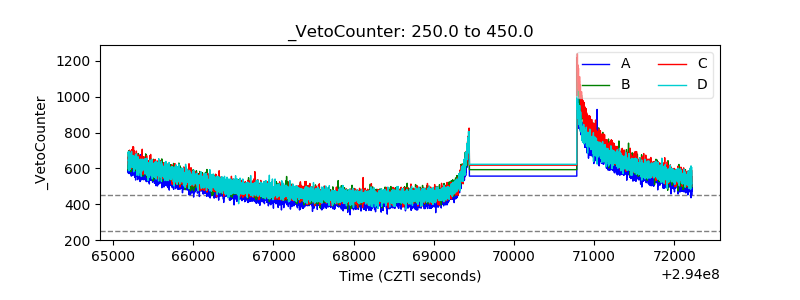 |