| Param | Original file | Final file |
|---|---|---|
| Filename | modeM0/AS1A05_204T01_9000002856_19353cztM0_level2.evt | modeM0/AS1A05_204T01_9000002856_19353cztM0_level2_quad_clean.evt |
| Size (bytes) | 504,109,440 | 118,272,960 |
| Size | 480.8 MB | 112.8 MB |
| Events in quadrant A | 3,399,139 | 810,006 |
| Events in quadrant B | 3,491,227 | 810,603 |
| Events in quadrant C | 3,415,258 | 770,947 |
| Events in quadrant D | 4,524,829 | 741,912 |
| Mode M0 | |||
|---|---|---|---|
| Quadrant | BADHDUFLAG | Total packets | Discarded packets |
| A | 0 | 14168 | 2 |
| B | 0 | 14456 | 6 |
| C | 0 | 14127 | 2 |
| D | 0 | 17857 | 2 |
| Mode M9 | |||
|---|---|---|---|
| Quadrant | BADHDUFLAG | Total packets | Discarded packets |
| A | 0 | 13 | 0 |
| B | 0 | 14 | 0 |
| C | 0 | 14 | 0 |
| D | 0 | 14 | 0 |
| Mode SS | |||
|---|---|---|---|
| Quadrant | BADHDUFLAG | Total packets | Discarded packets |
| A | 0 | 132 | 0 |
| B | 0 | 132 | 0 |
| C | 0 | 132 | 0 |
| D | 0 | 132 | 0 |
| Quadrant | Total seconds | Saturated seconds | Saturation percentage |
|---|---|---|---|
| A | 6425 | 134 | 2.085603% |
| B | 6424 | 139 | 2.163761% |
| C | 6424 | 163 | 2.537360% |
| D | 6424 | 437 | 6.802615% |
Noise dominated data is calculated using 1-second bins in cleaned event files. If a bin has >2000 counts, and if more than 50% of those come from <1% of pixels, then it is considered to be noise-dominated and hence unusable.
| Quadrant | # 1 sec bins | Bins with >0 counts | Bins with >2000 counts | High rate bins dominated by noise | Noise dominated (total time) | Noise dominated (detector-on time) | Marked lightcurve |
|---|---|---|---|---|---|---|---|
| A | 7710 | 6425 | 0 | 0 | 0.00% | 0.00% | 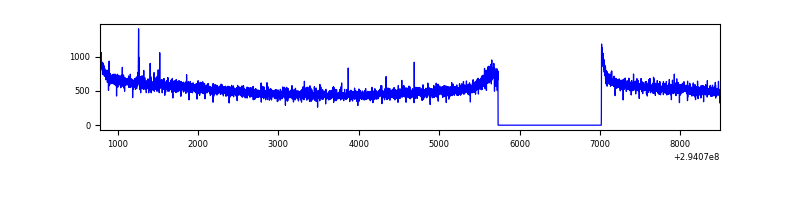 |
| B | 7709 | 6424 | 13 | 13 | 0.17% | 0.20% | 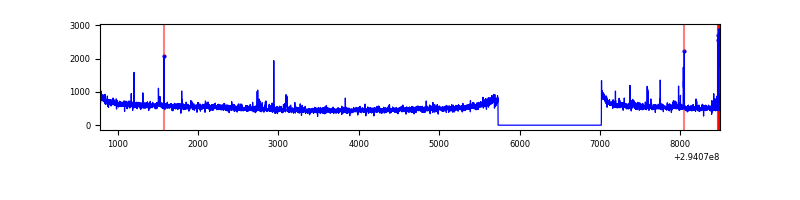 |
| C | 7709 | 6424 | 3 | 3 | 0.04% | 0.05% | 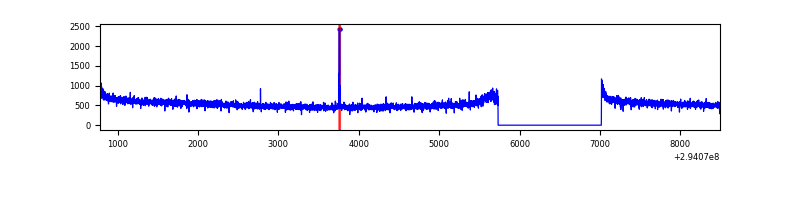 |
| D | 7709 | 6424 | 262 | 262 | 3.40% | 4.08% | 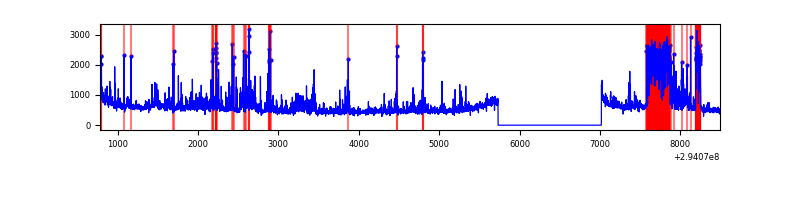 |
Top three noisy pixels from each quadrant. If the there are fewer than three noisy pixels in the level2.evt file, extra rows are filled as -1
| Pixel properties | Quadrant properties | ||||||
|---|---|---|---|---|---|---|---|
| Quadrant | DetID | PixID | Counts | Sigma | Mean | Median | Sigma |
| A | 8 | 205 | 8173 | 41.8 | 879 | 864 | 174.9 |
| A | 13 | 254 | 7881 | 40.13 | 879 | 864 | 174.9 |
| A | 0 | 226 | 7806 | 39.7 | 879 | 864 | 174.9 |
| B | 0 | 229 | 45939 | 282.11 | 858 | 839 | 159.9 |
| B | 3 | 64 | 33774 | 206.01 | 858 | 839 | 159.9 |
| B | 0 | 190 | 21241 | 127.62 | 858 | 839 | 159.9 |
| C | 14 | 238 | 132577 | 680.83 | 836 | 846 | 193.5 |
| C | 9 | 54 | 13664 | 66.25 | 836 | 846 | 193.5 |
| C | 3 | 233 | 9968 | 47.15 | 836 | 846 | 193.5 |
| D | 10 | 66 | 673744 | 3298.54 | 845 | 824 | 204.0 |
| D | 7 | 238 | 447723 | 2190.62 | 845 | 824 | 204.0 |
| D | 11 | 176 | 89539 | 434.87 | 845 | 824 | 204.0 |
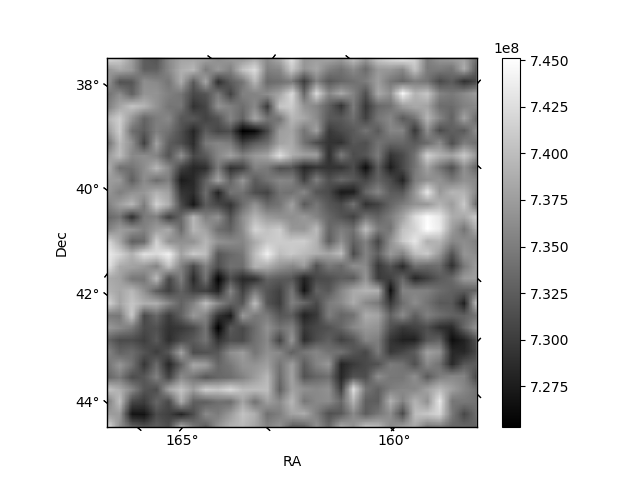
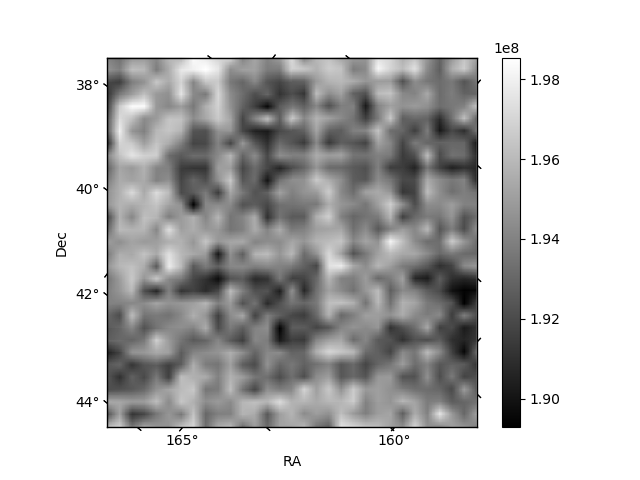
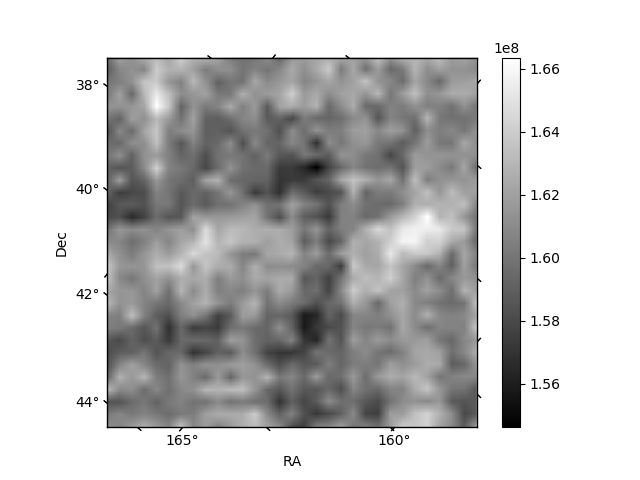
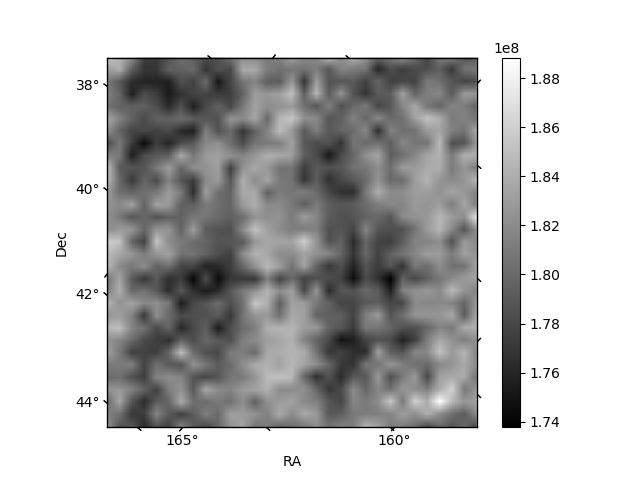
Histogram calculated using DETX and DETY for each event in the final _common_clean file
| Quadrant A | 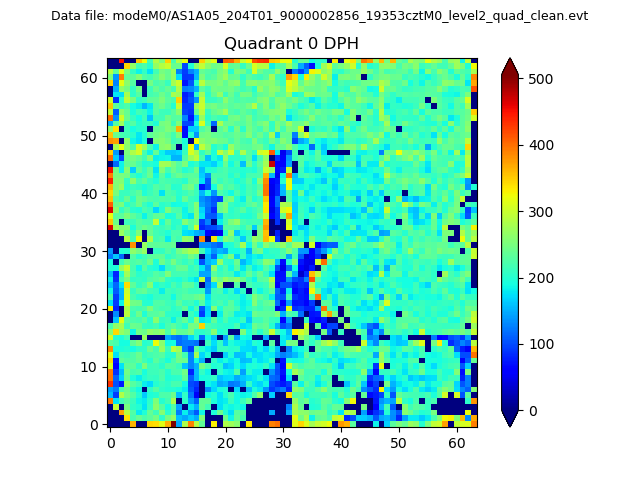 |
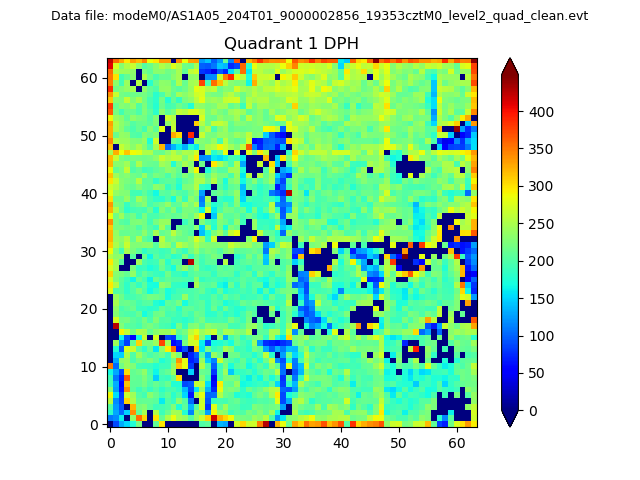 |
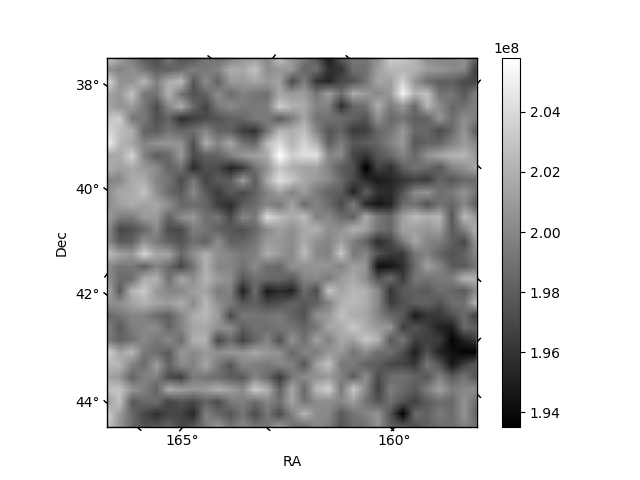
Quadrant B |
|---|---|---|---|
| Quadrant D | 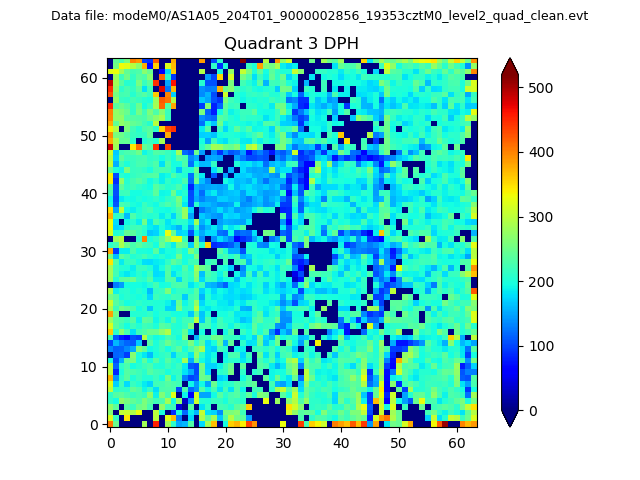 |
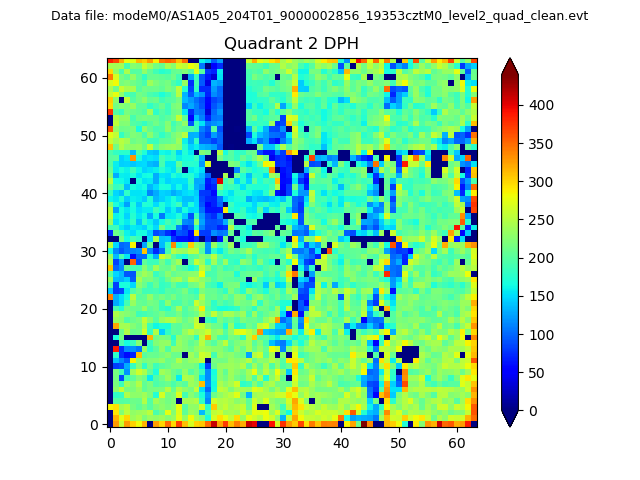 |
Quadrant C |
| Plot type | Count rate plots | Images |
|---|---|---|
| Comparison with Poisson distribution Blue bars denote a histogram of data divided into 1 sec bins. Red curve is a Poisson curve with rate = median count rate of data. |
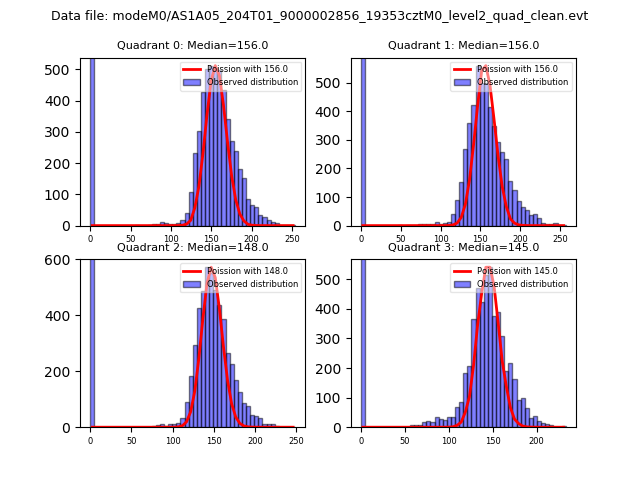 |
 |
| Quadrant-wise count rates Data is divided into 100 sec bins |
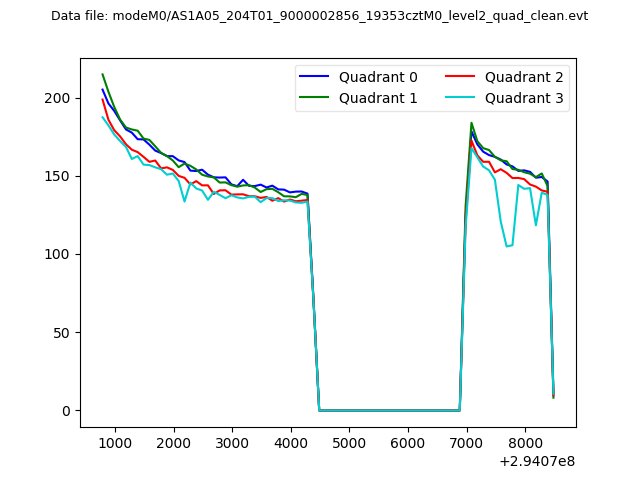 |
|
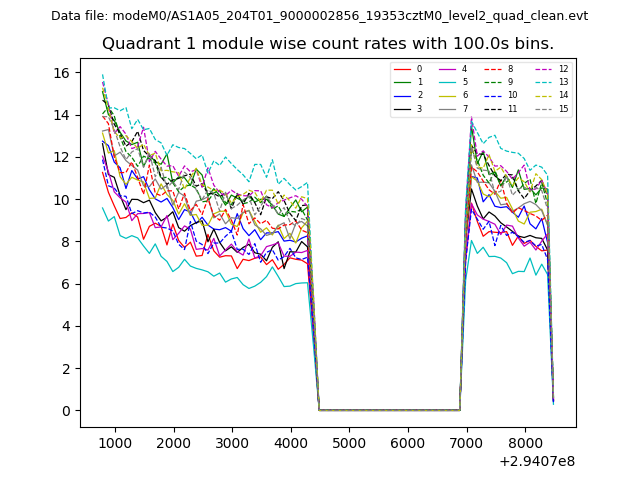
| Module-wise count rates for Quadrant A Data is divided into 100 sec bins |
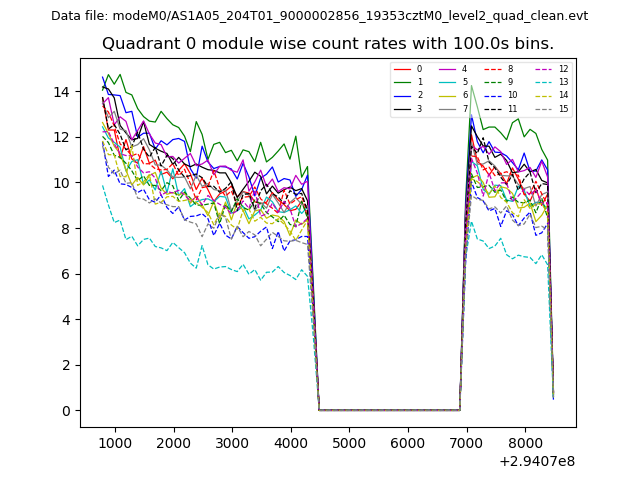 |
 |
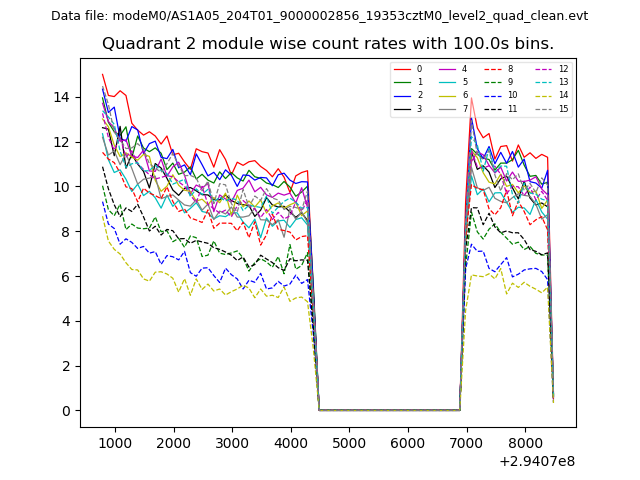
| Module-wise count rates for Quadrant B Data is divided into 100 sec bins |
 |
 |
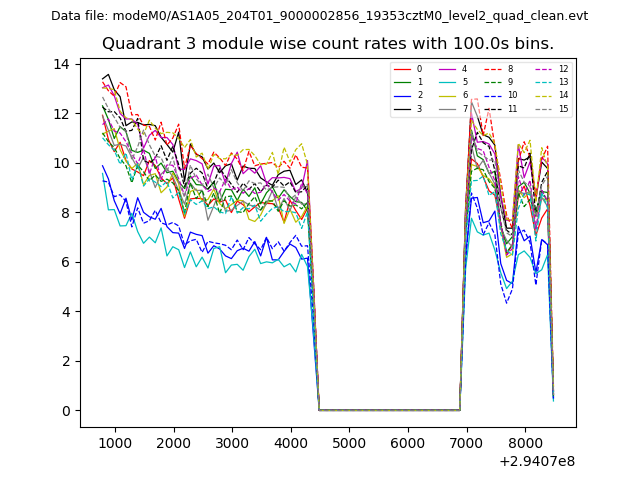
| Module-wise count rates for Quadrant C Data is divided into 100 sec bins |
 |
 |
| Module-wise count rates for Quadrant D Data is divided into 100 sec bins |
 |
 |
| Parameter | Plot |
|---|---|
| CZT HV Monitor | 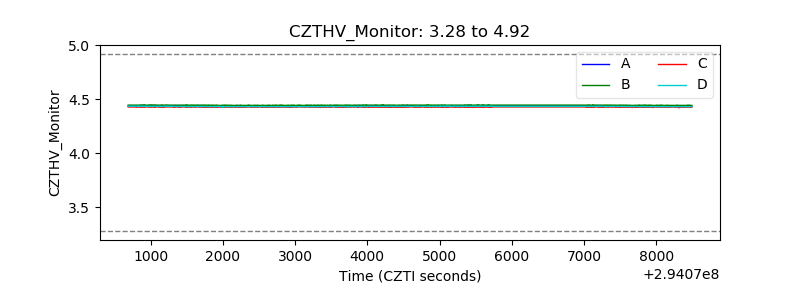 |
| D_VDD | 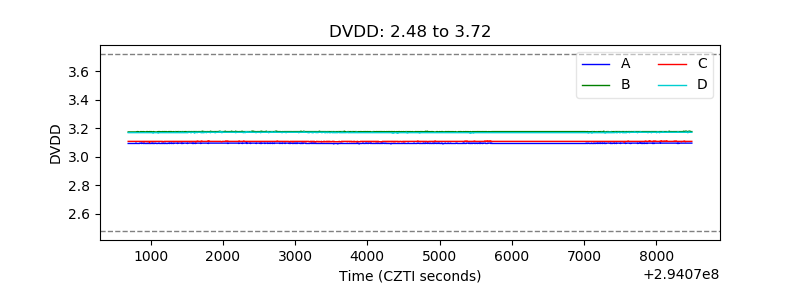 |
| Temperature 1 | 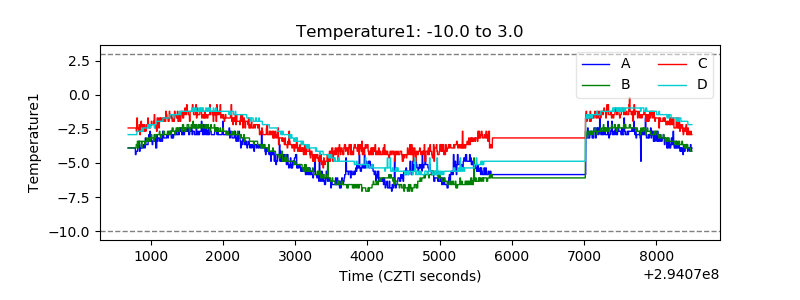 |
| Veto HV Monitor | 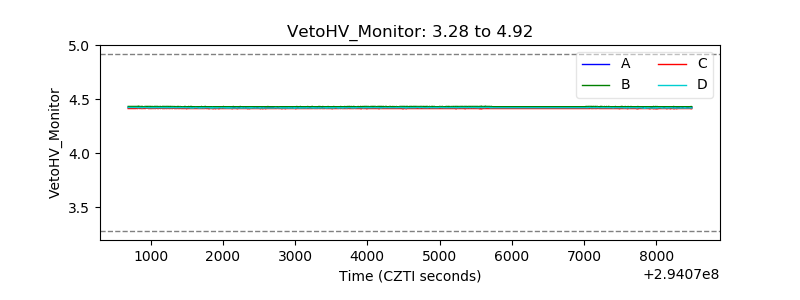 |
| Veto LLD |  |
| Alpha Counter | 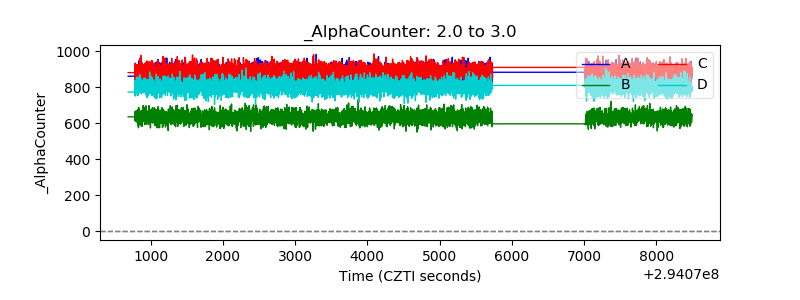 |
| _CPM_Rate | 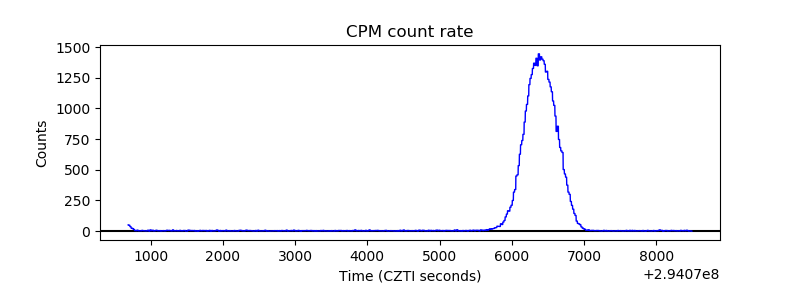 |
| CZT Counter | 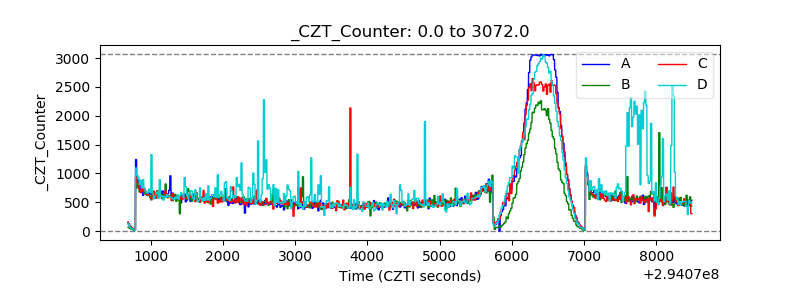 |
| +2.5 Volts monitor |  |
| +5 Volts monitor |  |
| _ROLL_ROT | 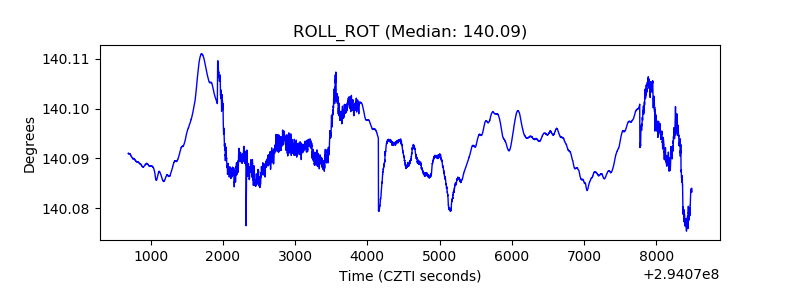 |
| _Roll_DEC | 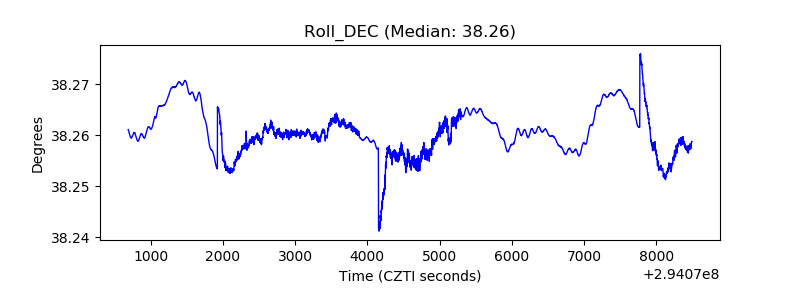 |
| _Roll_RA | 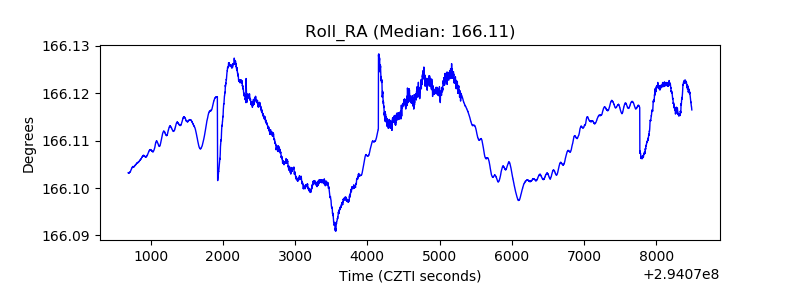 |
| Veto Counter | 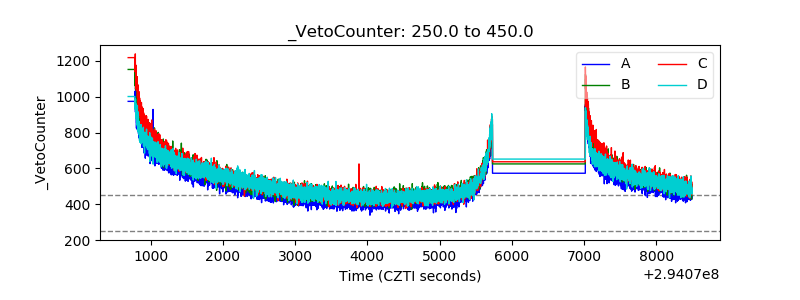 |