| Param | Original file | Final file |
|---|---|---|
| Filename | modeM0/AS1A05_204T01_9000002856_19354cztM0_level2.evt | modeM0/AS1A05_204T01_9000002856_19354cztM0_level2_quad_clean.evt |
| Size (bytes) | 512,248,320 | 99,483,840 |
| Size | 488.5 MB | 94.9 MB |
| Events in quadrant A | 3,218,830 | 669,371 |
| Events in quadrant B | 3,393,064 | 668,137 |
| Events in quadrant C | 3,255,754 | 641,683 |
| Events in quadrant D | 5,212,264 | 587,900 |
| Mode M0 | |||
|---|---|---|---|
| Quadrant | BADHDUFLAG | Total packets | Discarded packets |
| A | 0 | 13595 | 2 |
| B | 0 | 14160 | 2 |
| C | 0 | 13617 | 2 |
| D | 0 | 19901 | 2 |
| Mode M9 | |||
|---|---|---|---|
| Quadrant | BADHDUFLAG | Total packets | Discarded packets |
| A | 0 | 11 | 0 |
| B | 0 | 12 | 0 |
| C | 0 | 12 | 0 |
| D | 0 | 12 | 0 |
| Mode SS | |||
|---|---|---|---|
| Quadrant | BADHDUFLAG | Total packets | Discarded packets |
| A | 0 | 130 | 0 |
| B | 0 | 130 | 0 |
| C | 0 | 130 | 0 |
| D | 0 | 130 | 0 |
| Quadrant | Total seconds | Saturated seconds | Saturation percentage |
|---|---|---|---|
| A | 6385 | 80 | 1.252937% |
| B | 6385 | 118 | 1.848081% |
| C | 6385 | 137 | 2.145654% |
| D | 6385 | 675 | 10.571652% |
Noise dominated data is calculated using 1-second bins in cleaned event files. If a bin has >2000 counts, and if more than 50% of those come from <1% of pixels, then it is considered to be noise-dominated and hence unusable.
| Quadrant | # 1 sec bins | Bins with >0 counts | Bins with >2000 counts | High rate bins dominated by noise | Noise dominated (total time) | Noise dominated (detector-on time) | Marked lightcurve |
|---|---|---|---|---|---|---|---|
| A | 7540 | 6386 | 0 | 0 | 0.00% | 0.00% | 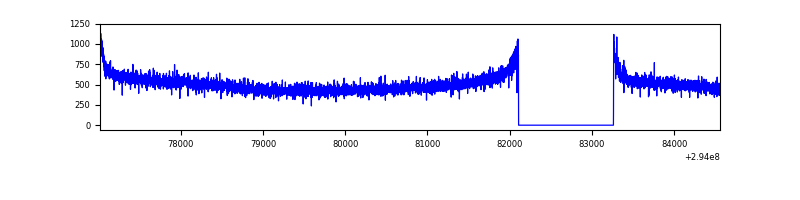 |
| B | 7540 | 6385 | 29 | 29 | 0.38% | 0.45% | 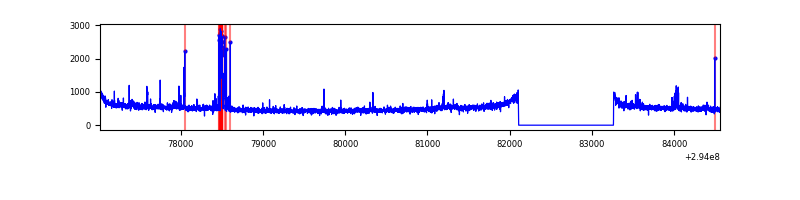 |
| C | 7540 | 6385 | 0 | 0 | 0.00% | 0.00% | 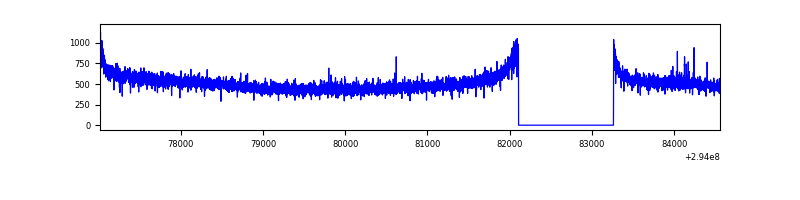 |
| D | 7540 | 6385 | 523 | 523 | 6.94% | 8.19% | 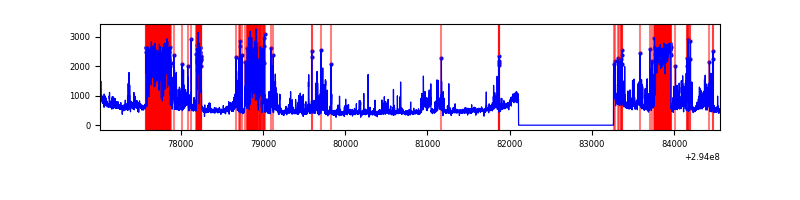 |
Top three noisy pixels from each quadrant. If the there are fewer than three noisy pixels in the level2.evt file, extra rows are filled as -1
| Pixel properties | Quadrant properties | ||||||
|---|---|---|---|---|---|---|---|
| Quadrant | DetID | PixID | Counts | Sigma | Mean | Median | Sigma |
| A | 13 | 254 | 8367 | 45.06 | 833 | 815 | 167.6 |
| A | 0 | 226 | 7324 | 38.83 | 833 | 815 | 167.6 |
| A | 3 | 137 | 6217 | 32.23 | 833 | 815 | 167.6 |
| B | 3 | 64 | 91361 | 588.88 | 819 | 798 | 153.8 |
| B | 0 | 190 | 35046 | 222.69 | 819 | 798 | 153.8 |
| B | 12 | 111 | 17946 | 111.5 | 819 | 798 | 153.8 |
| C | 14 | 238 | 125930 | 669.66 | 799 | 806 | 186.8 |
| C | 9 | 160 | 6153 | 28.62 | 799 | 806 | 186.8 |
| C | 13 | 61 | 5623 | 25.78 | 799 | 806 | 186.8 |
| D | 10 | 66 | 1182864 | 6263.2 | 783 | 764 | 188.7 |
| D | 7 | 238 | 771618 | 4084.27 | 783 | 764 | 188.7 |
| D | 11 | 176 | 137466 | 724.3 | 783 | 764 | 188.7 |
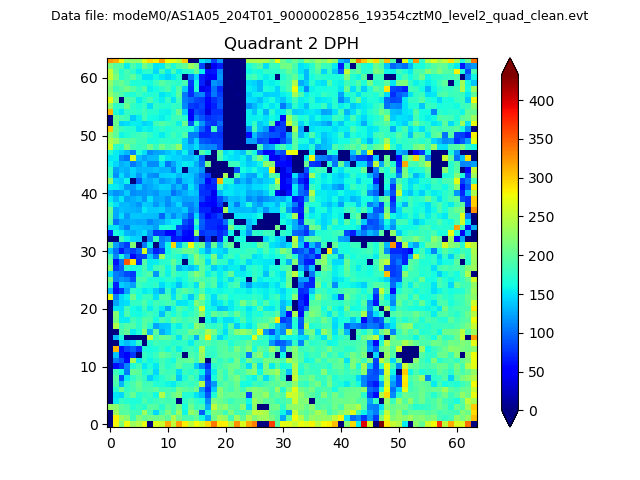
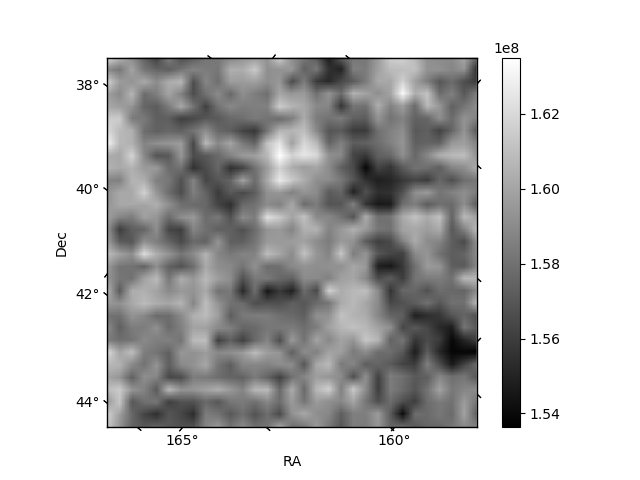
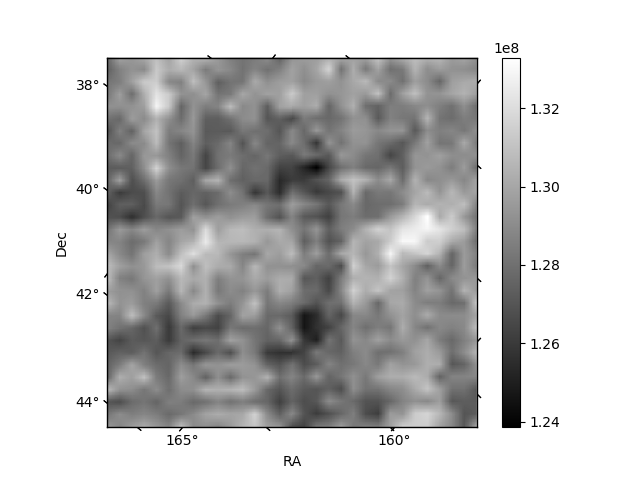
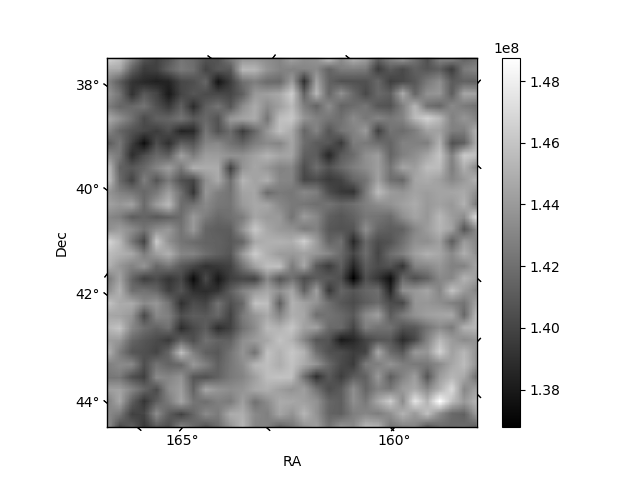
Histogram calculated using DETX and DETY for each event in the final _common_clean file
| Quadrant A | 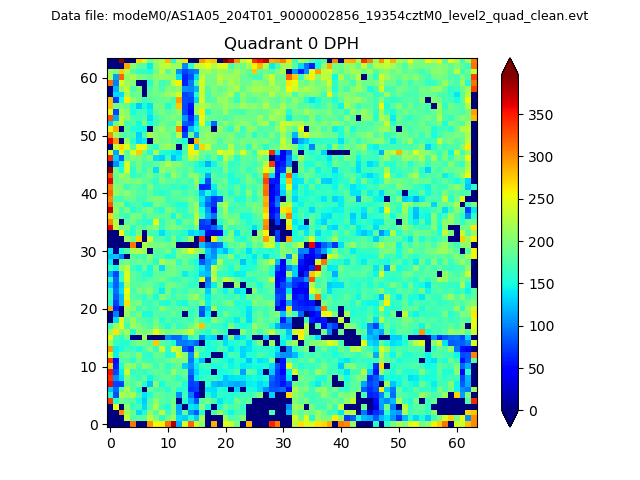 |
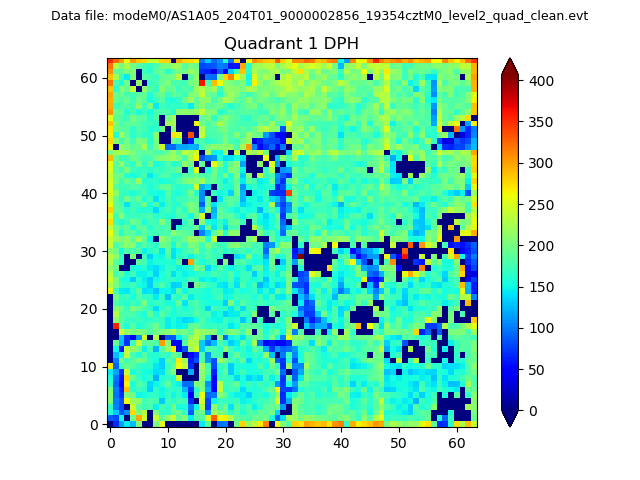 |
Quadrant B |
|---|---|---|---|
| Quadrant D | 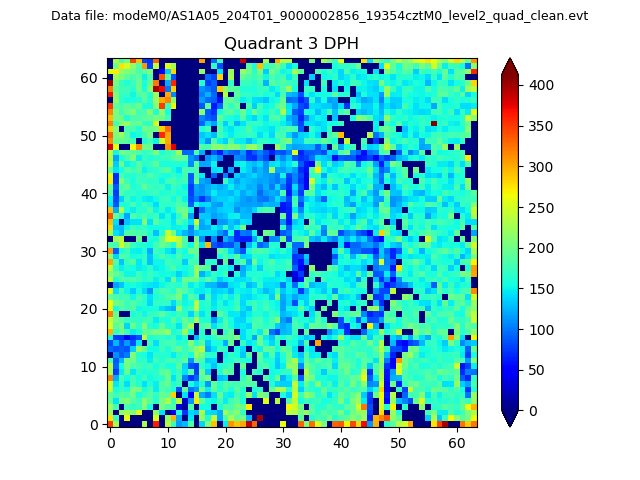 |
 |
Quadrant C |
| Plot type | Count rate plots | Images |
|---|---|---|
| Comparison with Poisson distribution Blue bars denote a histogram of data divided into 1 sec bins. Red curve is a Poisson curve with rate = median count rate of data. |
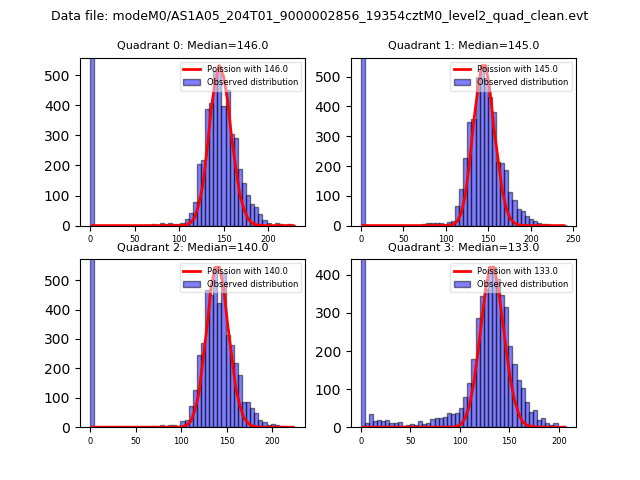 |
 |
| Quadrant-wise count rates Data is divided into 100 sec bins |
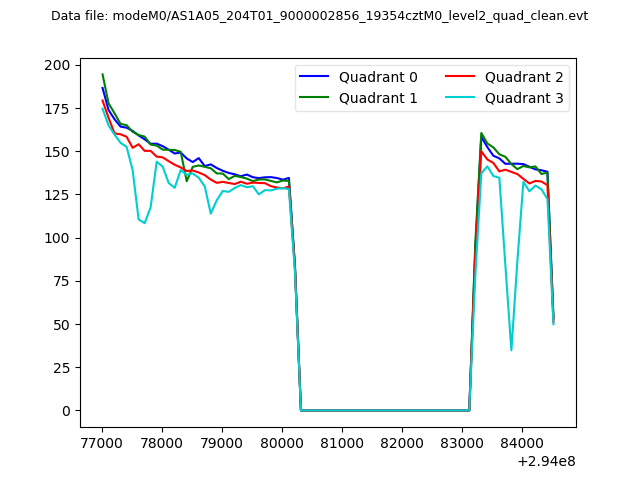 |
|
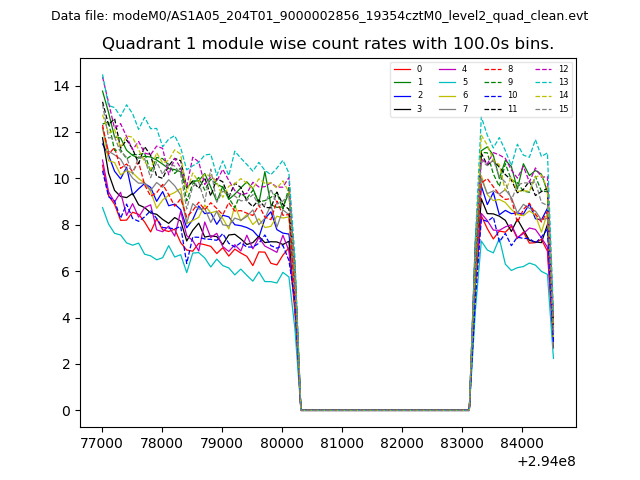
| Module-wise count rates for Quadrant A Data is divided into 100 sec bins |
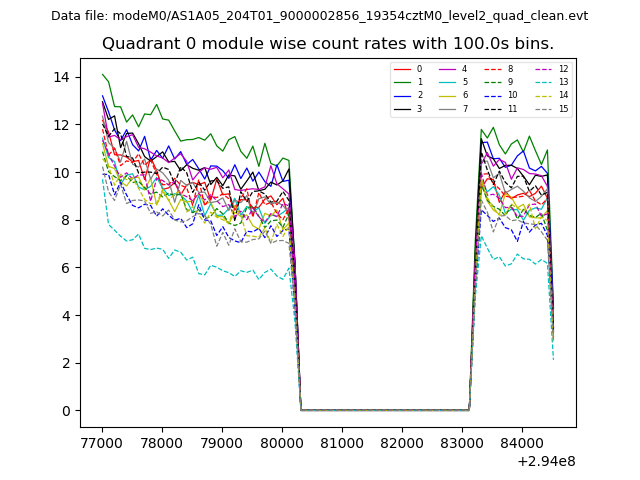 |
 |
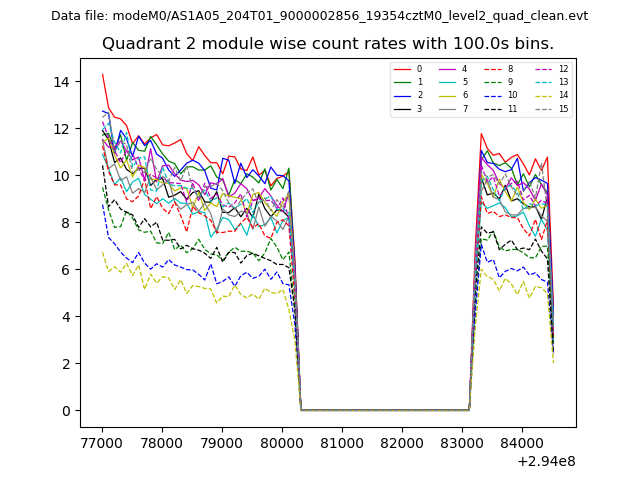
| Module-wise count rates for Quadrant B Data is divided into 100 sec bins |
 |
 |
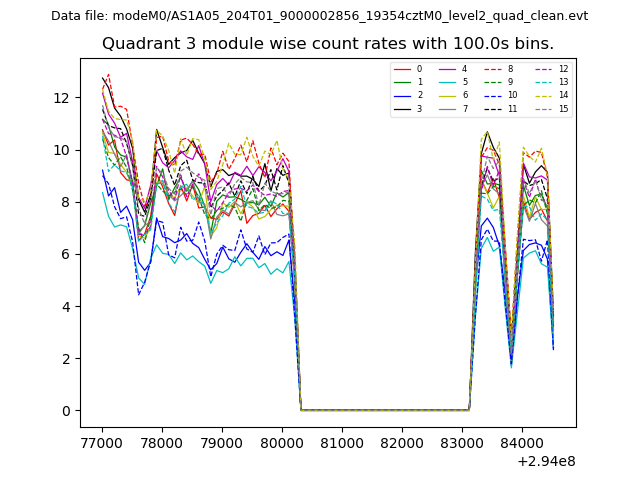
| Module-wise count rates for Quadrant C Data is divided into 100 sec bins |
 |
 |
| Module-wise count rates for Quadrant D Data is divided into 100 sec bins |
 |
 |
| Parameter | Plot |
|---|---|
| CZT HV Monitor | 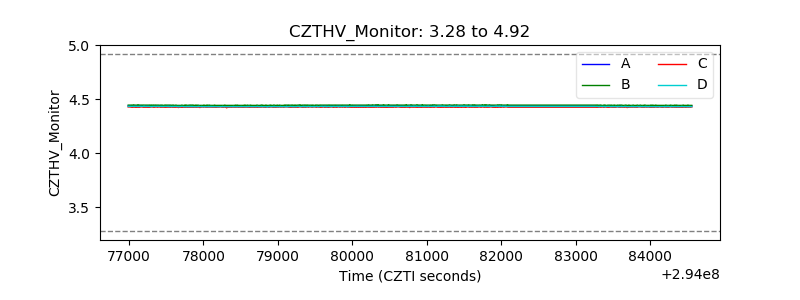 |
| D_VDD | 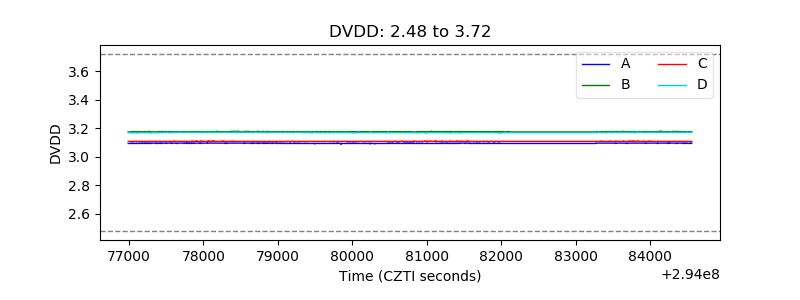 |
| Temperature 1 | 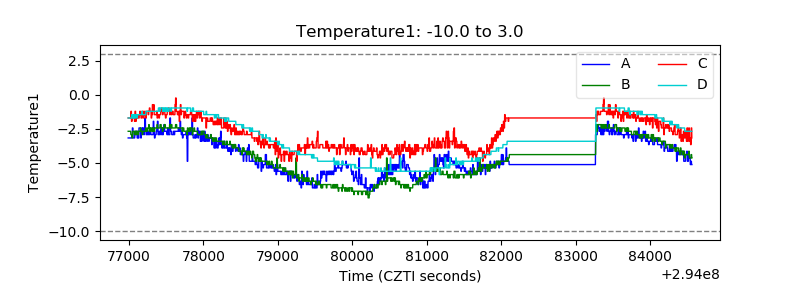 |
| Veto HV Monitor | 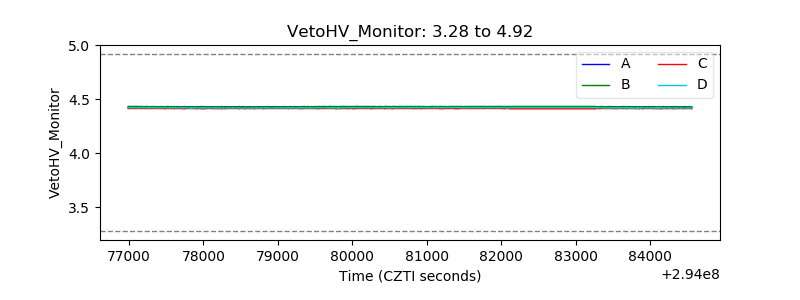 |
| Veto LLD | 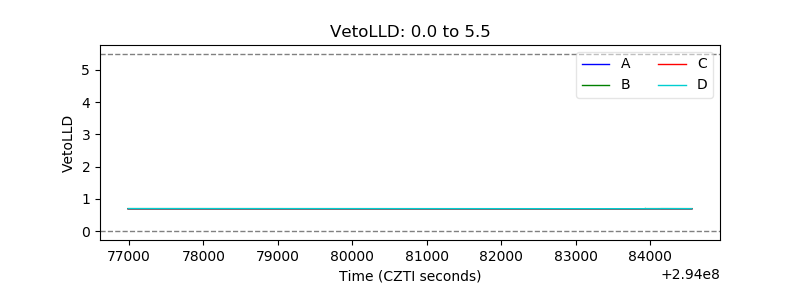 |
| Alpha Counter | 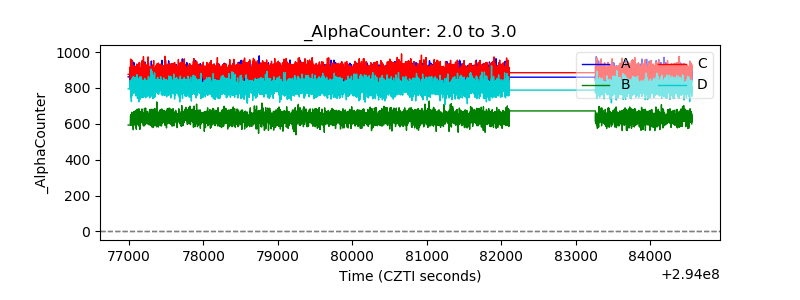 |
| _CPM_Rate | 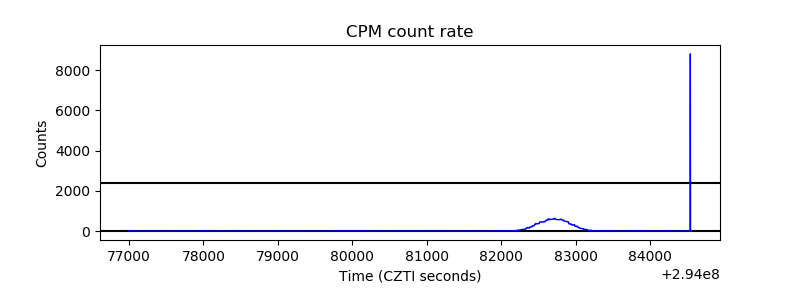 |
| CZT Counter | 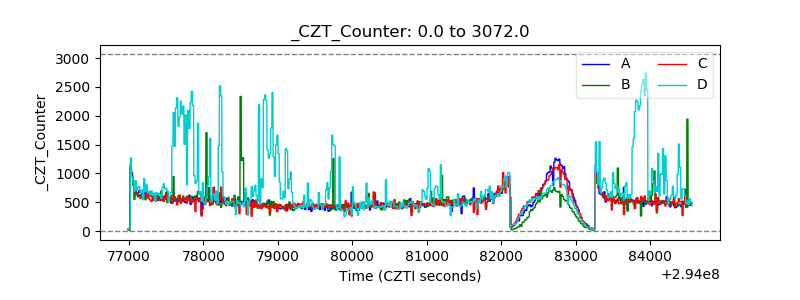 |
| +2.5 Volts monitor |  |
| +5 Volts monitor |  |
| _ROLL_ROT | 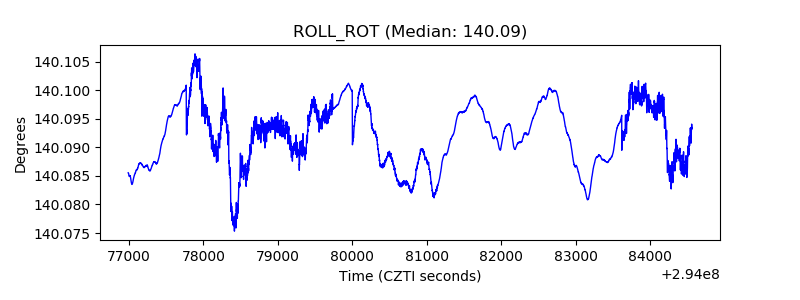 |
| _Roll_DEC | 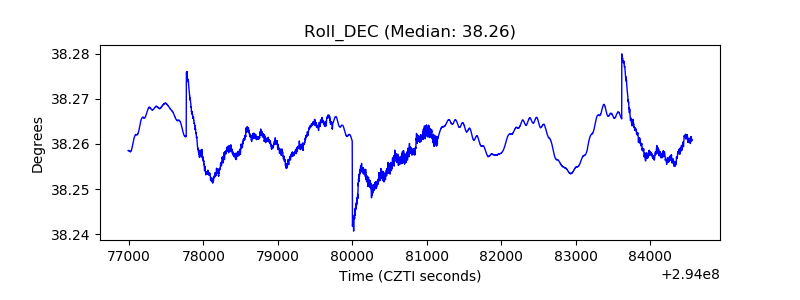 |
| _Roll_RA | 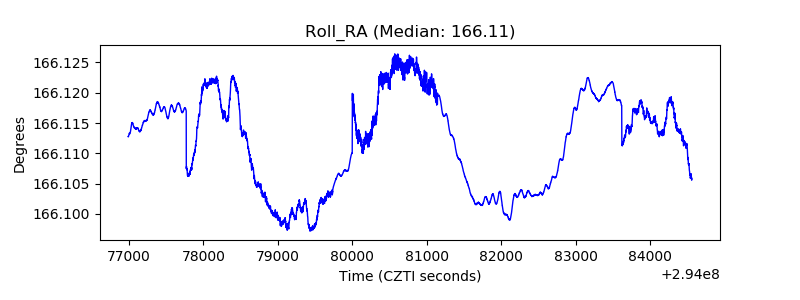 |
| Veto Counter | 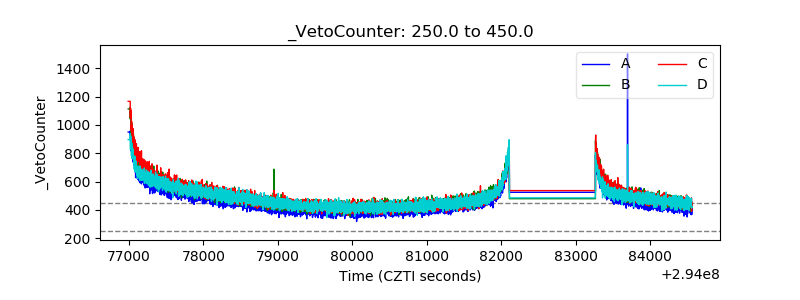 |