| Param | Original file | Final file |
|---|---|---|
| Filename | modeM0/AS1A05_204T01_9000002856_19356cztM0_level2.evt | modeM0/AS1A05_204T01_9000002856_19356cztM0_level2_quad_clean.evt |
| Size (bytes) | 572,469,120 | 100,428,480 |
| Size | 545.9 MB | 95.8 MB |
| Events in quadrant A | 3,388,357 | 660,298 |
| Events in quadrant B | 3,626,970 | 660,426 |
| Events in quadrant C | 3,416,818 | 636,897 |
| Events in quadrant D | 6,416,068 | 581,445 |
| Mode M0 | |||
|---|---|---|---|
| Quadrant | BADHDUFLAG | Total packets | Discarded packets |
| A | 0 | 14881 | 3 |
| B | 0 | 15529 | 2 |
| C | 0 | 14881 | 2 |
| D | 0 | 23942 | 2 |
| Mode M9 | |||
|---|---|---|---|
| Quadrant | BADHDUFLAG | Total packets | Discarded packets |
| A | 0 | 5 | 0 |
| B | 0 | 5 | 0 |
| C | 0 | 5 | 0 |
| D | 0 | 5 | 0 |
| Mode SS | |||
|---|---|---|---|
| Quadrant | BADHDUFLAG | Total packets | Discarded packets |
| A | 0 | 146 | 0 |
| B | 0 | 146 | 0 |
| C | 0 | 146 | 0 |
| D | 0 | 146 | 0 |
| Quadrant | Total seconds | Saturated seconds | Saturation percentage |
|---|---|---|---|
| A | 7209 | 23 | 0.319046% |
| B | 7210 | 66 | 0.915395% |
| C | 7210 | 72 | 0.998613% |
| D | 7210 | 916 | 12.704577% |
Noise dominated data is calculated using 1-second bins in cleaned event files. If a bin has >2000 counts, and if more than 50% of those come from <1% of pixels, then it is considered to be noise-dominated and hence unusable.
| Quadrant | # 1 sec bins | Bins with >0 counts | Bins with >2000 counts | High rate bins dominated by noise | Noise dominated (total time) | Noise dominated (detector-on time) | Marked lightcurve |
|---|---|---|---|---|---|---|---|
| A | 7639 | 7210 | 0 | 0 | 0.00% | 0.00% | 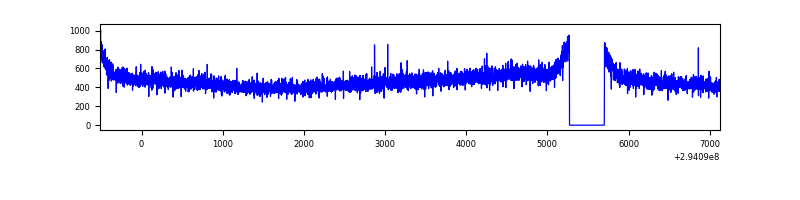 |
| B | 7640 | 7211 | 12 | 12 | 0.16% | 0.17% | 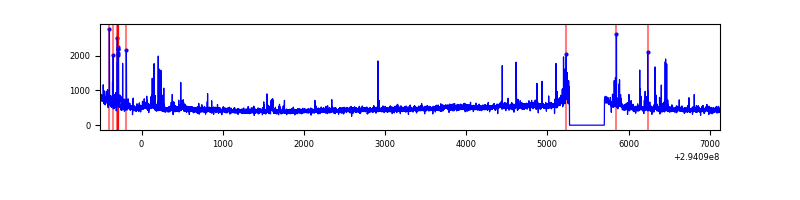 |
| C | 7640 | 7211 | 0 | 0 | 0.00% | 0.00% |  |
| D | 7640 | 7210 | 734 | 734 | 9.61% | 10.18% | 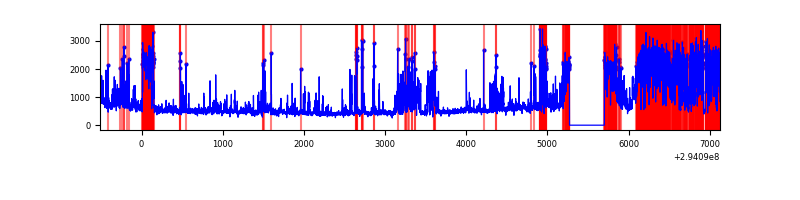 |
Top three noisy pixels from each quadrant. If the there are fewer than three noisy pixels in the level2.evt file, extra rows are filled as -1
| Pixel properties | Quadrant properties | ||||||
|---|---|---|---|---|---|---|---|
| Quadrant | DetID | PixID | Counts | Sigma | Mean | Median | Sigma |
| A | 14 | 111 | 12565 | 66.11 | 874 | 858 | 177.1 |
| A | 13 | 254 | 9592 | 49.32 | 874 | 858 | 177.1 |
| A | 0 | 226 | 7779 | 39.09 | 874 | 858 | 177.1 |
| B | 7 | 220 | 86018 | 508.09 | 869 | 844 | 167.6 |
| B | 15 | 32 | 52100 | 305.76 | 869 | 844 | 167.6 |
| B | 0 | 229 | 24835 | 143.11 | 869 | 844 | 167.6 |
| C | 14 | 238 | 129587 | 651.91 | 839 | 843 | 197.5 |
| C | 3 | 233 | 14181 | 67.54 | 839 | 843 | 197.5 |
| C | 13 | 61 | 5804 | 25.12 | 839 | 843 | 197.5 |
| D | 10 | 66 | 2008965 | 10152.63 | 815 | 793 | 197.8 |
| D | 7 | 238 | 554112 | 2797.39 | 815 | 793 | 197.8 |
| D | 11 | 176 | 470720 | 2375.79 | 815 | 793 | 197.8 |
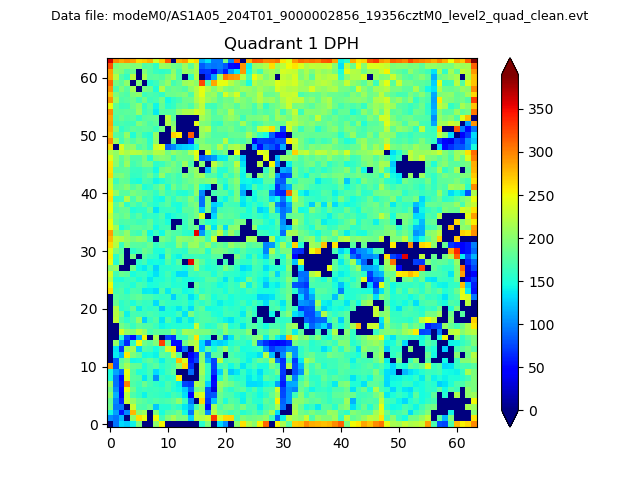
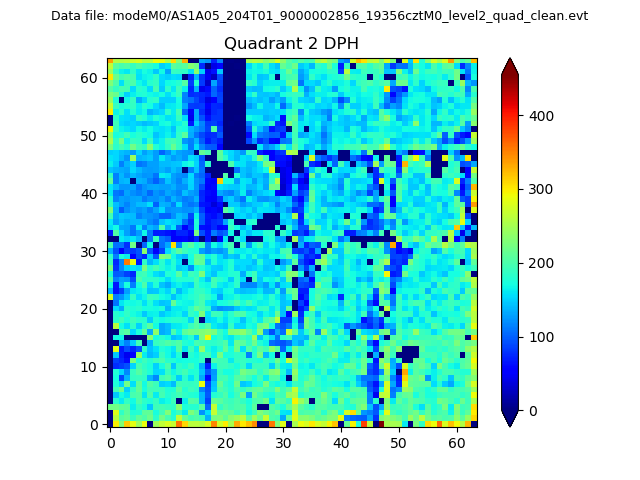
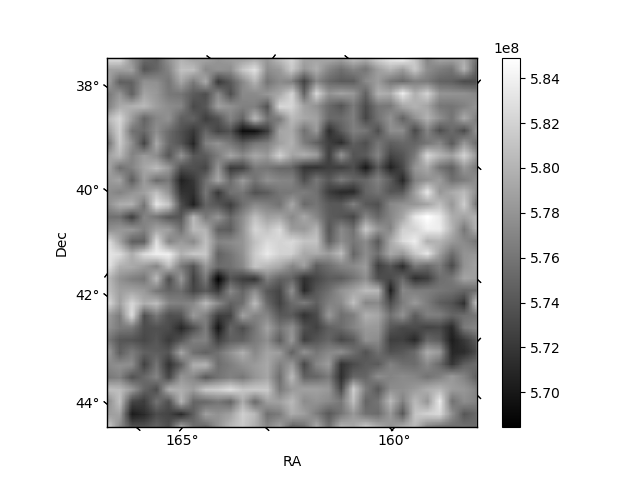
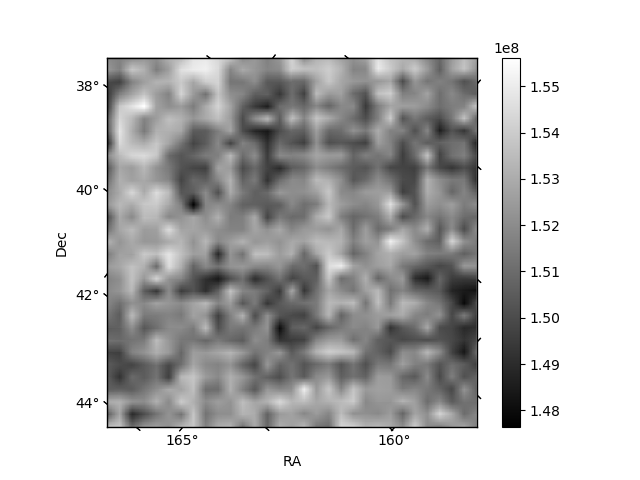
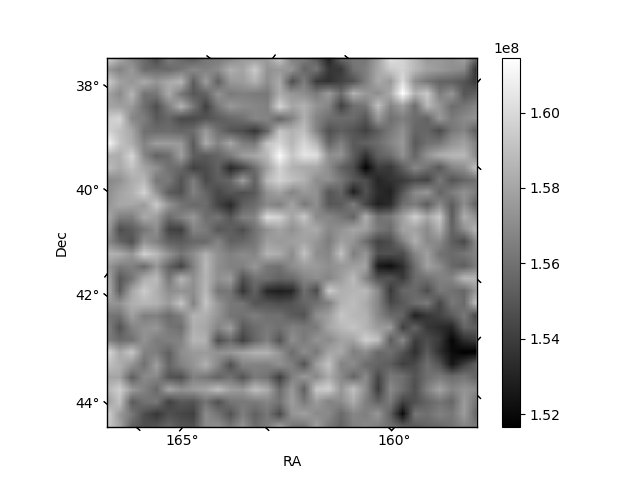
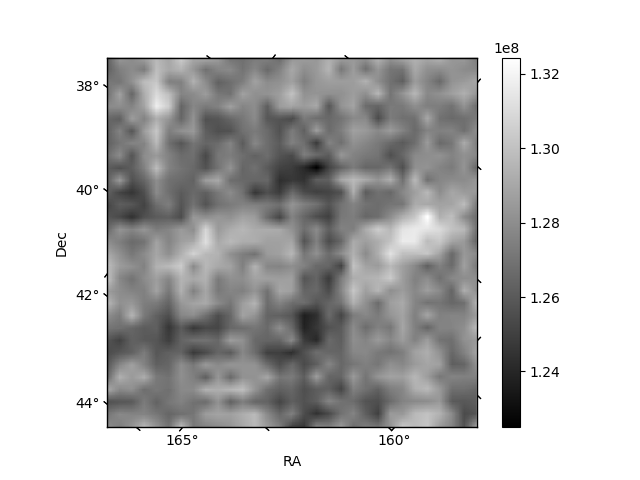
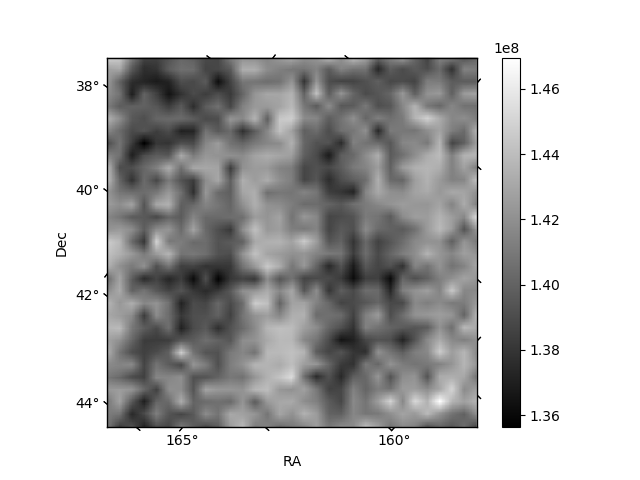
Histogram calculated using DETX and DETY for each event in the final _common_clean file
| Quadrant A | 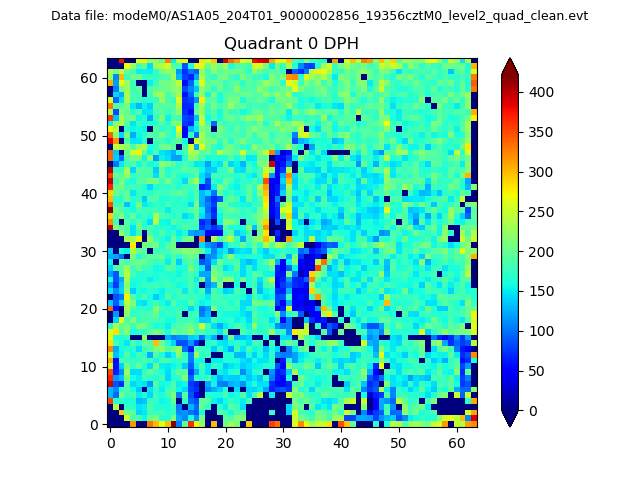 |
 |
Quadrant B |
|---|---|---|---|
| Quadrant D | 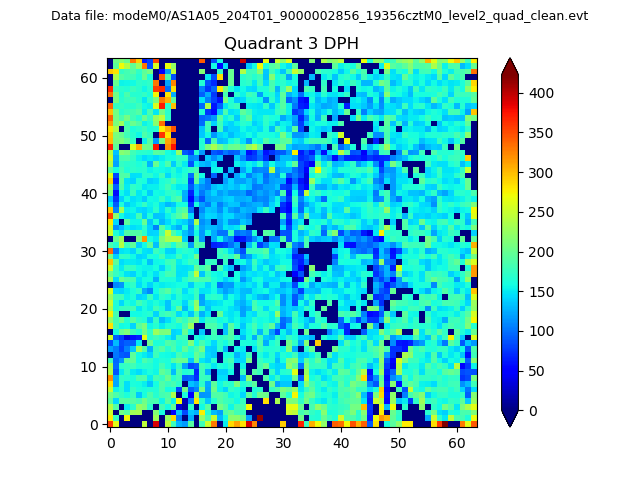 |
 |
Quadrant C |
| Plot type | Count rate plots | Images |
|---|---|---|
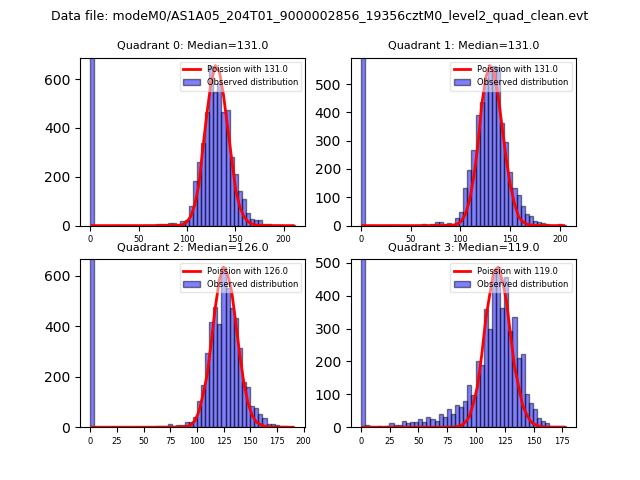
| Comparison with Poisson distribution Blue bars denote a histogram of data divided into 1 sec bins. Red curve is a Poisson curve with rate = median count rate of data. |
 |
 |
| Quadrant-wise count rates Data is divided into 100 sec bins |
 |
|
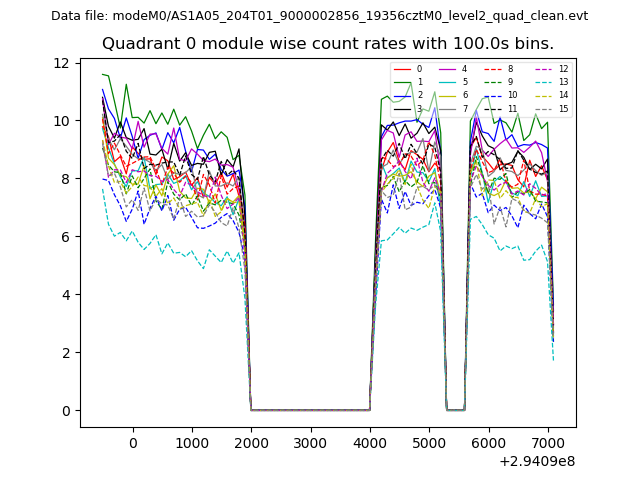
| Module-wise count rates for Quadrant A Data is divided into 100 sec bins |
 |
 |
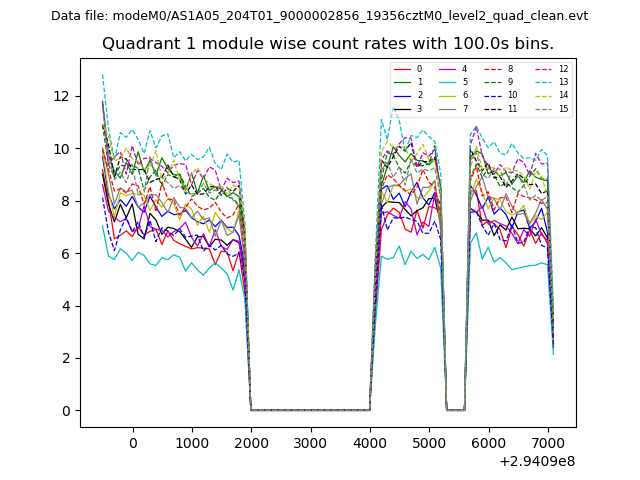
| Module-wise count rates for Quadrant B Data is divided into 100 sec bins |
 |
 |
| Module-wise count rates for Quadrant C Data is divided into 100 sec bins |
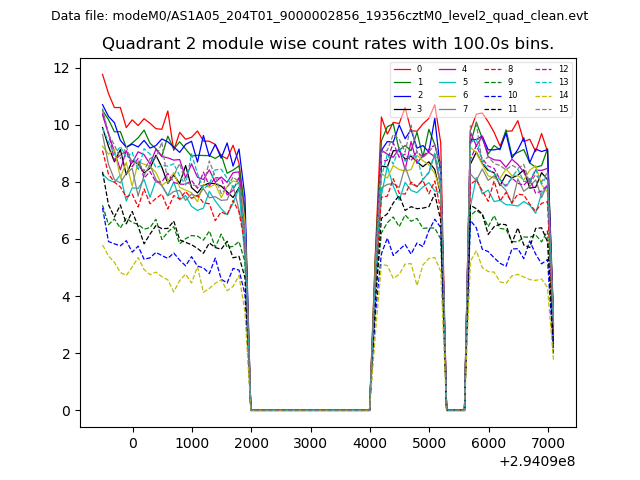 |
 |
| Module-wise count rates for Quadrant D Data is divided into 100 sec bins |
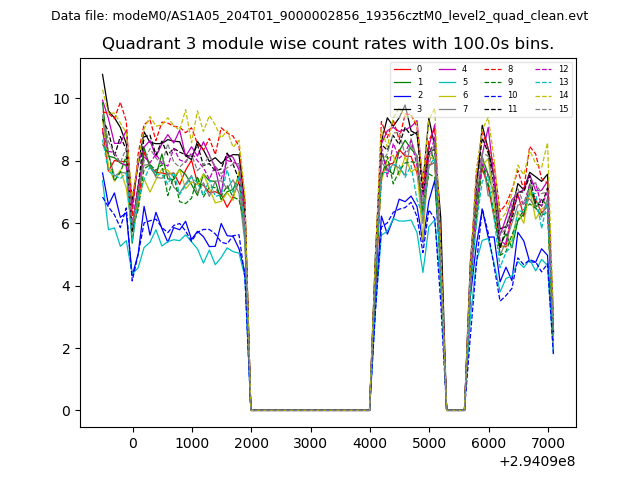 |
 |
| Parameter | Plot |
|---|---|
| CZT HV Monitor | 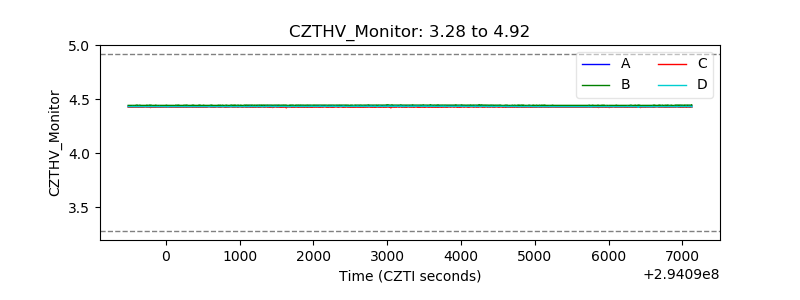 |
| D_VDD | 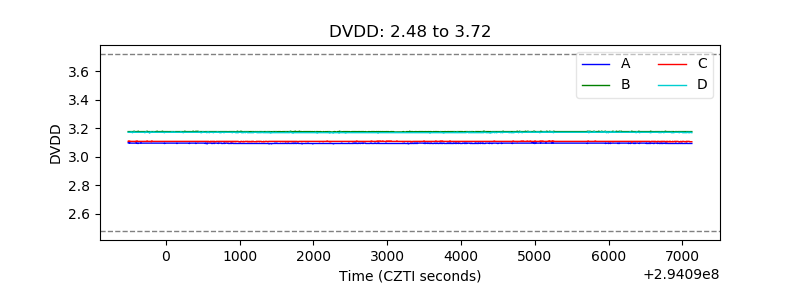 |
| Temperature 1 | 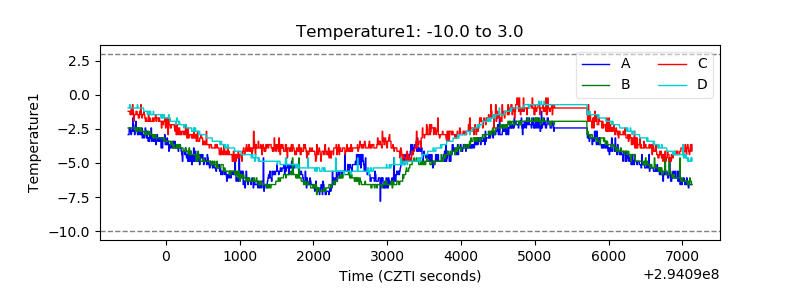 |
| Veto HV Monitor | 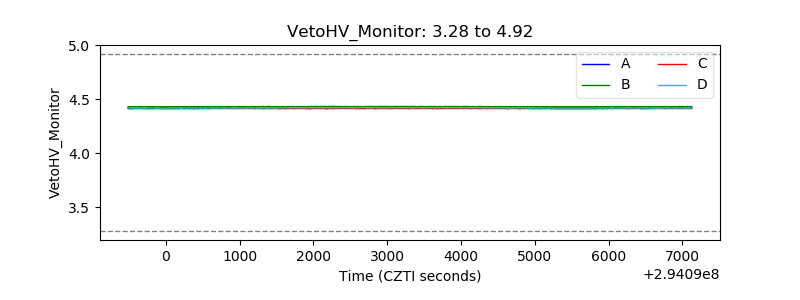 |
| Veto LLD | 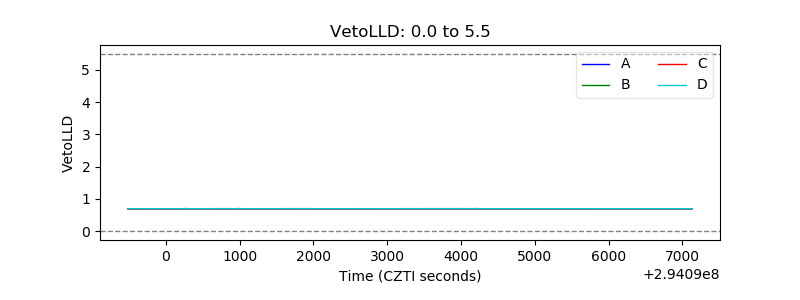 |
| Alpha Counter |  |
| _CPM_Rate | 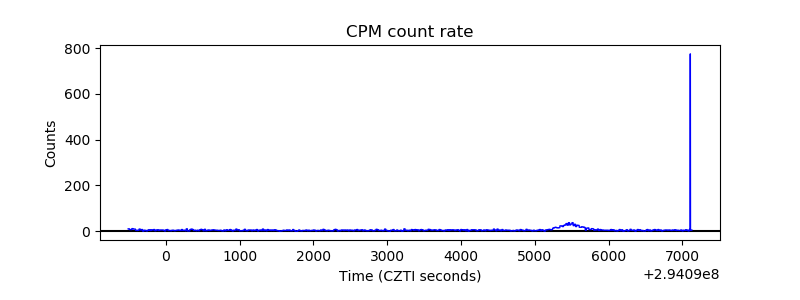 |
| CZT Counter | 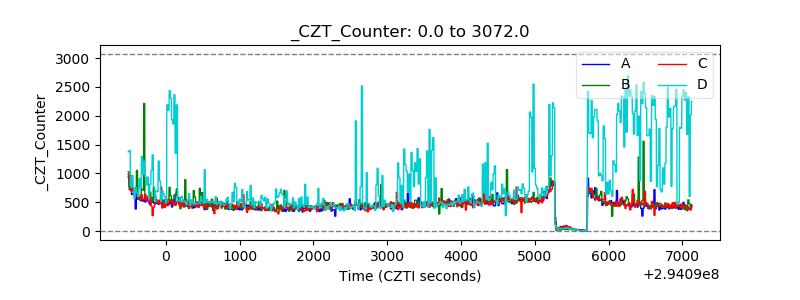 |
| +2.5 Volts monitor |  |
| +5 Volts monitor |  |
| _ROLL_ROT | 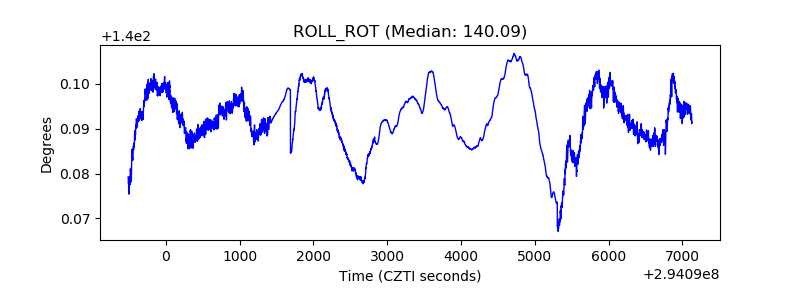 |
| _Roll_DEC | 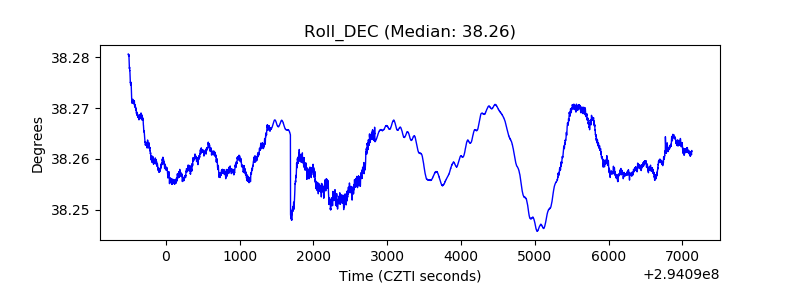 |
| _Roll_RA | 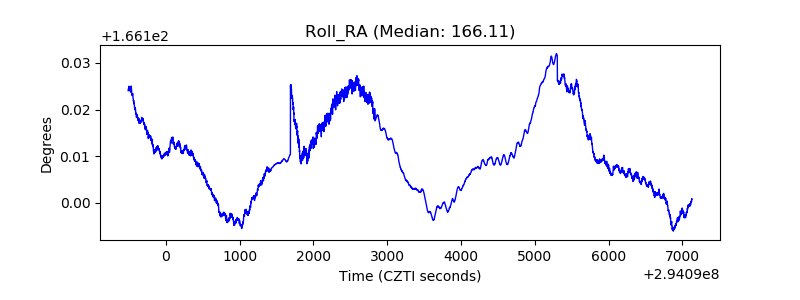 |
| Veto Counter | 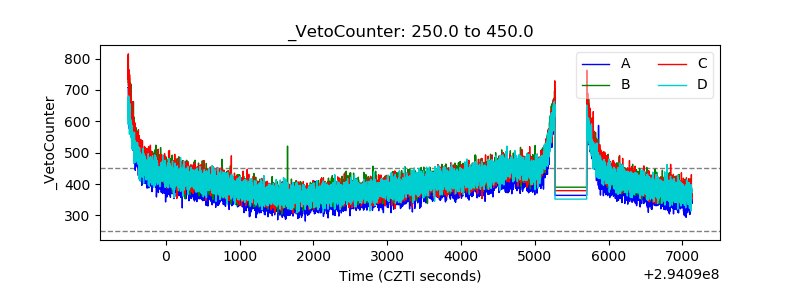 |