| Param | Original file | Final file |
|---|---|---|
| Filename | modeM0/AS1A05_204T01_9000002856_19357cztM0_level2.evt | modeM0/AS1A05_204T01_9000002856_19357cztM0_level2_quad_clean.evt |
| Size (bytes) | 660,150,720 | 104,837,760 |
| Size | 629.6 MB | 100.0 MB |
| Events in quadrant A | 3,460,960 | 690,094 |
| Events in quadrant B | 3,636,274 | 691,032 |
| Events in quadrant C | 3,568,063 | 666,879 |
| Events in quadrant D | 8,816,956 | 601,902 |
| Mode M0 | |||
|---|---|---|---|
| Quadrant | BADHDUFLAG | Total packets | Discarded packets |
| A | 0 | 15420 | 3 |
| B | 0 | 15792 | 3 |
| C | 0 | 15609 | 3 |
| D | 0 | 31357 | 3 |
| Mode M9 | |||
|---|---|---|---|
| Quadrant | BADHDUFLAG | Total packets | Discarded packets |
| A | 0 | 1 | 0 |
| B | 0 | 1 | 0 |
| C | 0 | 1 | 0 |
| D | 0 | 1 | 0 |
| Mode SS | |||
|---|---|---|---|
| Quadrant | BADHDUFLAG | Total packets | Discarded packets |
| A | 0 | 156 | 0 |
| B | 0 | 156 | 0 |
| C | 0 | 156 | 0 |
| D | 0 | 156 | 0 |
| Quadrant | Total seconds | Saturated seconds | Saturation percentage |
|---|---|---|---|
| A | 7528 | 22 | 0.292242% |
| B | 7529 | 64 | 0.850046% |
| C | 7529 | 77 | 1.022712% |
| D | 7528 | 1294 | 17.189160% |
Noise dominated data is calculated using 1-second bins in cleaned event files. If a bin has >2000 counts, and if more than 50% of those come from <1% of pixels, then it is considered to be noise-dominated and hence unusable.
| Quadrant | # 1 sec bins | Bins with >0 counts | Bins with >2000 counts | High rate bins dominated by noise | Noise dominated (total time) | Noise dominated (detector-on time) | Marked lightcurve |
|---|---|---|---|---|---|---|---|
| A | 7763 | 7530 | 0 | 0 | 0.00% | 0.00% | 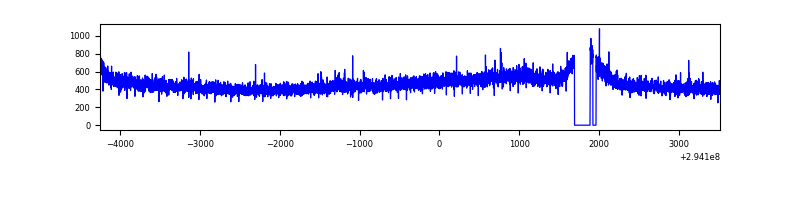 |
| B | 7764 | 7531 | 16 | 16 | 0.21% | 0.21% | 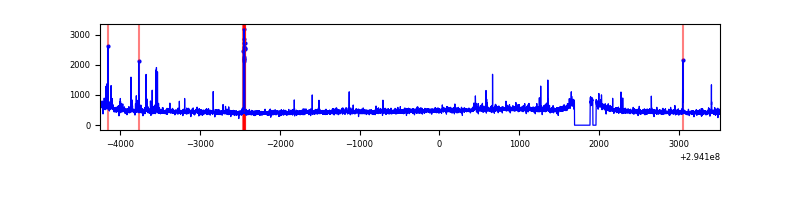 |
| C | 7764 | 7531 | 5 | 5 | 0.06% | 0.07% | 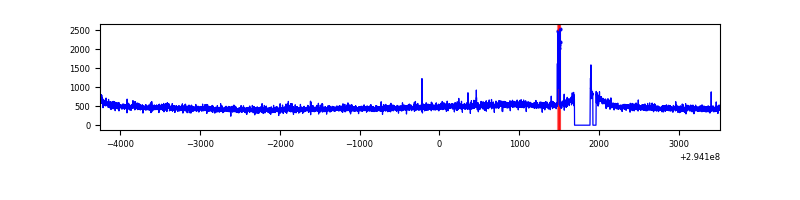 |
| D | 7763 | 7530 | 1315 | 1315 | 16.94% | 17.46% | 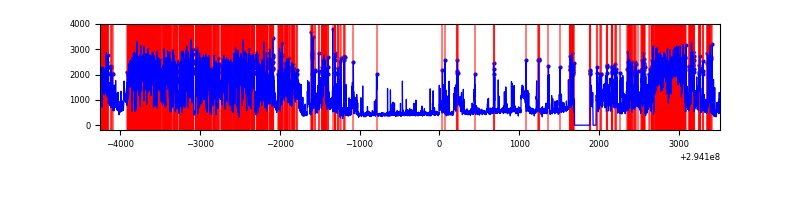 |
Top three noisy pixels from each quadrant. If the there are fewer than three noisy pixels in the level2.evt file, extra rows are filled as -1
| Pixel properties | Quadrant properties | ||||||
|---|---|---|---|---|---|---|---|
| Quadrant | DetID | PixID | Counts | Sigma | Mean | Median | Sigma |
| A | 13 | 254 | 10622 | 53.85 | 896 | 875 | 181.0 |
| A | 0 | 226 | 7882 | 38.71 | 896 | 875 | 181.0 |
| A | 3 | 137 | 7381 | 35.94 | 896 | 875 | 181.0 |
| B | 0 | 230 | 44611 | 256.62 | 892 | 869 | 170.5 |
| B | 15 | 32 | 34072 | 194.79 | 892 | 869 | 170.5 |
| B | 0 | 229 | 23130 | 130.6 | 892 | 869 | 170.5 |
| C | 14 | 238 | 134343 | 658.0 | 865 | 872 | 202.8 |
| C | 9 | 160 | 29923 | 143.22 | 865 | 872 | 202.8 |
| C | 9 | 176 | 14226 | 65.83 | 865 | 872 | 202.8 |
| D | 10 | 66 | 3722797 | 18148.18 | 835 | 810 | 205.1 |
| D | 7 | 238 | 1359909 | 6626.88 | 835 | 810 | 205.1 |
| D | 11 | 176 | 289811 | 1409.15 | 835 | 810 | 205.1 |
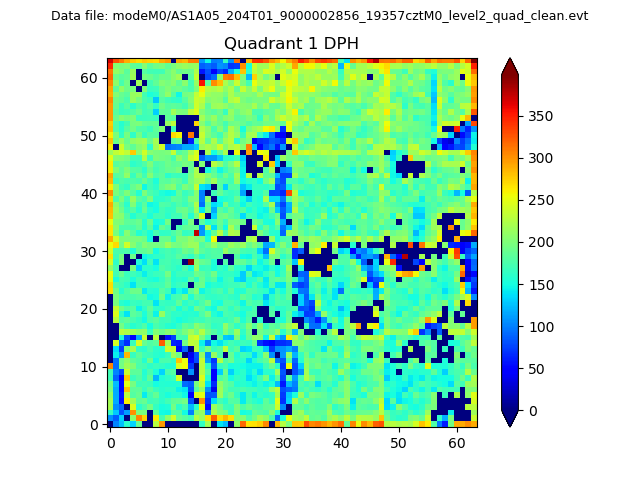
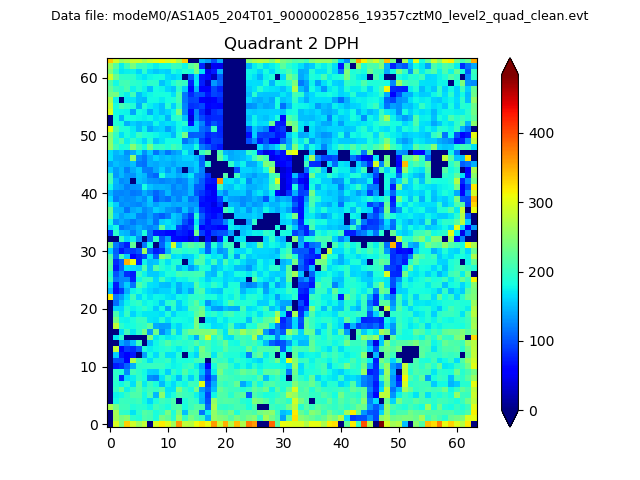
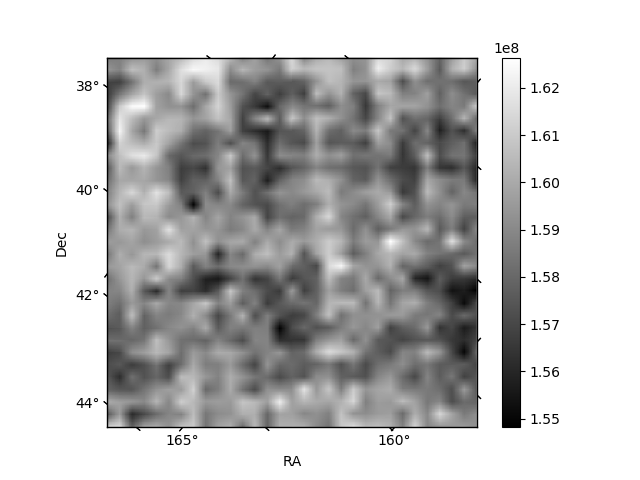
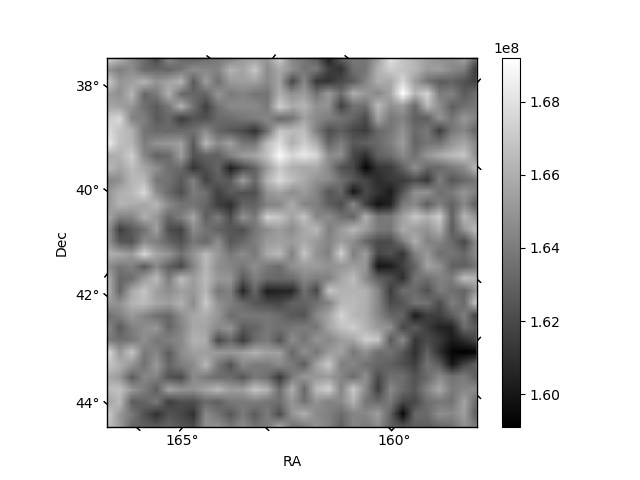
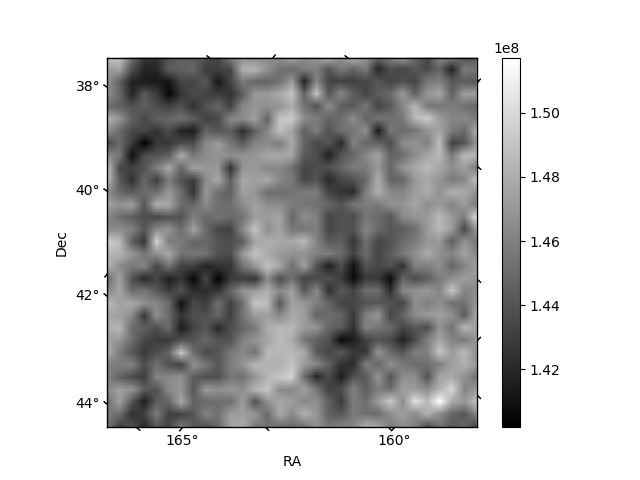
Histogram calculated using DETX and DETY for each event in the final _common_clean file
| Quadrant A |  |
 |
Quadrant B |
|---|---|---|---|
| Quadrant D |  |
 |
Quadrant C |
| Plot type | Count rate plots | Images |
|---|---|---|
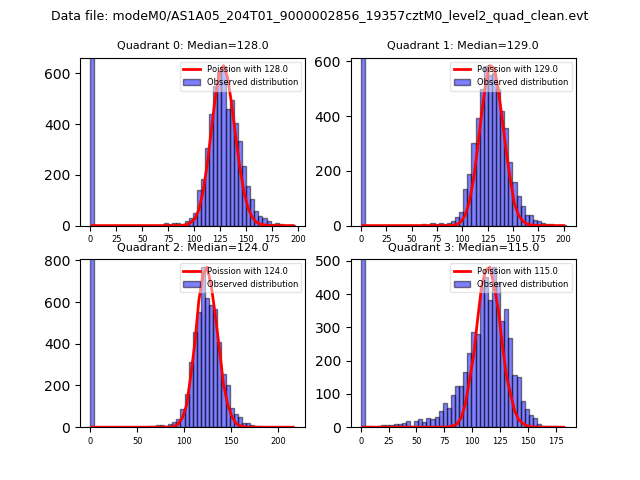
| Comparison with Poisson distribution Blue bars denote a histogram of data divided into 1 sec bins. Red curve is a Poisson curve with rate = median count rate of data. |
 |
 |
| Quadrant-wise count rates Data is divided into 100 sec bins |
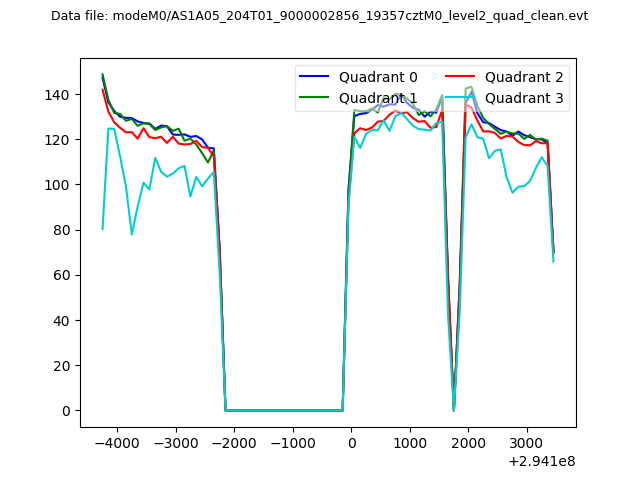 |
|
| Module-wise count rates for Quadrant A Data is divided into 100 sec bins |
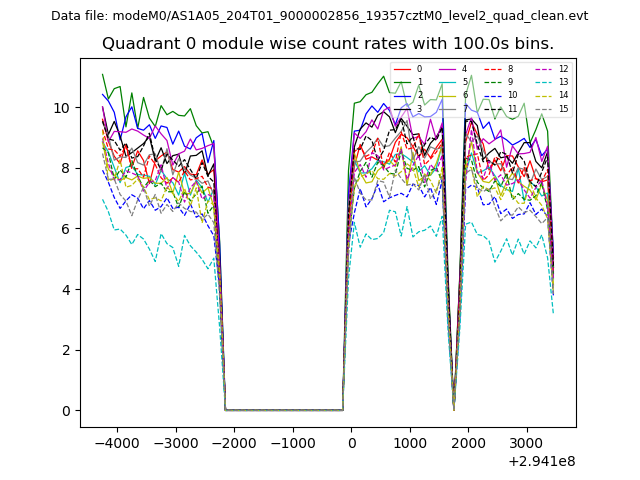 |
 |
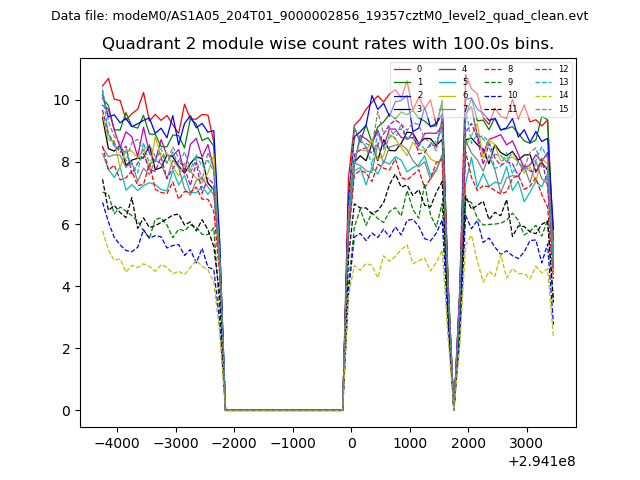
| Module-wise count rates for Quadrant B Data is divided into 100 sec bins |
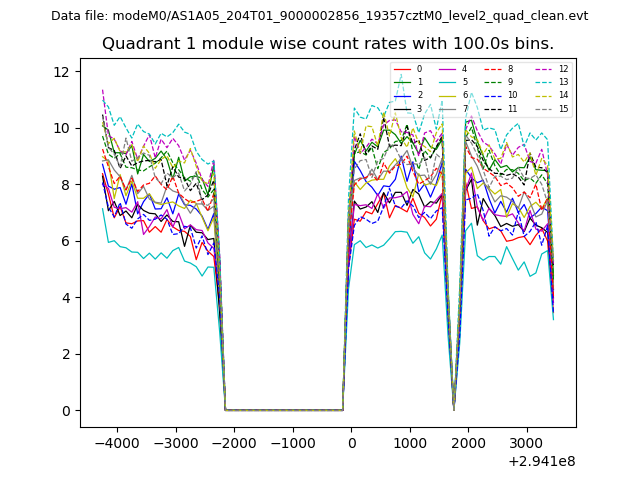 |
 |
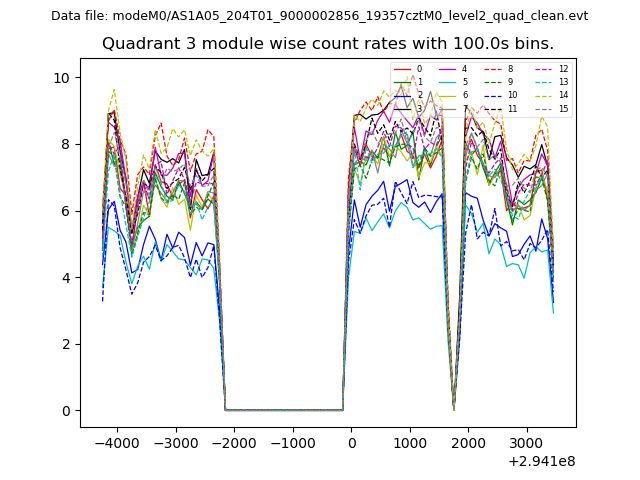
| Module-wise count rates for Quadrant C Data is divided into 100 sec bins |
 |
 |
| Module-wise count rates for Quadrant D Data is divided into 100 sec bins |
 |
 |
| Parameter | Plot |
|---|---|
| CZT HV Monitor | 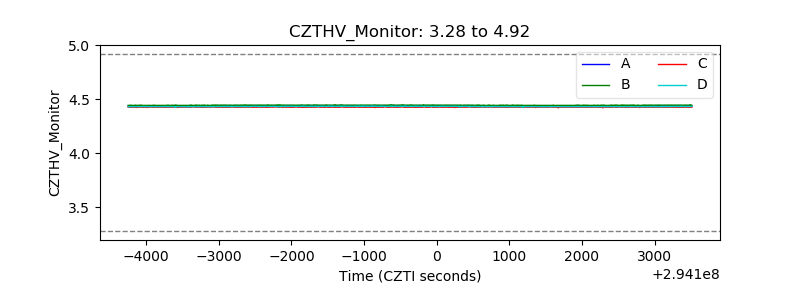 |
| D_VDD | 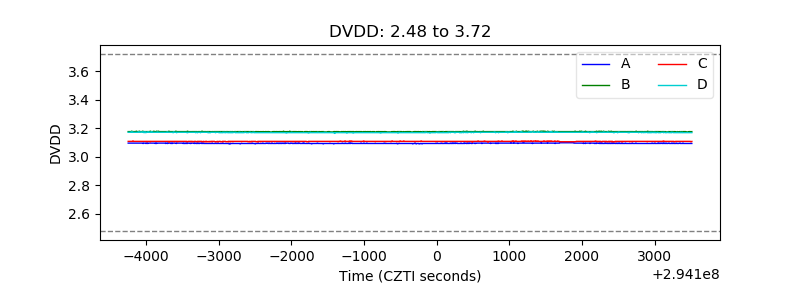 |
| Temperature 1 | 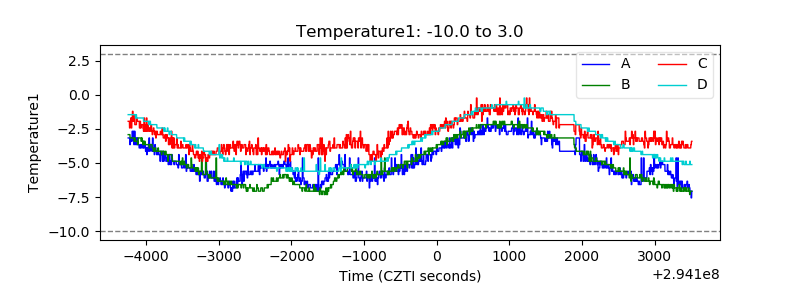 |
| Veto HV Monitor | 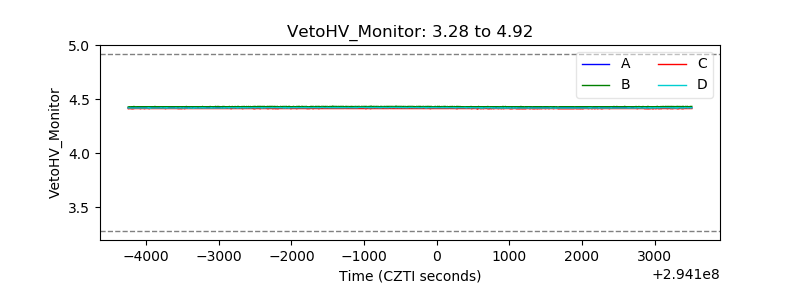 |
| Veto LLD | 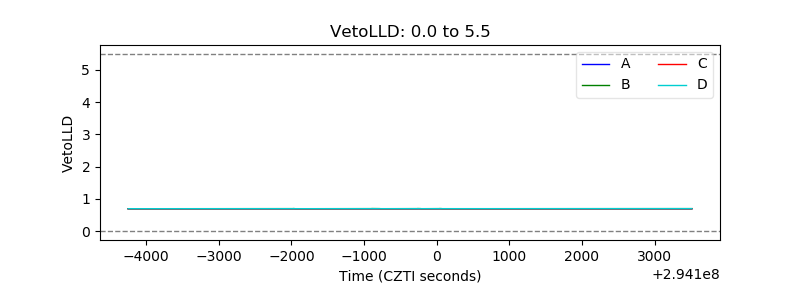 |
| Alpha Counter | 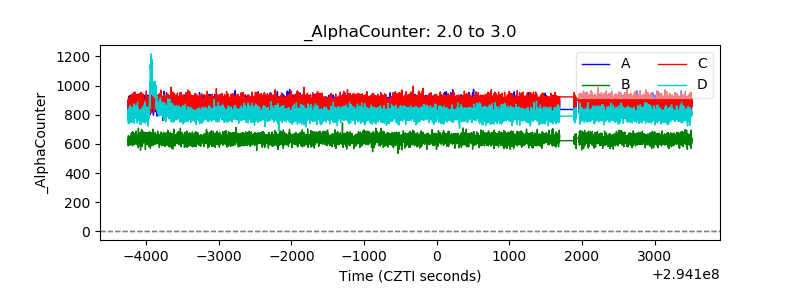 |
| _CPM_Rate | 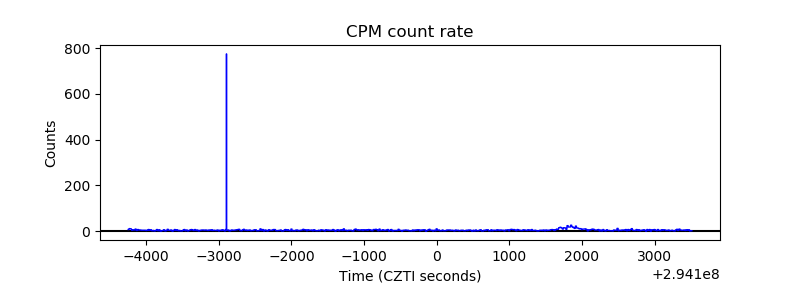 |
| CZT Counter | 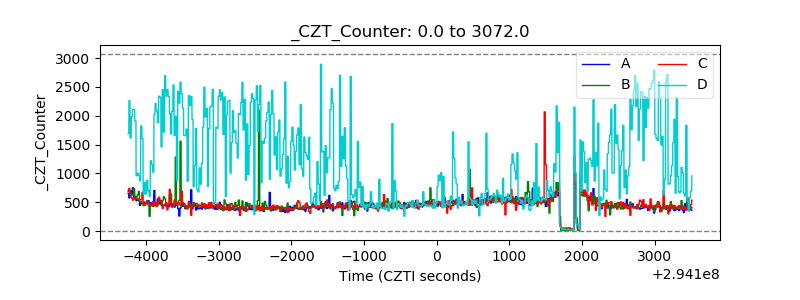 |
| +2.5 Volts monitor |  |
| +5 Volts monitor |  |
| _ROLL_ROT | 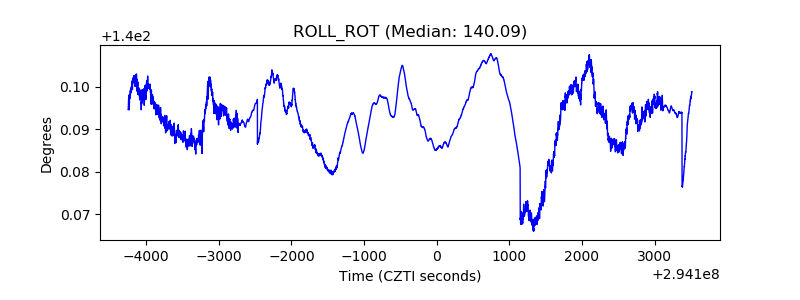 |
| _Roll_DEC | 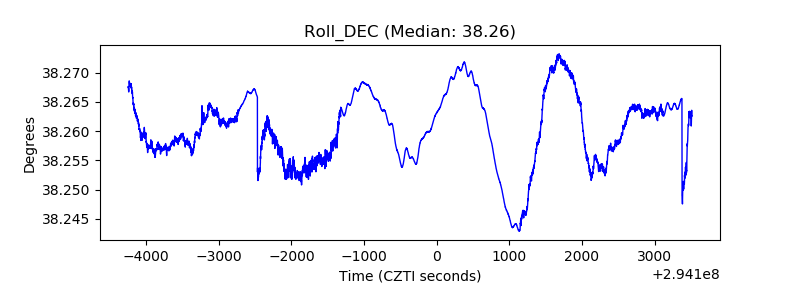 |
| _Roll_RA | 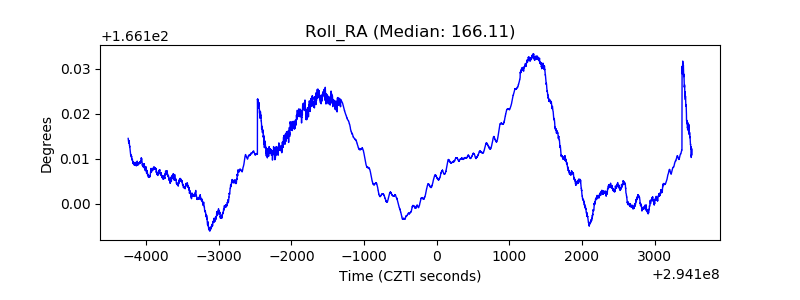 |
| Veto Counter | 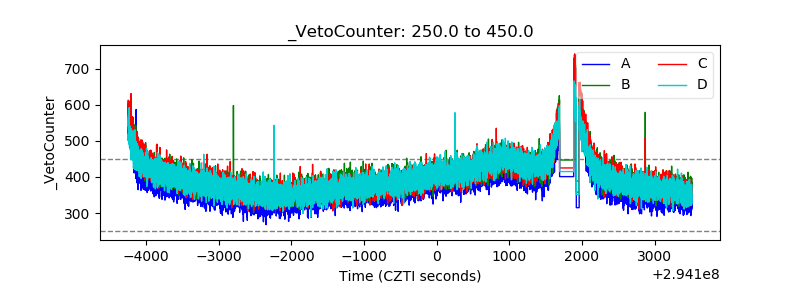 |