| Param | Original file | Final file |
|---|---|---|
| Filename | modeM0/AS1A05_204T01_9000002856_19358cztM0_level2.evt | modeM0/AS1A05_204T01_9000002856_19358cztM0_level2_quad_clean.evt |
| Size (bytes) | 687,441,600 | 101,157,120 |
| Size | 655.6 MB | 96.5 MB |
| Events in quadrant A | 3,520,168 | 658,984 |
| Events in quadrant B | 3,773,893 | 662,513 |
| Events in quadrant C | 3,591,130 | 638,606 |
| Events in quadrant D | 9,414,570 | 568,919 |
| Mode M0 | |||
|---|---|---|---|
| Quadrant | BADHDUFLAG | Total packets | Discarded packets |
| A | 0 | 15759 | 6 |
| B | 0 | 16402 | 3 |
| C | 0 | 15858 | 3 |
| D | 0 | 33374 | 5 |
| Mode M9 | |||
|---|---|---|---|
| Quadrant | BADHDUFLAG | Total packets | Discarded packets |
| A | 0 | 5 | 0 |
| B | 0 | 5 | 0 |
| C | 0 | 5 | 0 |
| D | 0 | 5 | 0 |
| Mode SS | |||
|---|---|---|---|
| Quadrant | BADHDUFLAG | Total packets | Discarded packets |
| A | 0 | 158 | 0 |
| B | 0 | 158 | 0 |
| C | 0 | 158 | 0 |
| D | 0 | 158 | 0 |
| Quadrant | Total seconds | Saturated seconds | Saturation percentage |
|---|---|---|---|
| A | 7673 | 37 | 0.482210% |
| B | 7676 | 95 | 1.237624% |
| C | 7676 | 86 | 1.120375% |
| D | 7675 | 1450 | 18.892508% |
Noise dominated data is calculated using 1-second bins in cleaned event files. If a bin has >2000 counts, and if more than 50% of those come from <1% of pixels, then it is considered to be noise-dominated and hence unusable.
| Quadrant | # 1 sec bins | Bins with >0 counts | Bins with >2000 counts | High rate bins dominated by noise | Noise dominated (total time) | Noise dominated (detector-on time) | Marked lightcurve |
|---|---|---|---|---|---|---|---|
| A | 8270 | 7678 | 0 | 0 | 0.00% | 0.00% | 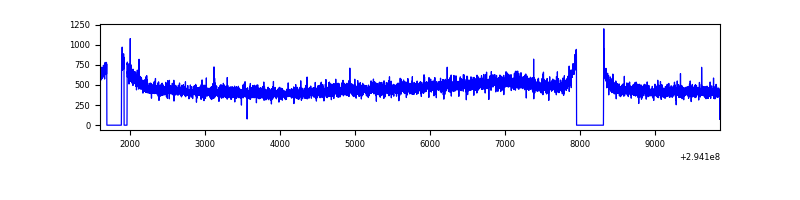 |
| B | 8271 | 7678 | 16 | 16 | 0.19% | 0.21% | 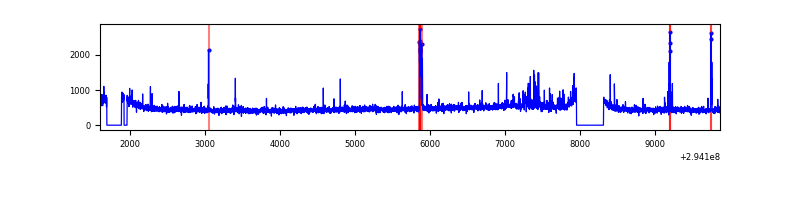 |
| C | 8271 | 7679 | 0 | 0 | 0.00% | 0.00% | 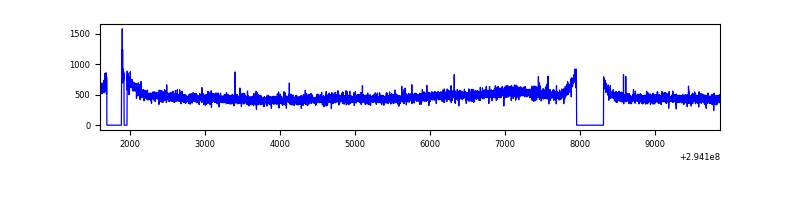 |
| D | 8271 | 7679 | 1220 | 1220 | 14.75% | 15.89% | 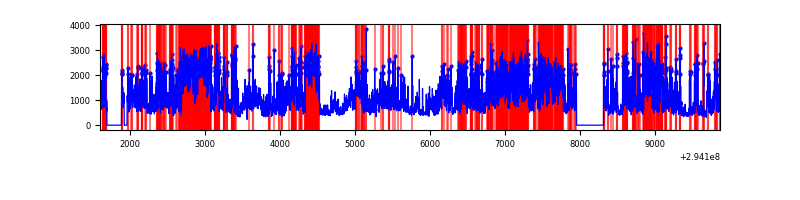 |
Top three noisy pixels from each quadrant. If the there are fewer than three noisy pixels in the level2.evt file, extra rows are filled as -1
| Pixel properties | Quadrant properties | ||||||
|---|---|---|---|---|---|---|---|
| Quadrant | DetID | PixID | Counts | Sigma | Mean | Median | Sigma |
| A | 13 | 254 | 9945 | 48.72 | 913 | 893 | 185.8 |
| A | 0 | 226 | 7869 | 37.55 | 913 | 893 | 185.8 |
| A | 3 | 137 | 7380 | 34.92 | 913 | 893 | 185.8 |
| B | 3 | 64 | 89848 | 509.62 | 909 | 883 | 174.6 |
| B | 7 | 220 | 47336 | 266.1 | 909 | 883 | 174.6 |
| B | 0 | 230 | 35688 | 199.38 | 909 | 883 | 174.6 |
| C | 14 | 238 | 133142 | 635.75 | 883 | 889 | 208.0 |
| C | 13 | 61 | 6008 | 24.61 | 883 | 889 | 208.0 |
| C | 3 | 233 | 4930 | 19.43 | 883 | 889 | 208.0 |
| D | 7 | 238 | 2865368 | 13799.92 | 842 | 815 | 207.6 |
| D | 10 | 66 | 2708886 | 13046.07 | 842 | 815 | 207.6 |
| D | 12 | 233 | 268501 | 1289.57 | 842 | 815 | 207.6 |
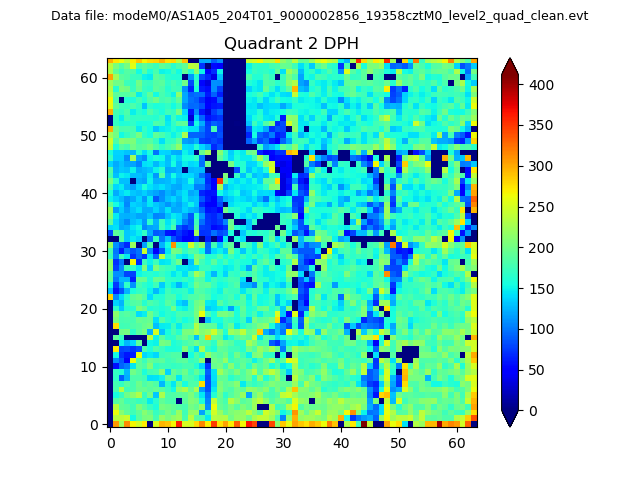
Histogram calculated using DETX and DETY for each event in the final _common_clean file
| Quadrant A | 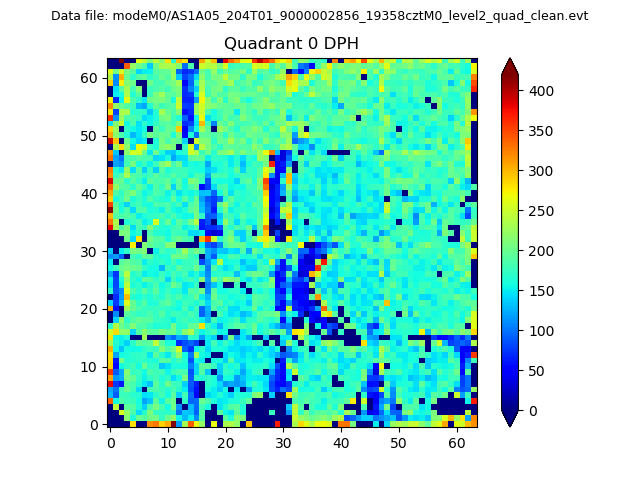 |
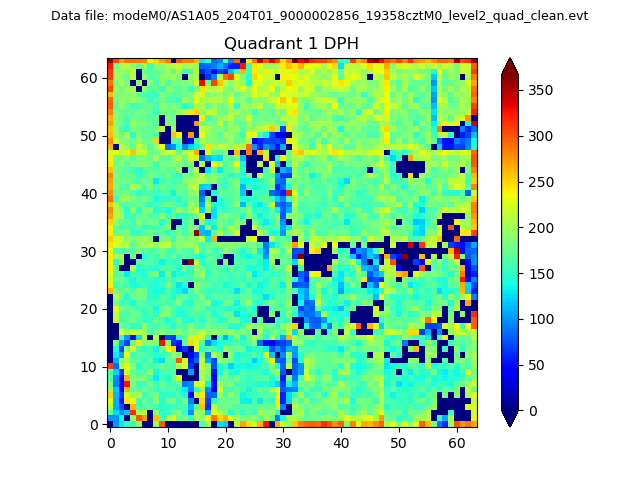 |
Quadrant B |
|---|---|---|---|
| Quadrant D | 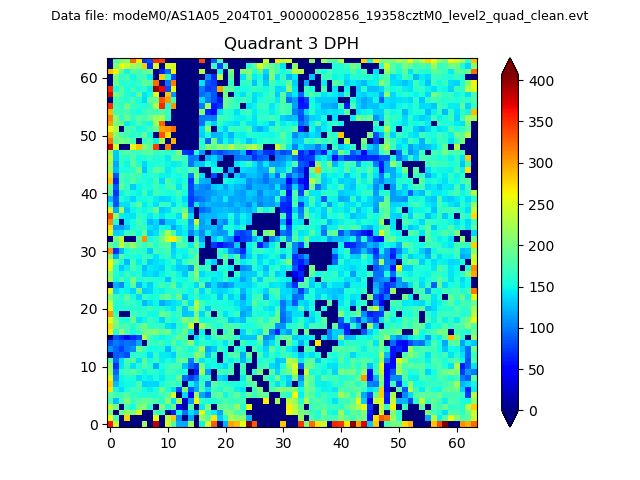 |
 |
Quadrant C |
| Plot type | Count rate plots | Images |
|---|---|---|
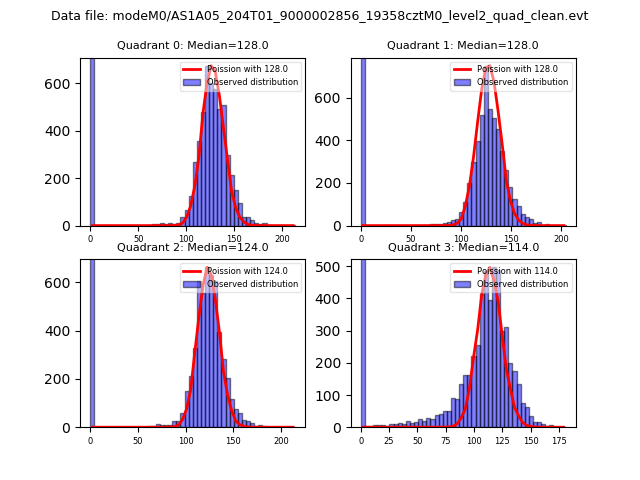
| Comparison with Poisson distribution Blue bars denote a histogram of data divided into 1 sec bins. Red curve is a Poisson curve with rate = median count rate of data. |
 |
 |
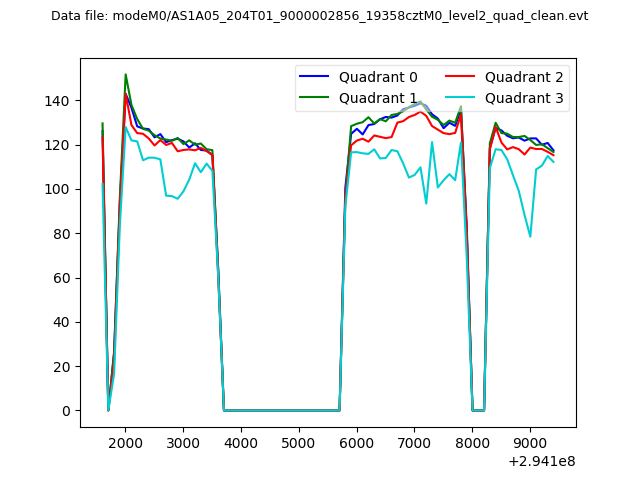
| Quadrant-wise count rates Data is divided into 100 sec bins |
 |
|
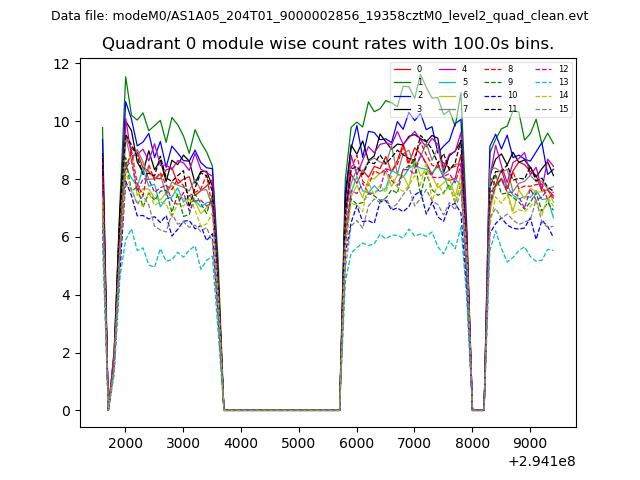
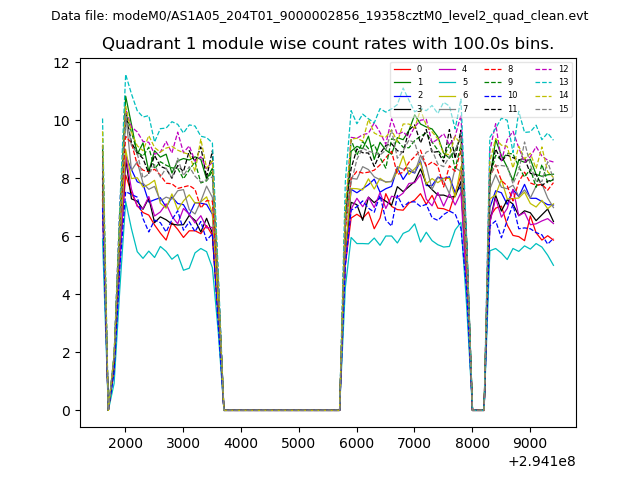
| Module-wise count rates for Quadrant A Data is divided into 100 sec bins |
 |
 |
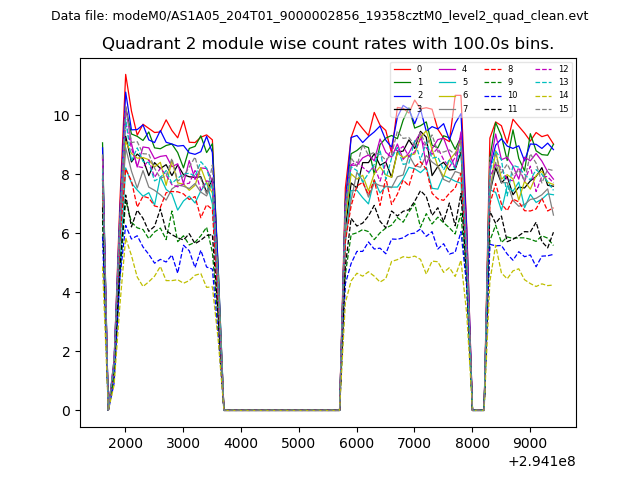
| Module-wise count rates for Quadrant B Data is divided into 100 sec bins |
 |
 |
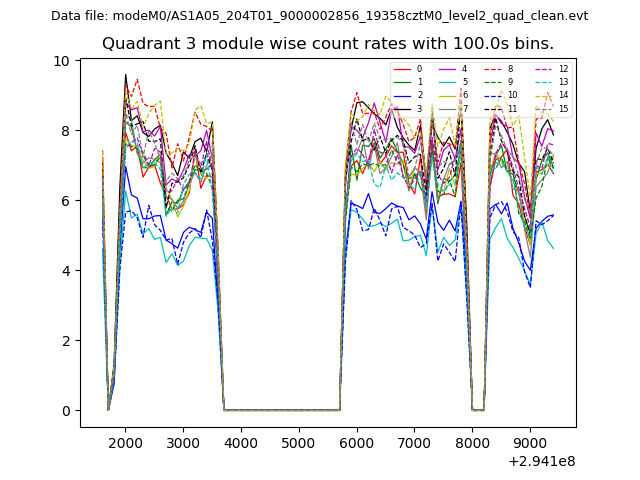
| Module-wise count rates for Quadrant C Data is divided into 100 sec bins |
 |
 |
| Module-wise count rates for Quadrant D Data is divided into 100 sec bins |
 |
 |
| Parameter | Plot |
|---|---|
| CZT HV Monitor | 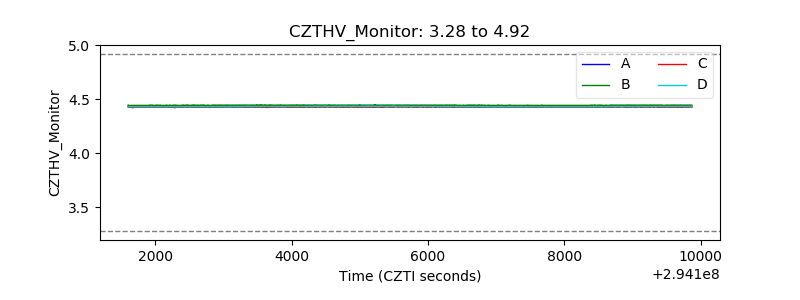 |
| D_VDD | 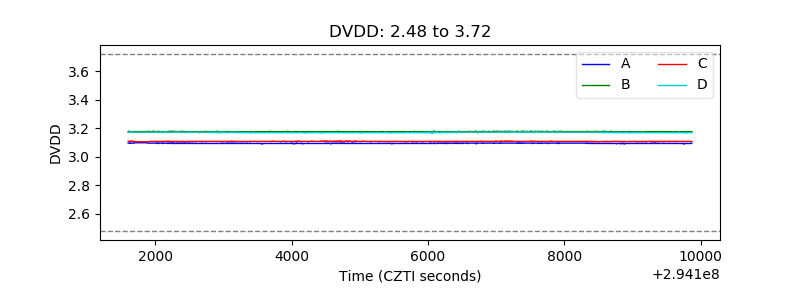 |
| Temperature 1 | 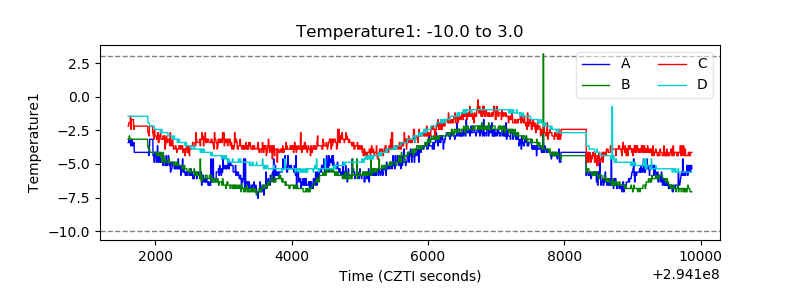 |
| Veto HV Monitor | 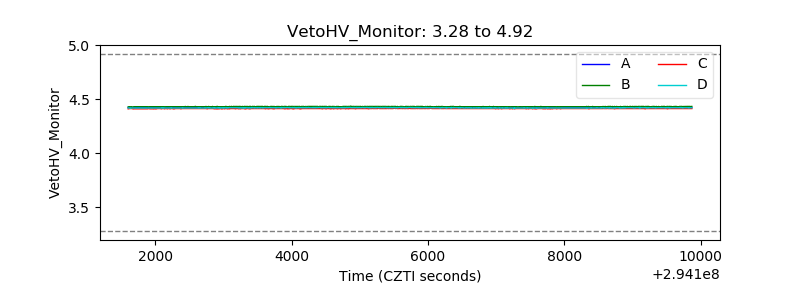 |
| Veto LLD | 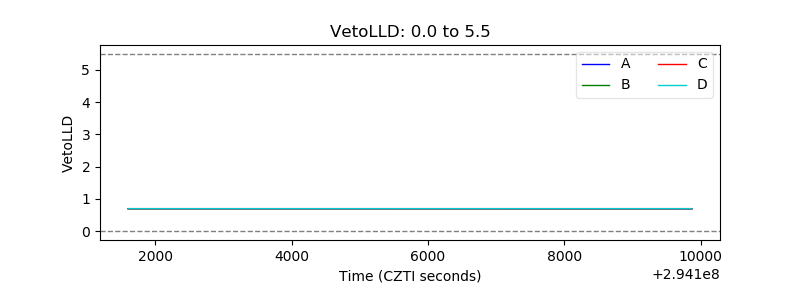 |
| Alpha Counter | 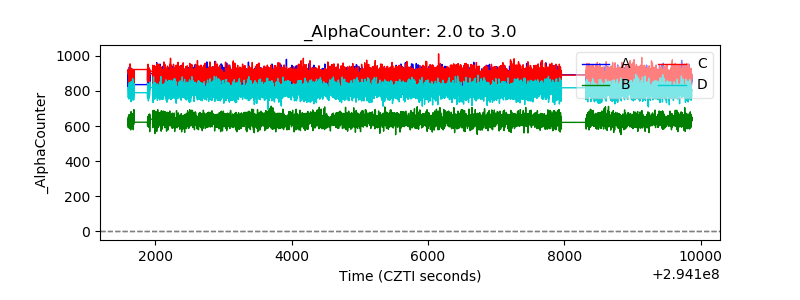 |
| _CPM_Rate | 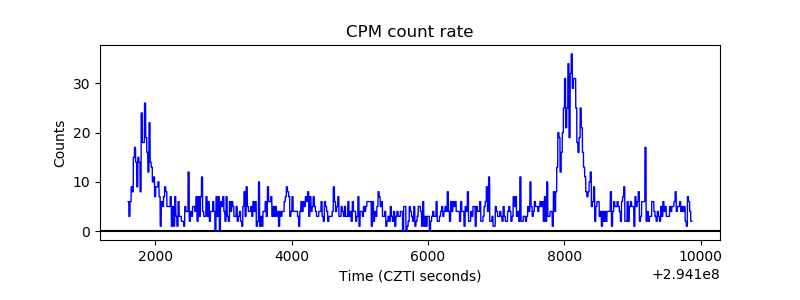 |
| CZT Counter |  |
| +2.5 Volts monitor |  |
| +5 Volts monitor |  |
| _ROLL_ROT | 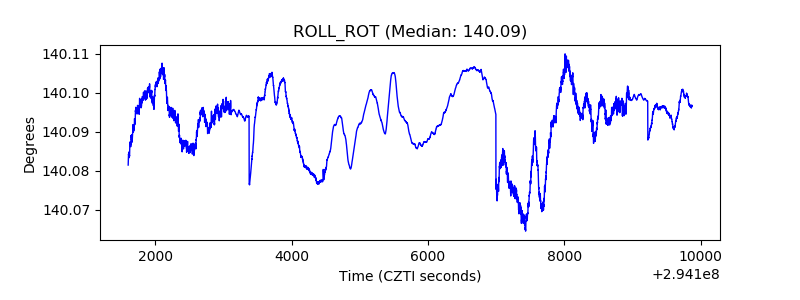 |
| _Roll_DEC | 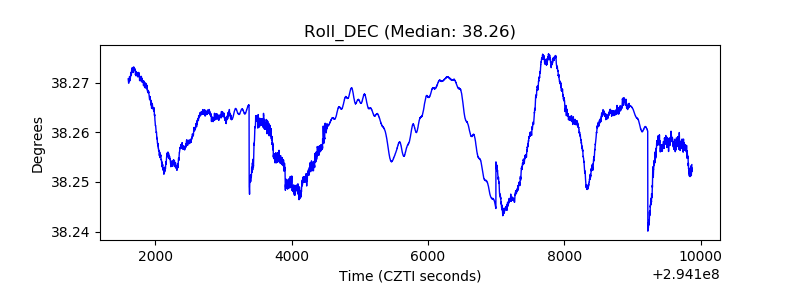 |
| _Roll_RA |  |
| Veto Counter | 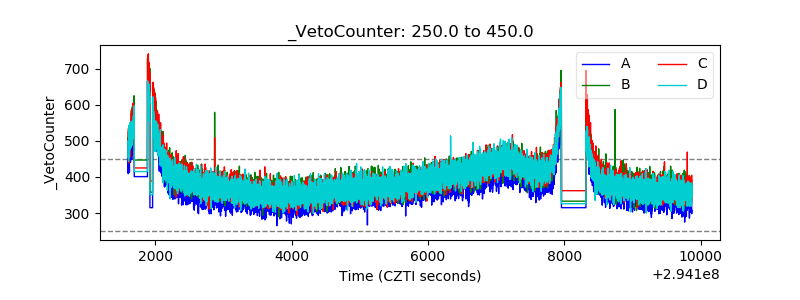 |