| Param | Original file | Final file |
|---|---|---|
| Filename | modeM0/AS1A05_204T01_9000002856_19360cztM0_level2.evt | modeM0/AS1A05_204T01_9000002856_19360cztM0_level2_quad_clean.evt |
| Size (bytes) | 1,071,616,320 | 157,988,160 |
| Size | 1022.0 MB | 150.7 MB |
| Events in quadrant A | 6,163,090 | 999,720 |
| Events in quadrant B | 6,405,012 | 1,003,111 |
| Events in quadrant C | 6,257,880 | 963,131 |
| Events in quadrant D | 12,724,585 | 894,308 |
| Mode M0 | |||
|---|---|---|---|
| Quadrant | BADHDUFLAG | Total packets | Discarded packets |
| A | 0 | 27202 | 3 |
| B | 0 | 27763 | 3 |
| C | 0 | 27312 | 3 |
| D | 0 | 47273 | 3 |
| Mode M9 | |||
|---|---|---|---|
| Quadrant | BADHDUFLAG | Total packets | Discarded packets |
| A | 0 | 16 | 0 |
| B | 0 | 16 | 0 |
| C | 0 | 16 | 0 |
| D | 0 | 16 | 0 |
| Mode SS | |||
|---|---|---|---|
| Quadrant | BADHDUFLAG | Total packets | Discarded packets |
| A | 0 | 272 | 0 |
| B | 0 | 272 | 0 |
| C | 0 | 272 | 0 |
| D | 0 | 272 | 0 |
| Quadrant | Total seconds | Saturated seconds | Saturation percentage |
|---|---|---|---|
| A | 13382 | 85 | 0.635182% |
| B | 13382 | 148 | 1.105963% |
| C | 13381 | 141 | 1.053733% |
| D | 13382 | 1168 | 8.728142% |
Noise dominated data is calculated using 1-second bins in cleaned event files. If a bin has >2000 counts, and if more than 50% of those come from <1% of pixels, then it is considered to be noise-dominated and hence unusable.
| Quadrant | # 1 sec bins | Bins with >0 counts | Bins with >2000 counts | High rate bins dominated by noise | Noise dominated (total time) | Noise dominated (detector-on time) | Marked lightcurve |
|---|---|---|---|---|---|---|---|
| A | 14947 | 13383 | 2 | 2 | 0.01% | 0.01% | 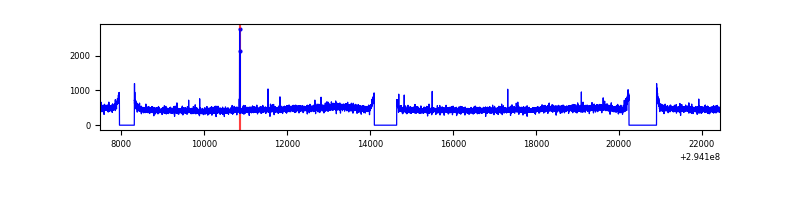 |
| B | 14947 | 13383 | 9 | 9 | 0.06% | 0.07% | 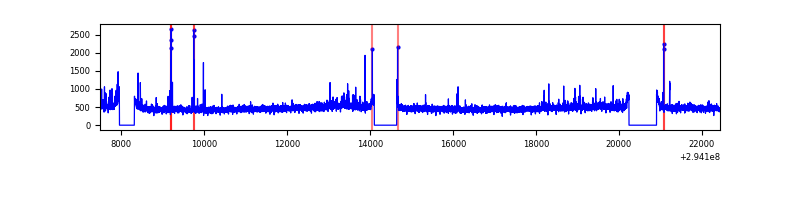 |
| C | 14946 | 13382 | 0 | 0 | 0.00% | 0.00% | 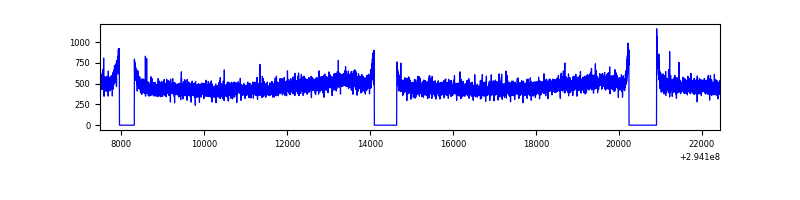 |
| D | 14947 | 13384 | 917 | 917 | 6.14% | 6.85% | 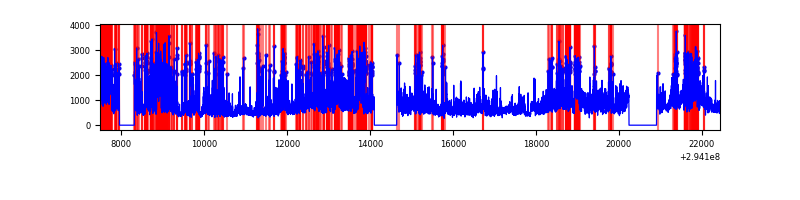 |
Top three noisy pixels from each quadrant. If the there are fewer than three noisy pixels in the level2.evt file, extra rows are filled as -1
| Pixel properties | Quadrant properties | ||||||
|---|---|---|---|---|---|---|---|
| Quadrant | DetID | PixID | Counts | Sigma | Mean | Median | Sigma |
| A | 13 | 254 | 15492 | 43.34 | 1595 | 1561 | 321.4 |
| A | 0 | 226 | 13907 | 38.41 | 1595 | 1561 | 321.4 |
| A | 3 | 137 | 12995 | 35.57 | 1595 | 1561 | 321.4 |
| B | 0 | 230 | 45396 | 144.7 | 1589 | 1547 | 303.0 |
| B | 0 | 190 | 42626 | 135.56 | 1589 | 1547 | 303.0 |
| B | 12 | 111 | 38147 | 120.78 | 1589 | 1547 | 303.0 |
| C | 14 | 238 | 234054 | 645.87 | 1534 | 1543 | 360.0 |
| C | 3 | 233 | 37733 | 100.53 | 1534 | 1543 | 360.0 |
| C | 13 | 61 | 10758 | 25.6 | 1534 | 1543 | 360.0 |
| D | 10 | 66 | 3130684 | 8452.8 | 1509 | 1462 | 370.2 |
| D | 7 | 238 | 2430210 | 6560.64 | 1509 | 1462 | 370.2 |
| D | 12 | 233 | 709168 | 1911.69 | 1509 | 1462 | 370.2 |
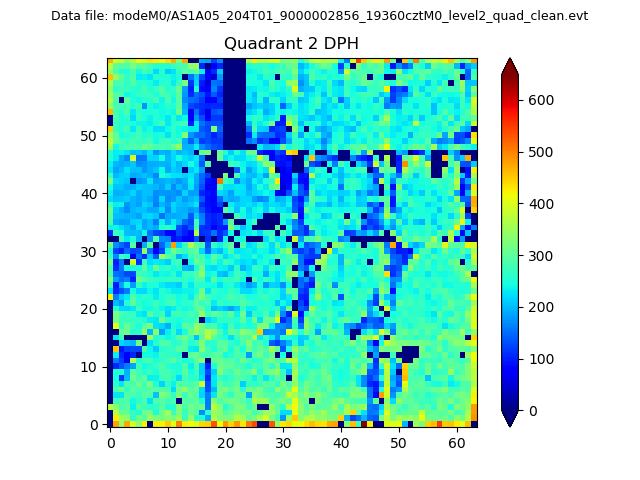
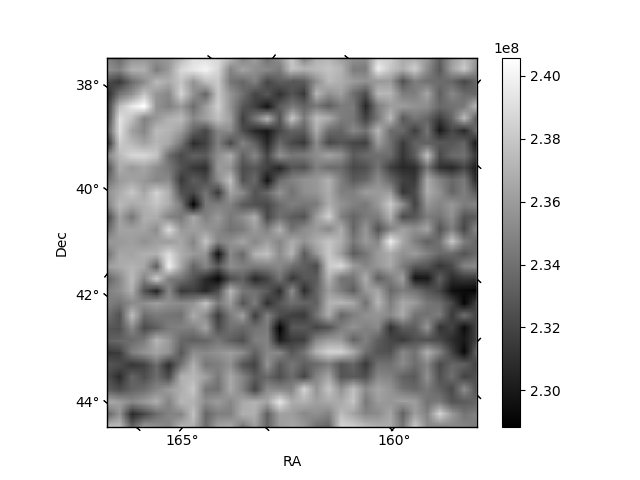
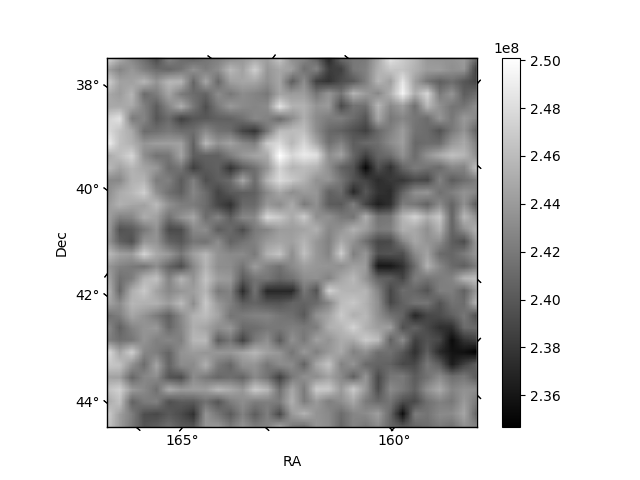
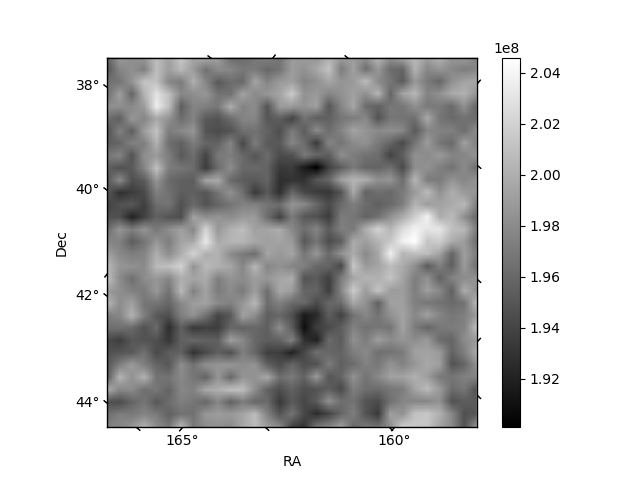
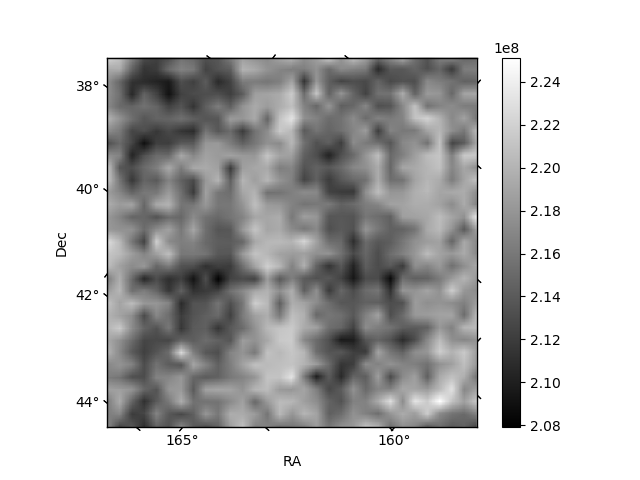
Histogram calculated using DETX and DETY for each event in the final _common_clean file
| Quadrant A | 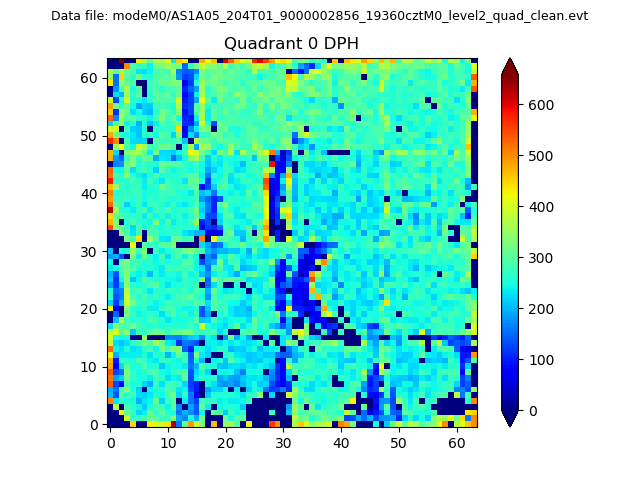 |
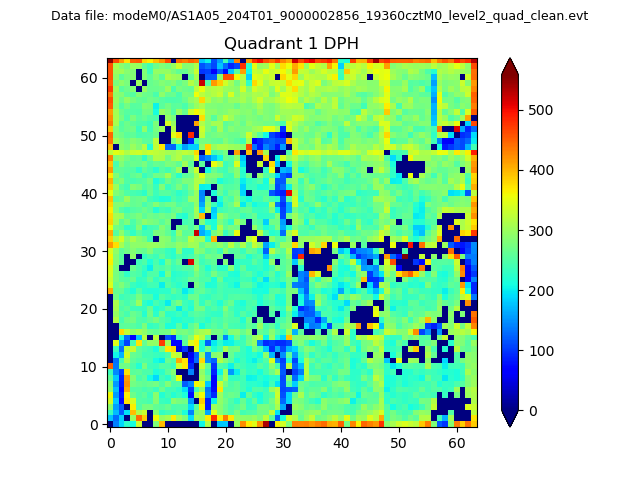 |
Quadrant B |
|---|---|---|---|
| Quadrant D | 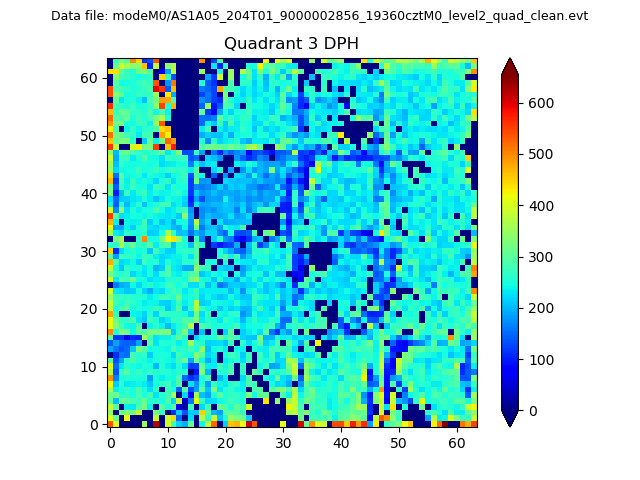 |
 |
Quadrant C |
| Plot type | Count rate plots | Images |
|---|---|---|
| Comparison with Poisson distribution Blue bars denote a histogram of data divided into 1 sec bins. Red curve is a Poisson curve with rate = median count rate of data. |
 |
 |
| Quadrant-wise count rates Data is divided into 100 sec bins |
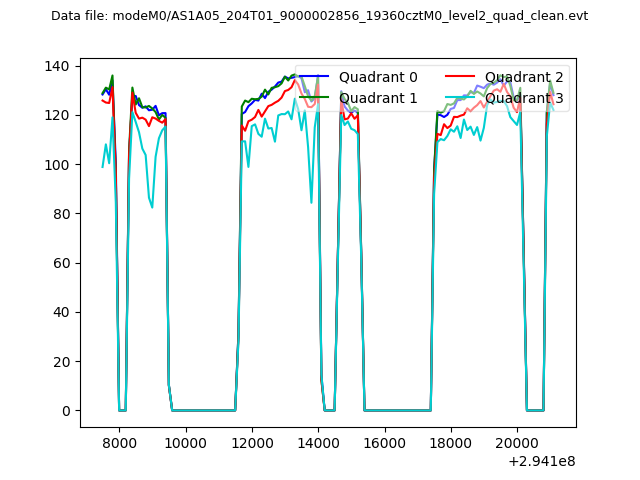 |
|
| Module-wise count rates for Quadrant A Data is divided into 100 sec bins |
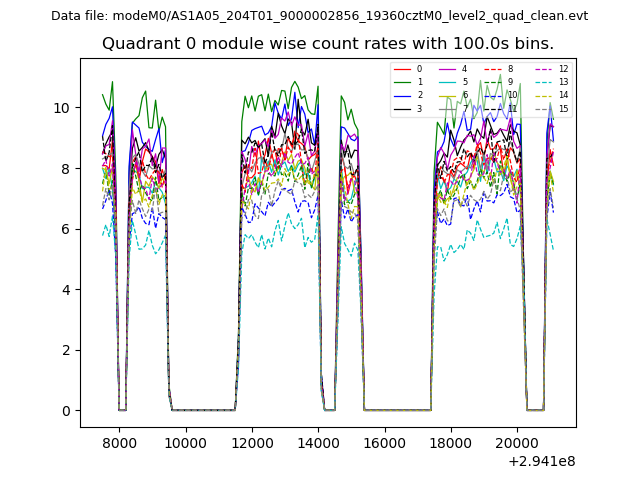 |
 |
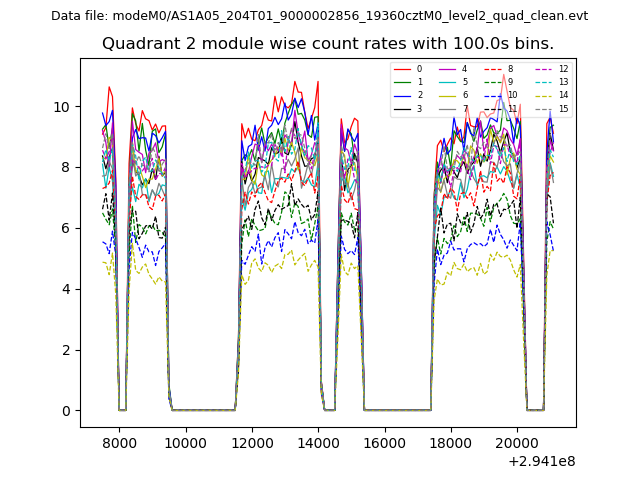
| Module-wise count rates for Quadrant B Data is divided into 100 sec bins |
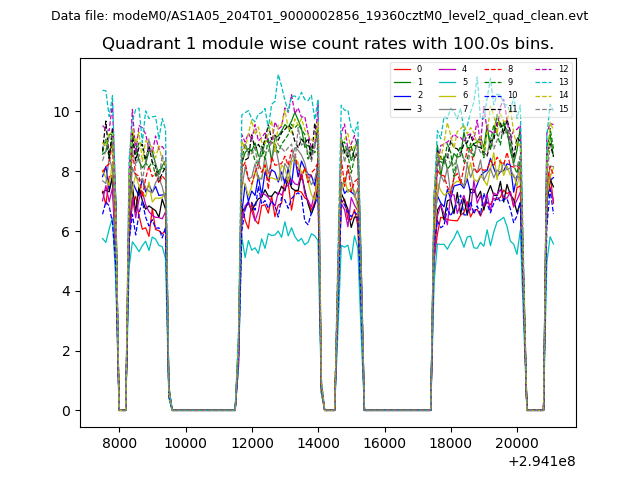 |
 |
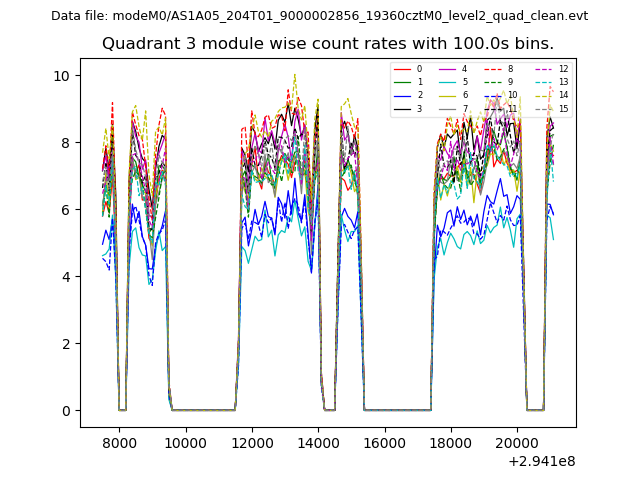
| Module-wise count rates for Quadrant C Data is divided into 100 sec bins |
 |
 |
| Module-wise count rates for Quadrant D Data is divided into 100 sec bins |
 |
 |
| Parameter | Plot |
|---|---|
| CZT HV Monitor | 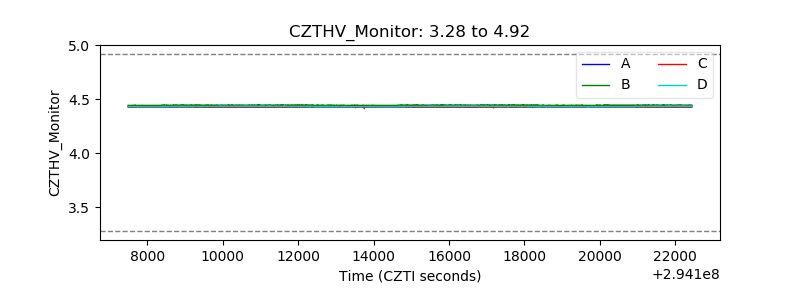 |
| D_VDD | 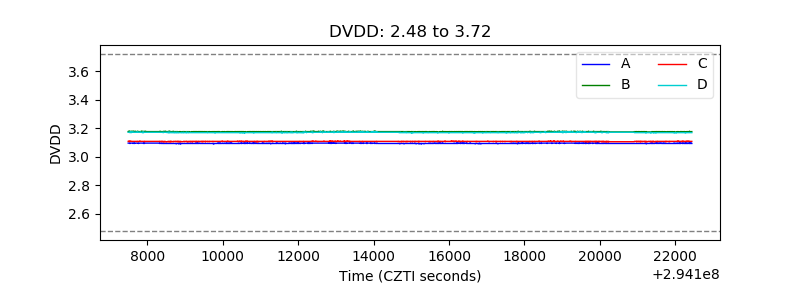 |
| Temperature 1 |  |
| Veto HV Monitor | 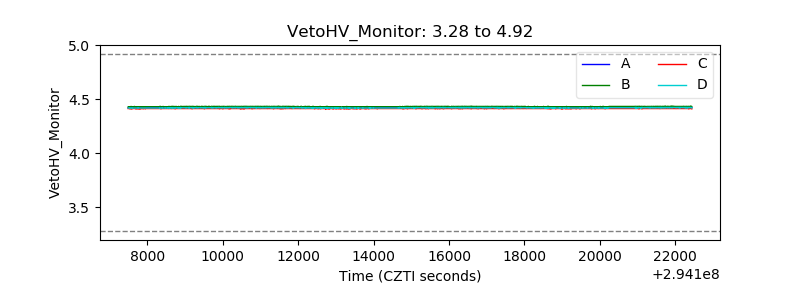 |
| Veto LLD | 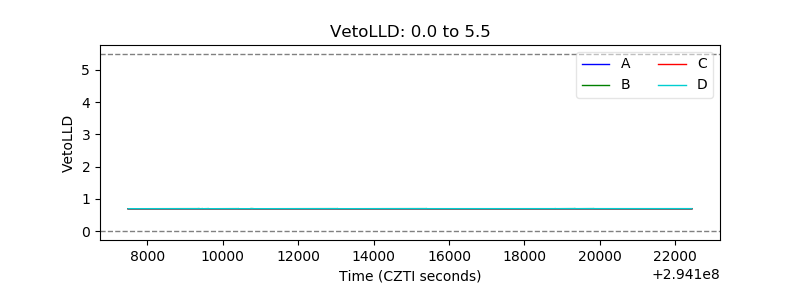 |
| Alpha Counter |  |
| _CPM_Rate | 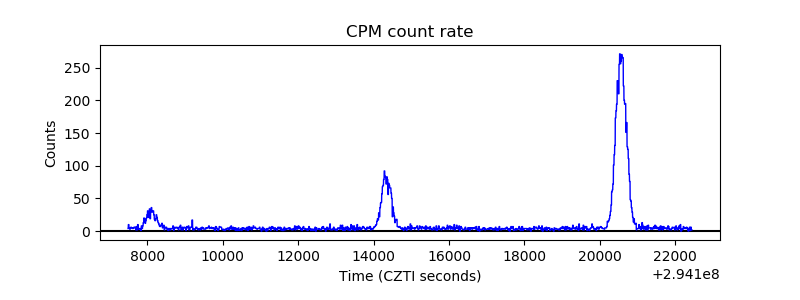 |
| CZT Counter |  |
| +2.5 Volts monitor |  |
| +5 Volts monitor |  |
| _ROLL_ROT | 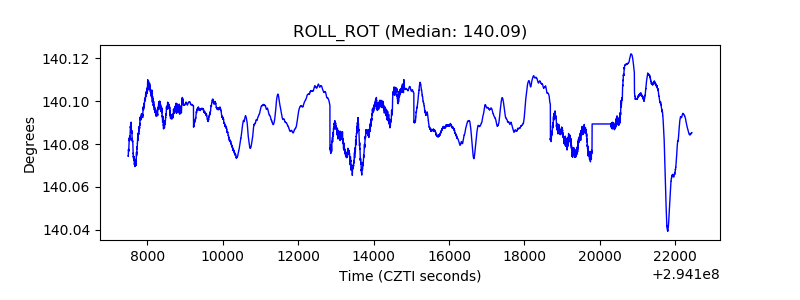 |
| _Roll_DEC | 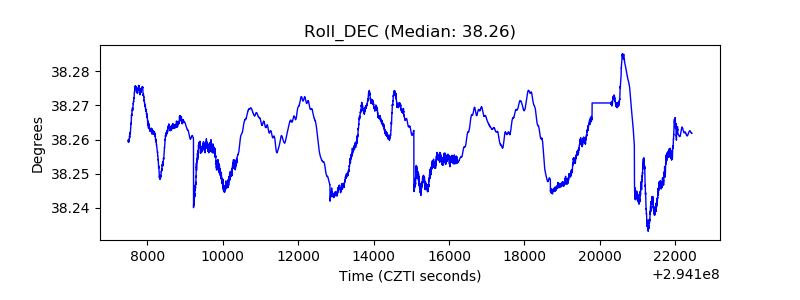 |
| _Roll_RA |  |
| Veto Counter | 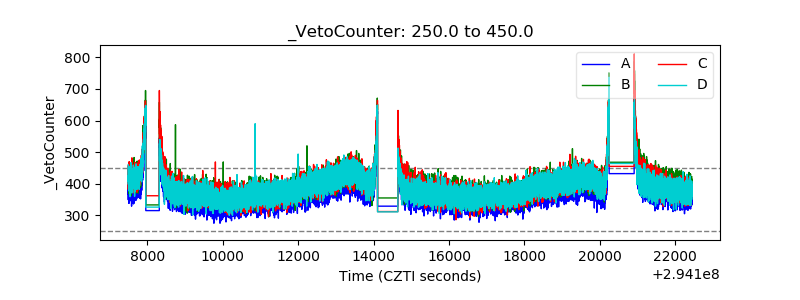 |