| Param | Original file | Final file |
|---|---|---|
| Filename | modeM0/AS1A05_204T01_9000002856_19361cztM0_level2.evt | modeM0/AS1A05_204T01_9000002856_19361cztM0_level2_quad_clean.evt |
| Size (bytes) | 661,222,080 | 77,232,960 |
| Size | 630.6 MB | 73.7 MB |
| Events in quadrant A | 3,519,148 | 473,717 |
| Events in quadrant B | 3,617,498 | 475,354 |
| Events in quadrant C | 3,556,988 | 455,058 |
| Events in quadrant D | 8,830,768 | 419,208 |
| Mode M0 | |||
|---|---|---|---|
| Quadrant | BADHDUFLAG | Total packets | Discarded packets |
| A | 0 | 15177 | 2 |
| B | 0 | 15389 | 2 |
| C | 0 | 15222 | 3 |
| D | 0 | 31513 | 2 |
| Mode M9 | |||
|---|---|---|---|
| Quadrant | BADHDUFLAG | Total packets | Discarded packets |
| A | 0 | 16 | 0 |
| B | 0 | 16 | 0 |
| C | 0 | 16 | 0 |
| D | 0 | 16 | 0 |
| Mode SS | |||
|---|---|---|---|
| Quadrant | BADHDUFLAG | Total packets | Discarded packets |
| A | 0 | 150 | 0 |
| B | 0 | 150 | 0 |
| C | 0 | 150 | 0 |
| D | 0 | 150 | 0 |
| Quadrant | Total seconds | Saturated seconds | Saturation percentage |
|---|---|---|---|
| A | 7404 | 129 | 1.742301% |
| B | 7405 | 154 | 2.079676% |
| C | 7404 | 144 | 1.944895% |
| D | 7404 | 1102 | 14.883847% |
Noise dominated data is calculated using 1-second bins in cleaned event files. If a bin has >2000 counts, and if more than 50% of those come from <1% of pixels, then it is considered to be noise-dominated and hence unusable.
| Quadrant | # 1 sec bins | Bins with >0 counts | Bins with >2000 counts | High rate bins dominated by noise | Noise dominated (total time) | Noise dominated (detector-on time) | Marked lightcurve |
|---|---|---|---|---|---|---|---|
| A | 8879 | 7404 | 0 | 0 | 0.00% | 0.00% | 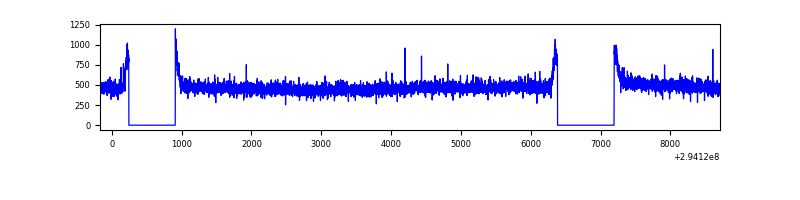 |
| B | 8880 | 7405 | 3 | 3 | 0.03% | 0.04% | 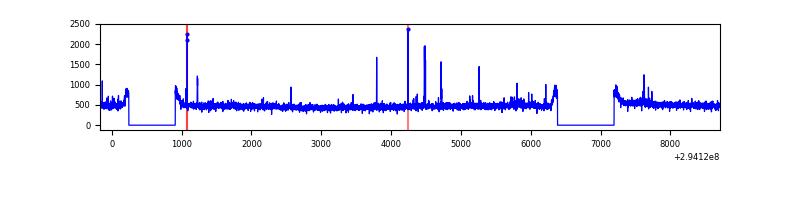 |
| C | 8879 | 7404 | 0 | 0 | 0.00% | 0.00% | 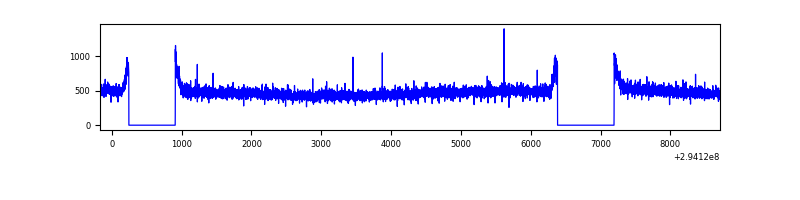 |
| D | 8879 | 7404 | 905 | 905 | 10.19% | 12.22% | 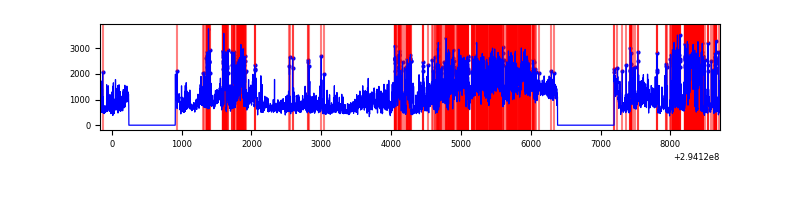 |
Top three noisy pixels from each quadrant. If the there are fewer than three noisy pixels in the level2.evt file, extra rows are filled as -1
| Pixel properties | Quadrant properties | ||||||
|---|---|---|---|---|---|---|---|
| Quadrant | DetID | PixID | Counts | Sigma | Mean | Median | Sigma |
| A | 13 | 254 | 8522 | 40.98 | 911 | 891 | 186.2 |
| A | 0 | 226 | 7890 | 37.59 | 911 | 891 | 186.2 |
| A | 3 | 137 | 7418 | 35.05 | 911 | 891 | 186.2 |
| B | 3 | 64 | 24187 | 133.33 | 906 | 884 | 174.8 |
| B | 12 | 111 | 21665 | 118.9 | 906 | 884 | 174.8 |
| B | 11 | 111 | 19340 | 105.6 | 906 | 884 | 174.8 |
| C | 14 | 238 | 133957 | 650.44 | 870 | 875 | 204.6 |
| C | 3 | 233 | 29100 | 137.95 | 870 | 875 | 204.6 |
| C | 13 | 61 | 6095 | 25.51 | 870 | 875 | 204.6 |
| D | 10 | 66 | 3231116 | 15537.09 | 842 | 816 | 207.9 |
| D | 7 | 238 | 2058340 | 9896.28 | 842 | 816 | 207.9 |
| D | 1 | 52 | 123743 | 591.25 | 842 | 816 | 207.9 |
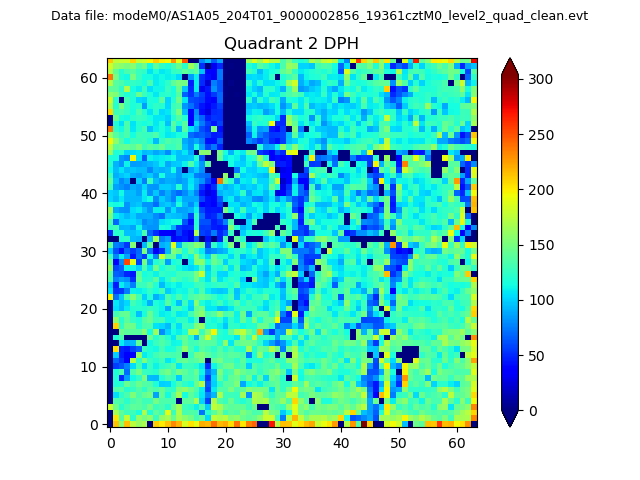
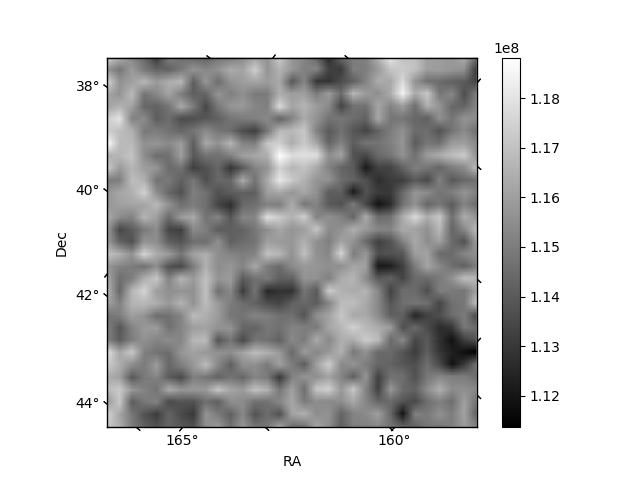
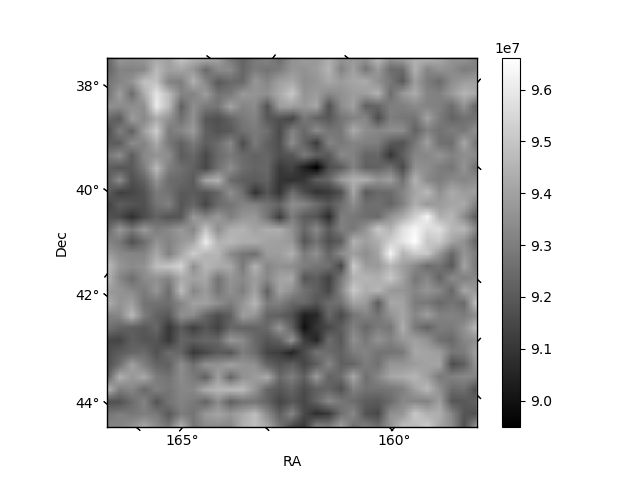
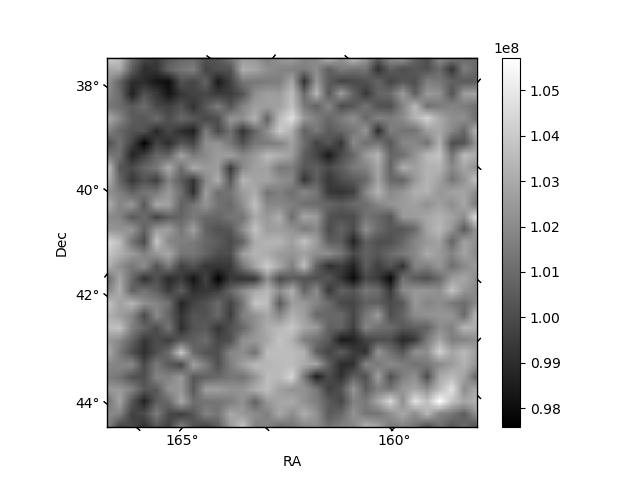
Histogram calculated using DETX and DETY for each event in the final _common_clean file
| Quadrant A | 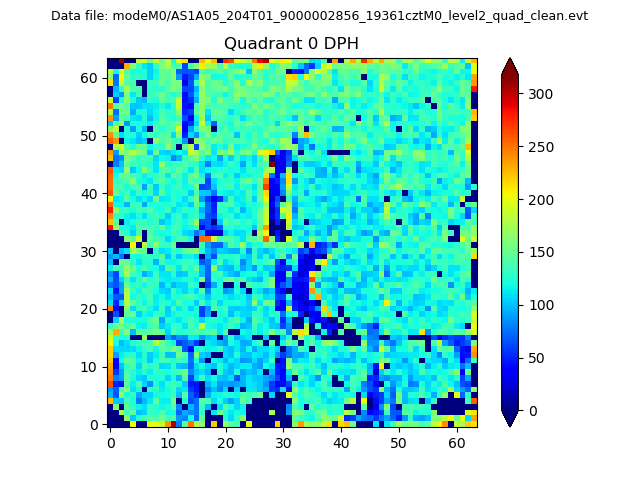 |
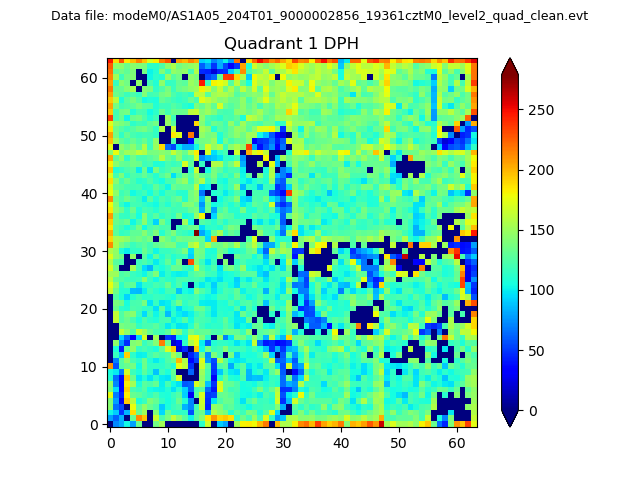 |
Quadrant B |
|---|---|---|---|
| Quadrant D | 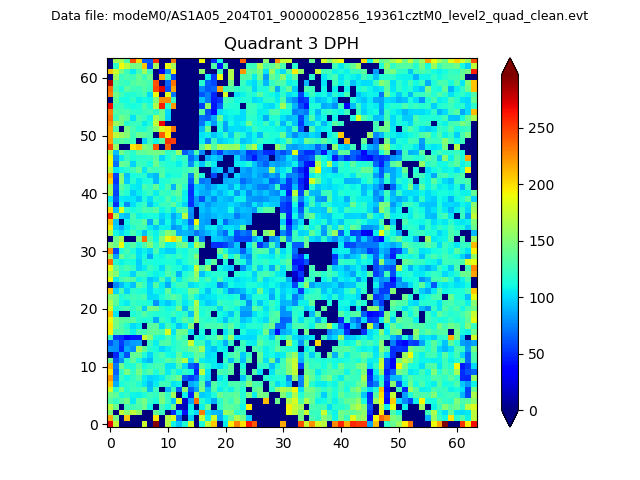 |
 |
Quadrant C |
| Plot type | Count rate plots | Images |
|---|---|---|
| Comparison with Poisson distribution Blue bars denote a histogram of data divided into 1 sec bins. Red curve is a Poisson curve with rate = median count rate of data. |
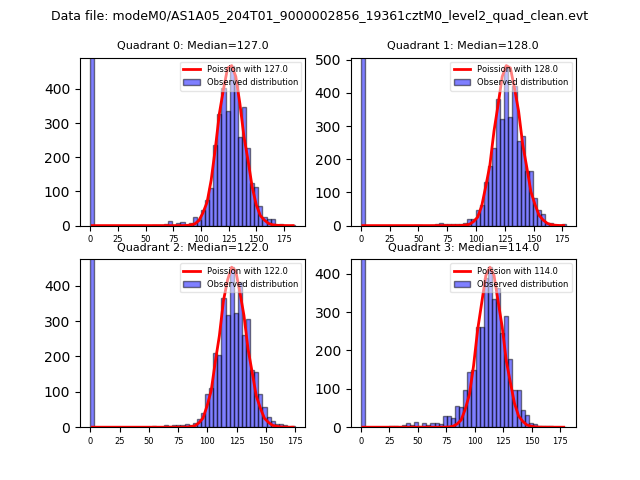 |
 |
| Quadrant-wise count rates Data is divided into 100 sec bins |
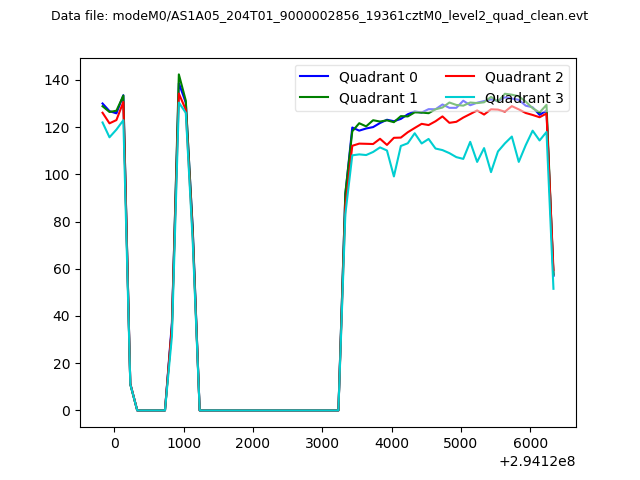 |
|
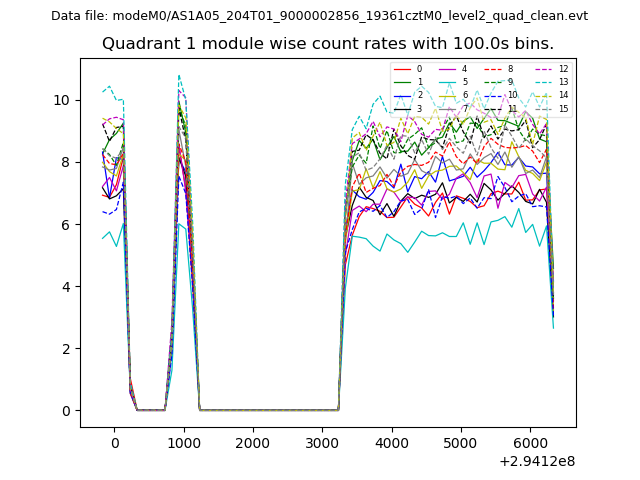
| Module-wise count rates for Quadrant A Data is divided into 100 sec bins |
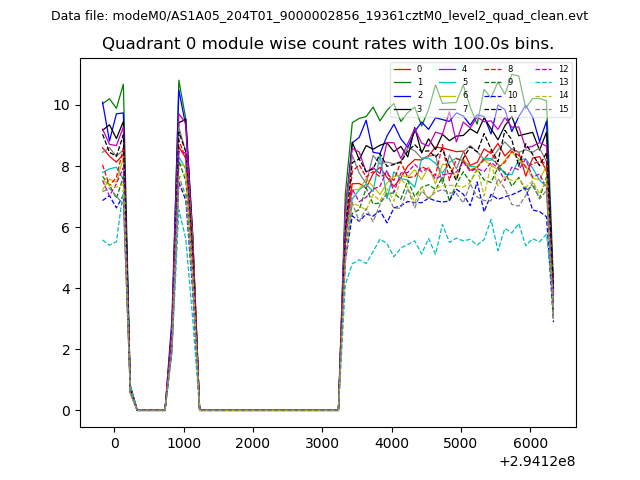 |
 |
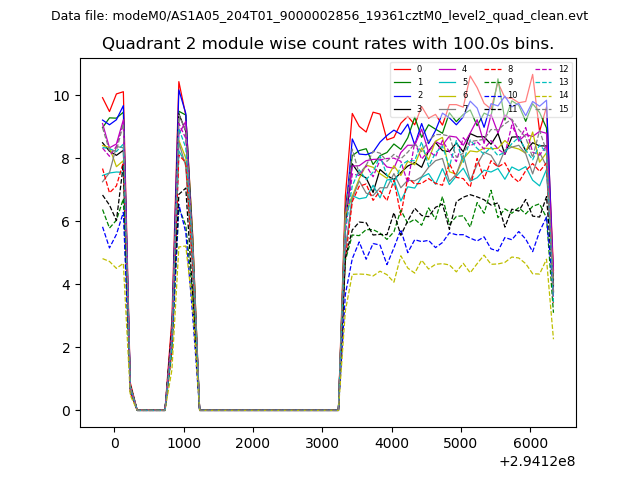
| Module-wise count rates for Quadrant B Data is divided into 100 sec bins |
 |
 |
| Module-wise count rates for Quadrant C Data is divided into 100 sec bins |
 |
 |
| Module-wise count rates for Quadrant D Data is divided into 100 sec bins |
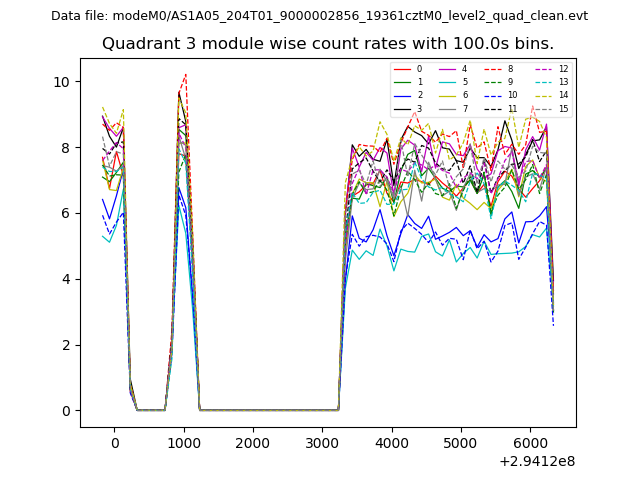 |
 |
| Parameter | Plot |
|---|---|
| CZT HV Monitor | 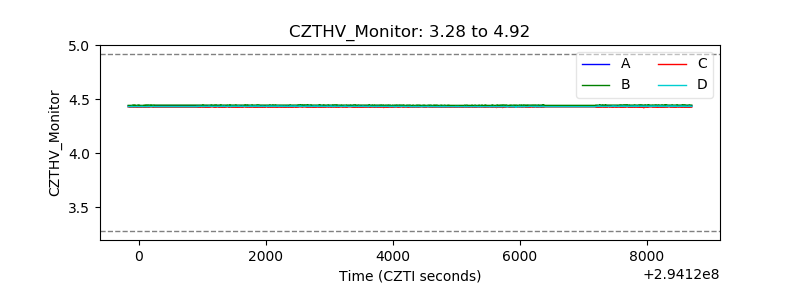 |
| D_VDD | 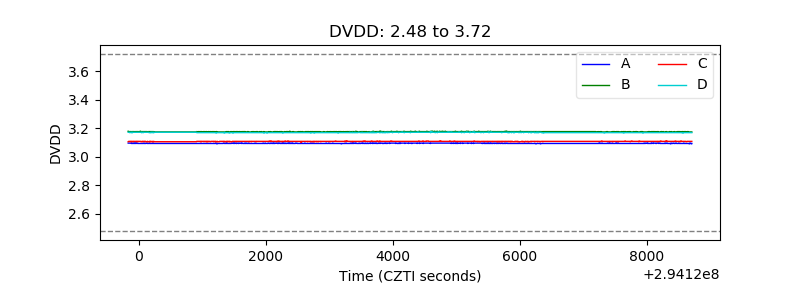 |
| Temperature 1 | 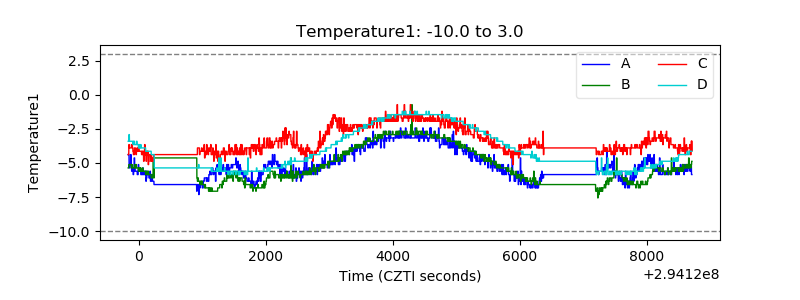 |
| Veto HV Monitor | 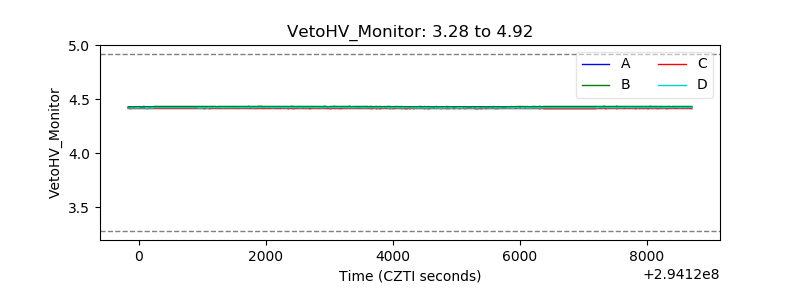 |
| Veto LLD | 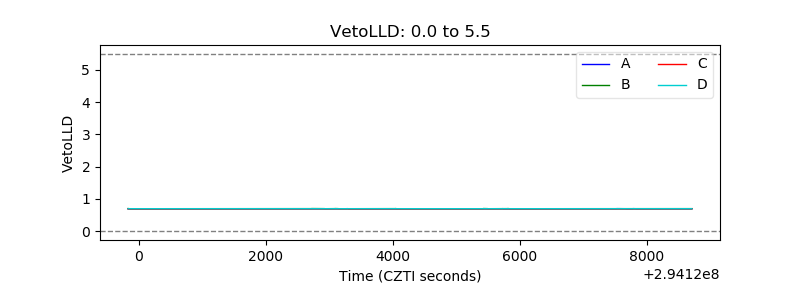 |
| Alpha Counter | 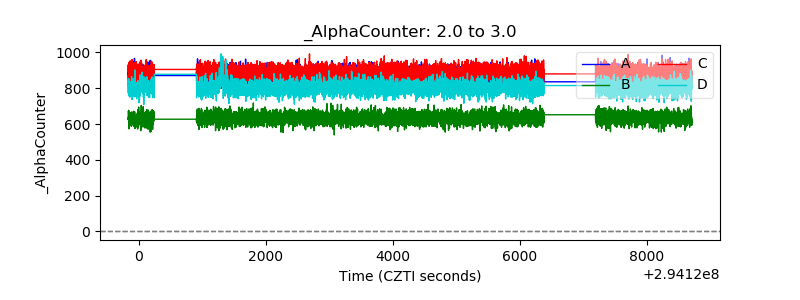 |
| _CPM_Rate |  |
| CZT Counter |  |
| +2.5 Volts monitor |  |
| +5 Volts monitor |  |
| _ROLL_ROT | 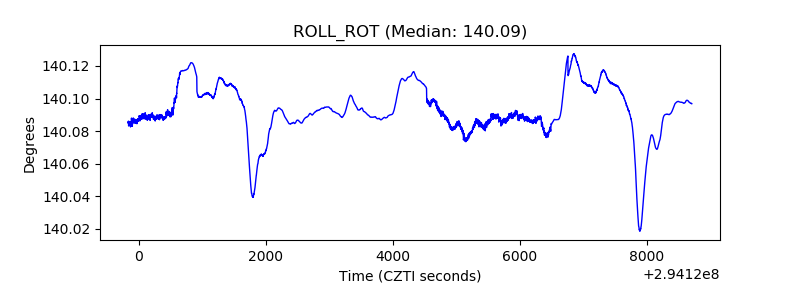 |
| _Roll_DEC | 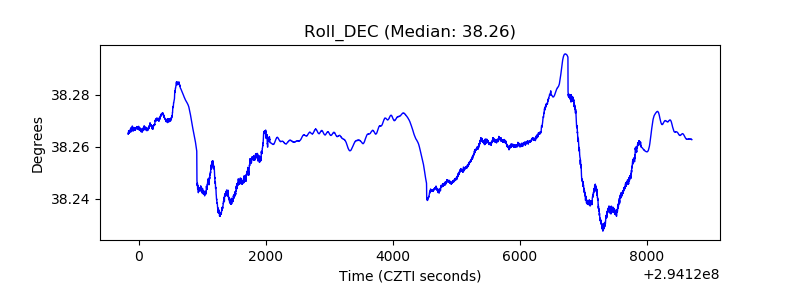 |
| _Roll_RA |  |
| Veto Counter | 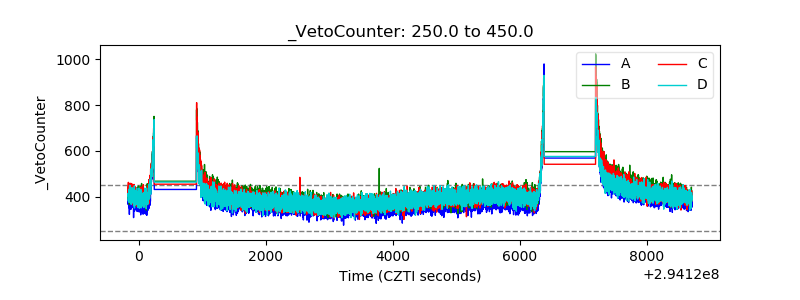 |