| Param | Original file | Final file |
|---|---|---|
| Filename | modeM0/AS1A05_204T01_9000002856_19362cztM0_level2.evt | modeM0/AS1A05_204T01_9000002856_19362cztM0_level2_quad_clean.evt |
| Size (bytes) | 370,926,720 | 32,610,240 |
| Size | 353.7 MB | 31.1 MB |
| Events in quadrant A | 1,615,313 | 212,153 |
| Events in quadrant B | 1,661,535 | 212,732 |
| Events in quadrant C | 1,608,279 | 200,966 |
| Events in quadrant D | 6,109,318 | 112,256 |
| Mode M0 | |||
|---|---|---|---|
| Quadrant | BADHDUFLAG | Total packets | Discarded packets |
| A | 0 | 7025 | 0 |
| B | 0 | 7117 | 0 |
| C | 0 | 7035 | 0 |
| D | 0 | 20595 | 0 |
| Mode SS | |||
|---|---|---|---|
| Quadrant | BADHDUFLAG | Total packets | Discarded packets |
| A | 0 | 70 | 0 |
| B | 0 | 70 | 0 |
| C | 0 | 70 | 0 |
| D | 0 | 70 | 0 |
| Quadrant | Total seconds | Saturated seconds | Saturation percentage |
|---|---|---|---|
| A | 3503 | 5 | 0.142735% |
| B | 3504 | 5 | 0.142694% |
| C | 3504 | 7 | 0.199772% |
| D | 3504 | 1733 | 49.457763% |
Noise dominated data is calculated using 1-second bins in cleaned event files. If a bin has >2000 counts, and if more than 50% of those come from <1% of pixels, then it is considered to be noise-dominated and hence unusable.
| Quadrant | # 1 sec bins | Bins with >0 counts | Bins with >2000 counts | High rate bins dominated by noise | Noise dominated (total time) | Noise dominated (detector-on time) | Marked lightcurve |
|---|---|---|---|---|---|---|---|
| A | 3503 | 3503 | 0 | 0 | 0.00% | 0.00% | 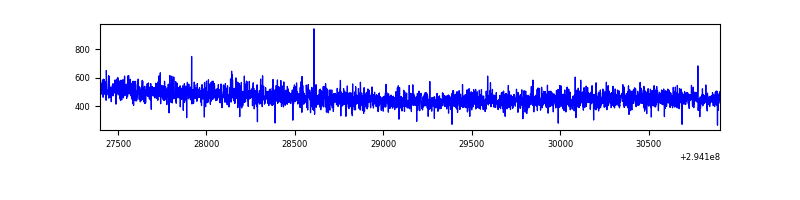 |
| B | 3504 | 3504 | 0 | 0 | 0.00% | 0.00% | 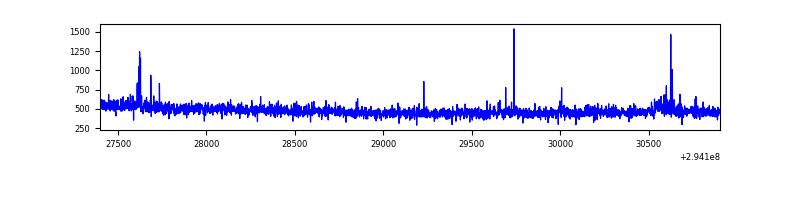 |
| C | 3504 | 3504 | 0 | 0 | 0.00% | 0.00% | 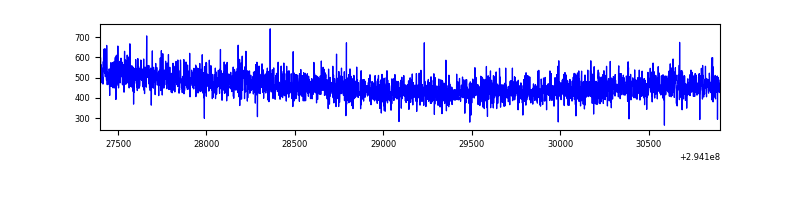 |
| D | 3504 | 3504 | 1603 | 1603 | 45.75% | 45.75% | 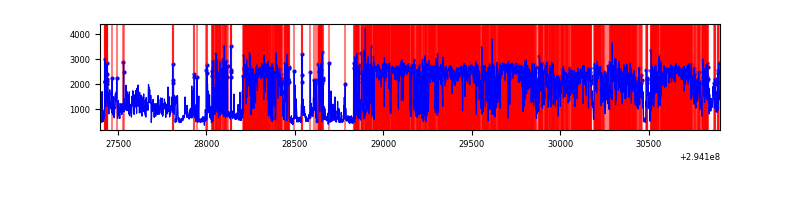 |
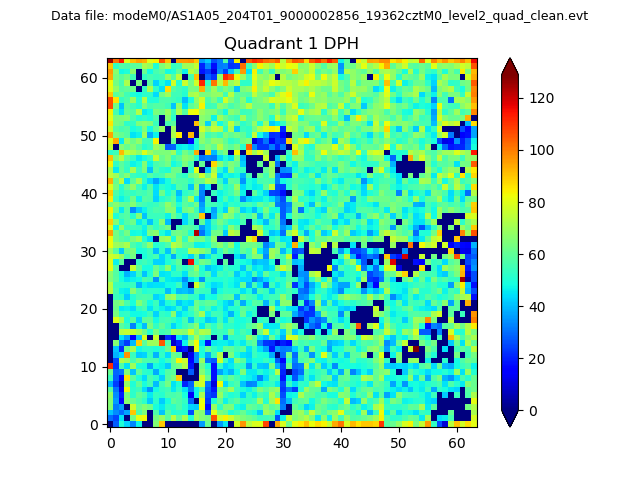
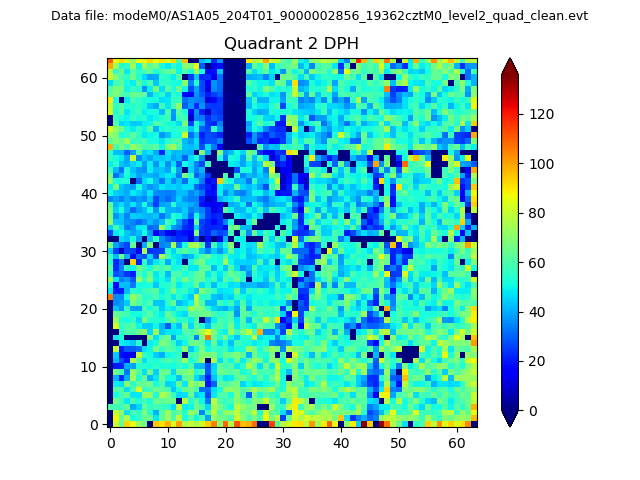
Top three noisy pixels from each quadrant. If the there are fewer than three noisy pixels in the level2.evt file, extra rows are filled as -1
| Pixel properties | Quadrant properties | ||||||
|---|---|---|---|---|---|---|---|
| Quadrant | DetID | PixID | Counts | Sigma | Mean | Median | Sigma |
| A | 13 | 254 | 3907 | 40.66 | 419 | 411 | 86.0 |
| A | 0 | 226 | 3660 | 37.79 | 419 | 411 | 86.0 |
| A | 3 | 137 | 3377 | 34.5 | 419 | 411 | 86.0 |
| B | 0 | 190 | 17407 | 211.07 | 416 | 406 | 80.5 |
| B | 12 | 111 | 9801 | 116.64 | 416 | 406 | 80.5 |
| B | 11 | 111 | 8793 | 104.13 | 416 | 406 | 80.5 |
| C | 14 | 238 | 63161 | 672.35 | 394 | 397 | 93.4 |
| C | 3 | 233 | 6562 | 66.04 | 394 | 397 | 93.4 |
| C | 13 | 61 | 2763 | 25.35 | 394 | 397 | 93.4 |
| D | 10 | 66 | 2489710 | 33263.39 | 300 | 292 | 74.8 |
| D | 7 | 238 | 2346362 | 31347.99 | 300 | 292 | 74.8 |
| D | 11 | 176 | 59545 | 791.73 | 300 | 292 | 74.8 |
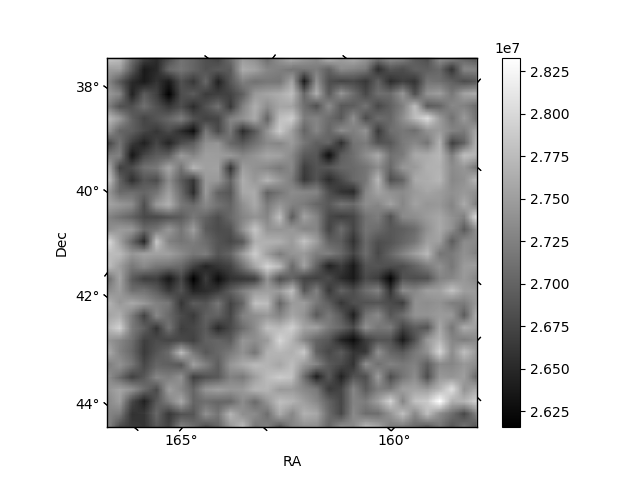
Histogram calculated using DETX and DETY for each event in the final _common_clean file
| Quadrant A | 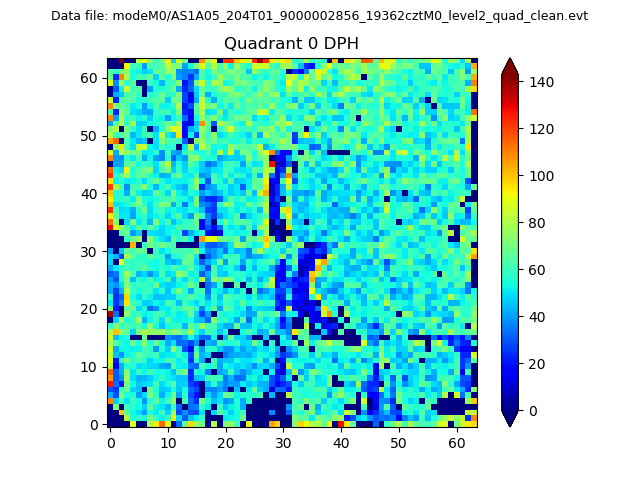 |
 |
Quadrant B |
|---|---|---|---|
| Quadrant D | 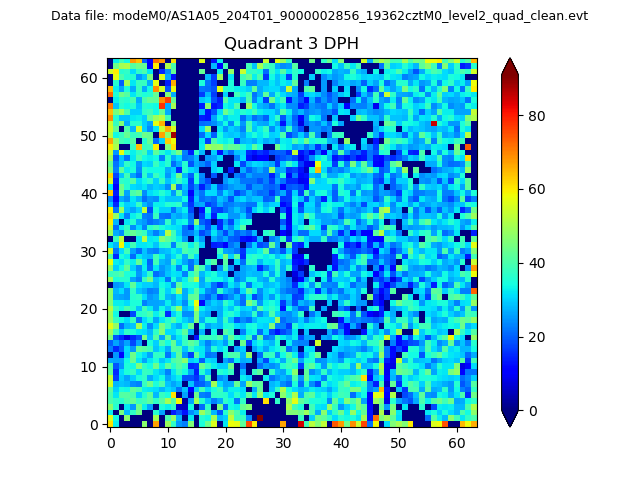 |
 |
Quadrant C |
| Plot type | Count rate plots | Images |
|---|---|---|
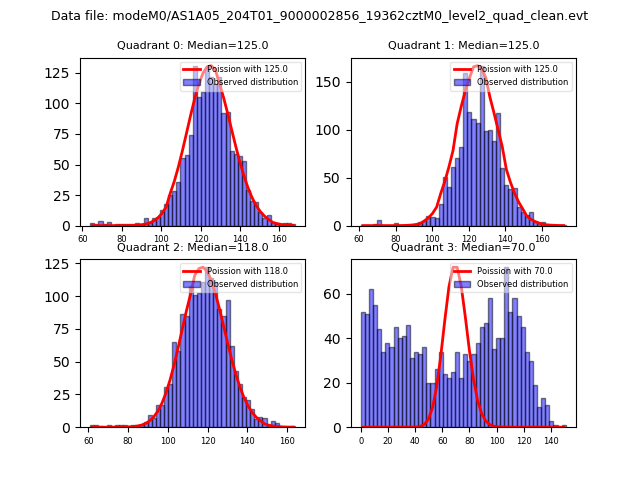
| Comparison with Poisson distribution Blue bars denote a histogram of data divided into 1 sec bins. Red curve is a Poisson curve with rate = median count rate of data. |
 |
 |
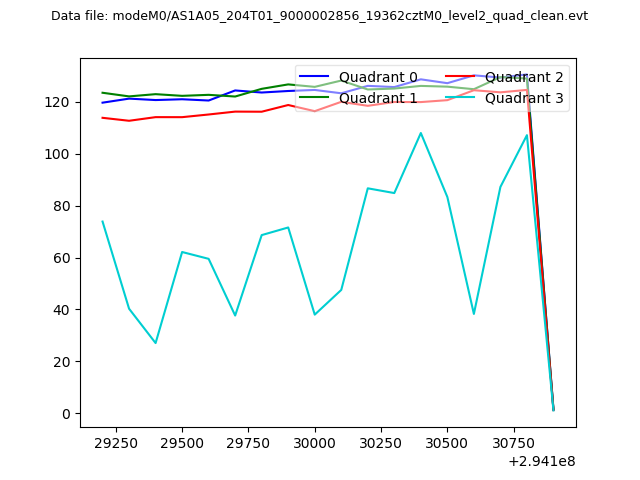
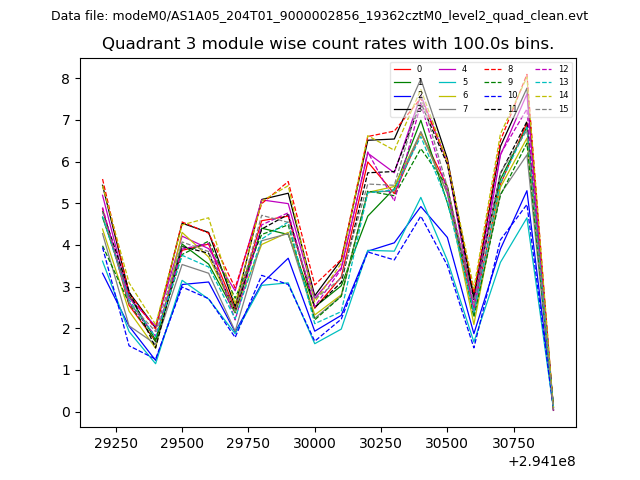
| Quadrant-wise count rates Data is divided into 100 sec bins |
 |
|
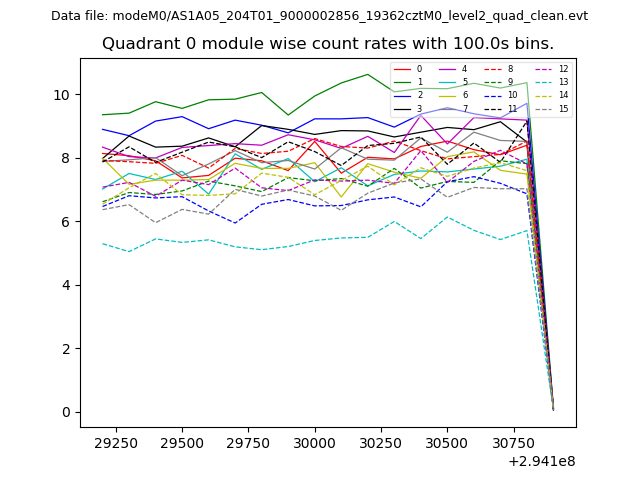
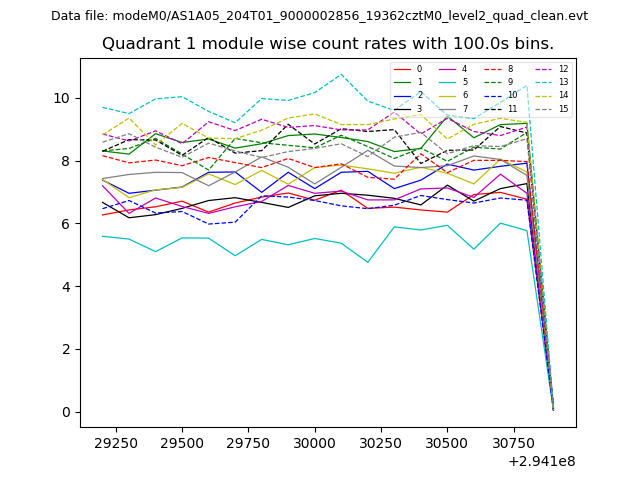
| Module-wise count rates for Quadrant A Data is divided into 100 sec bins |
 |
 |
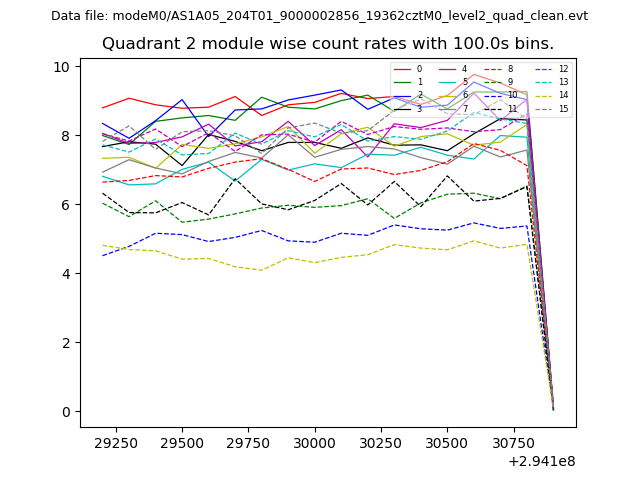
| Module-wise count rates for Quadrant B Data is divided into 100 sec bins |
 |
 |
| Module-wise count rates for Quadrant C Data is divided into 100 sec bins |
 |
 |
| Module-wise count rates for Quadrant D Data is divided into 100 sec bins |
 |
 |
| Parameter | Plot |
|---|---|
| CZT HV Monitor | 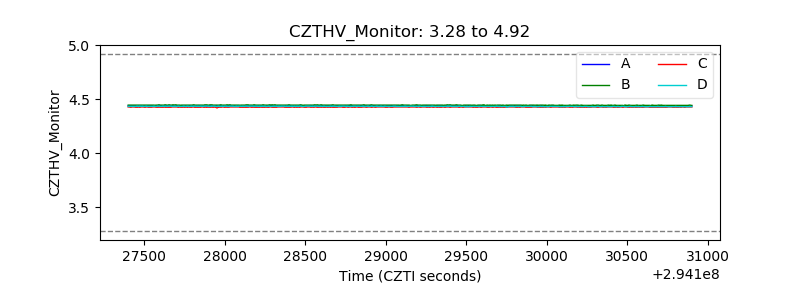 |
| D_VDD | 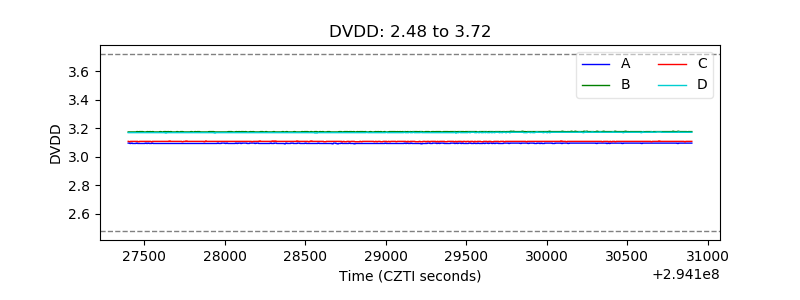 |
| Temperature 1 | 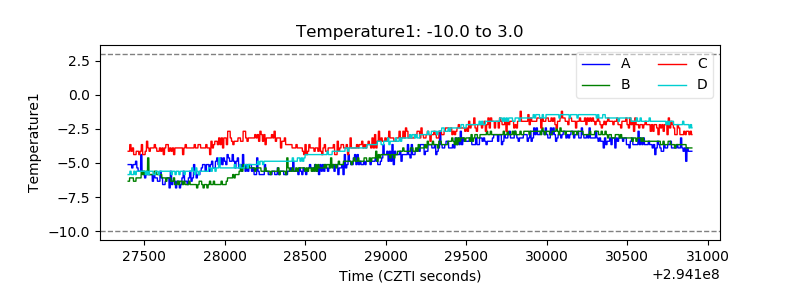 |
| Veto HV Monitor | 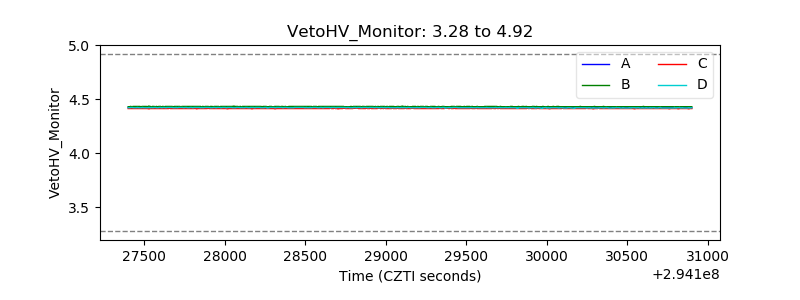 |
| Veto LLD | 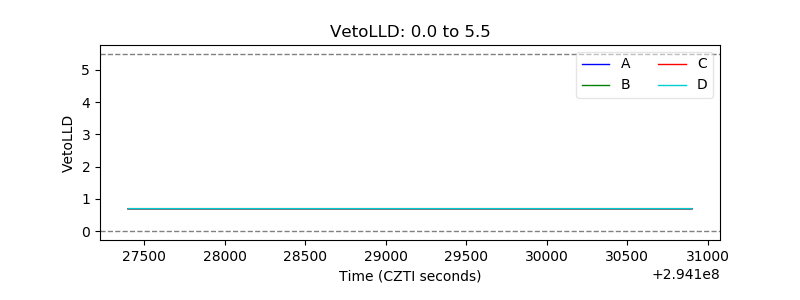 |
| Alpha Counter | 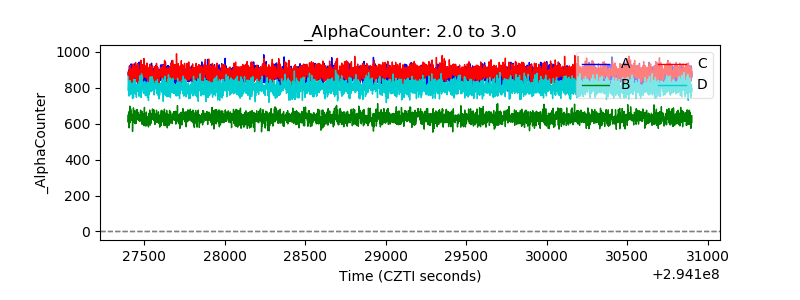 |
| _CPM_Rate | 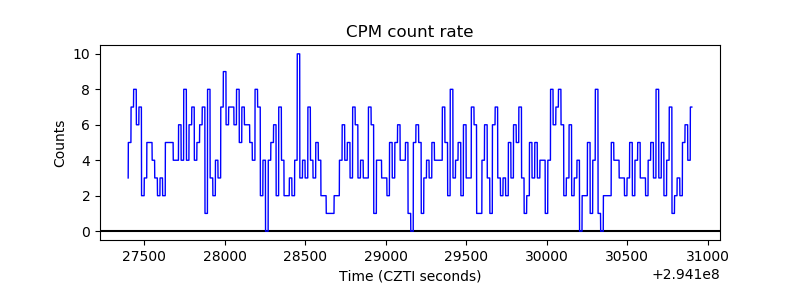 |
| CZT Counter |  |
| +2.5 Volts monitor |  |
| +5 Volts monitor |  |
| _ROLL_ROT | 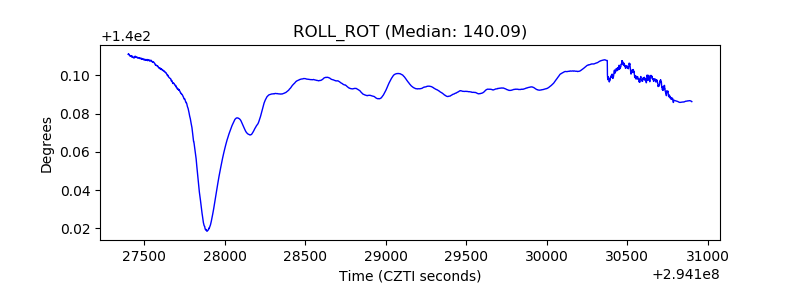 |
| _Roll_DEC | 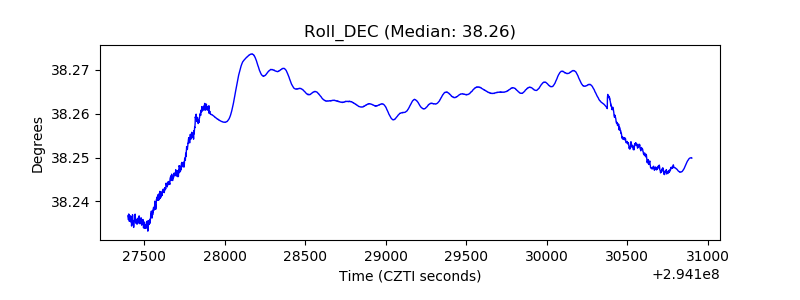 |
| _Roll_RA |  |
| Veto Counter | 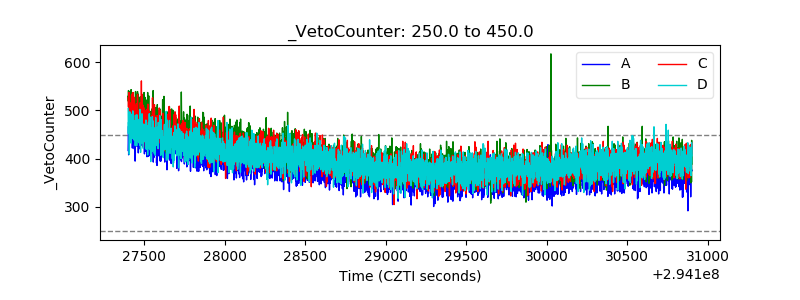 |