| Param | Original file | Final file |
|---|---|---|
| Filename | modeM0/AS1T03_099T03_9000002854cztM0_level2.fits | modeM0/AS1T03_099T03_9000002854cztM0_level2_quad_clean.evt |
| Size (bytes) | 467,881,920 | 418,250,880 |
| Size | 446.2 MB | 398.9 MB |
| Events in quadrant A | 2,946,214 | 2,502,887 |
| Events in quadrant B | 2,803,802 | 2,490,523 |
| Events in quadrant C | 2,814,456 | 2,361,080 |
| Events in quadrant D | 2,343,066 | 2,050,345 |
| Mode SS | |||
|---|---|---|---|
| Quadrant | BADHDUFLAG | Total packets | Discarded packets |
| A | 0 | 970 | 0 |
| B | 0 | 970 | 0 |
| C | 0 | 970 | 0 |
| D | 0 | 970 | 0 |
| Mode M9 | |||
|---|---|---|---|
| Quadrant | BADHDUFLAG | Total packets | Discarded packets |
| A | 0 | 96 | 0 |
| B | 0 | 96 | 0 |
| C | 0 | 96 | 0 |
| D | 0 | 96 | 0 |
| Mode M0 | |||
|---|---|---|---|
| Quadrant | BADHDUFLAG | Total packets | Discarded packets |
| A | 0 | 99642 | 0 |
| B | 0 | 101510 | 0 |
| C | 0 | 99051 | 0 |
| D | 0 | 146025 | 0 |
| Quadrant | Total seconds | Saturated seconds | Saturation percentage |
|---|---|---|---|
| A | 47505 | 500 | 1.052521% |
| B | 47505 | 674 | 1.418798% |
| C | 47505 | 659 | 1.387222% |
| D | 47505 | 4870 | 10.251552% |
Noise dominated data is calculated using 1-second bins in cleaned event files. If a bin has >2000 counts, and if more than 50% of those come from <1% of pixels, then it is considered to be noise-dominated and hence unusable.
| Quadrant | # 1 sec bins | Bins with >0 counts | Bins with >2000 counts | High rate bins dominated by noise | Noise dominated (total time) | Noise dominated (detector-on time) | Marked lightcurve |
|---|---|---|---|---|---|---|---|
| A | 57220 | 47497 | 0 | 0 | 0.00% | 0.00% | 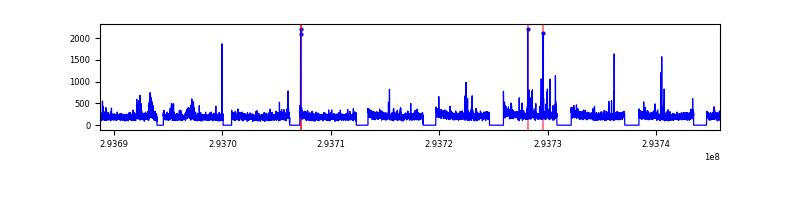 |
| B | 57220 | 47497 | 0 | 0 | 0.00% | 0.00% |  |
| C | 57220 | 47500 | 0 | 0 | 0.00% | 0.00% | 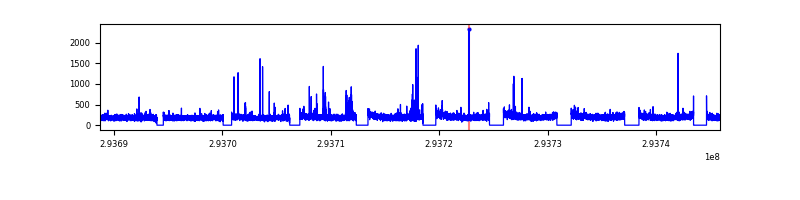 |
| D | 57220 | 47250 | 0 | 0 | 0.00% | 0.00% | 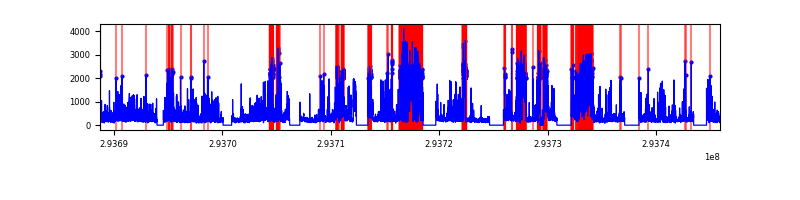 |
Top three noisy pixels from each quadrant. If the there are fewer than three noisy pixels in the level2.evt file, extra rows are filled as -1
| Pixel properties | Quadrant properties | ||||||
|---|---|---|---|---|---|---|---|
| Quadrant | DetID | PixID | Counts | Sigma | Mean | Median | Sigma |
| A | 0 | 29 | 2781 | 10.76 | 768 | 725 | 191.0 |
| A | 7 | 110 | 2309 | 8.29 | 768 | 725 | 191.0 |
| A | 9 | 19 | 2171 | 7.57 | 768 | 725 | 191.0 |
| B | 2 | 9 | 2275 | 10.83 | 741 | 710 | 144.6 |
| B | 2 | 8 | 1864 | 7.98 | 741 | 710 | 144.6 |
| B | 3 | 17 | 1839 | 7.81 | 741 | 710 | 144.6 |
| C | 1 | 80 | 2144 | 7.66 | 743 | 698 | 188.8 |
| C | 1 | 81 | 2129 | 7.58 | 743 | 698 | 188.8 |
| C | 3 | 126 | 1941 | 6.58 | 743 | 698 | 188.8 |
| D | 10 | 190 | 1761 | 6.47 | 669 | 611 | 177.7 |
| D | 7 | 3 | 1691 | 6.08 | 669 | 611 | 177.7 |
| D | 6 | 231 | 1674 | 5.98 | 669 | 611 | 177.7 |
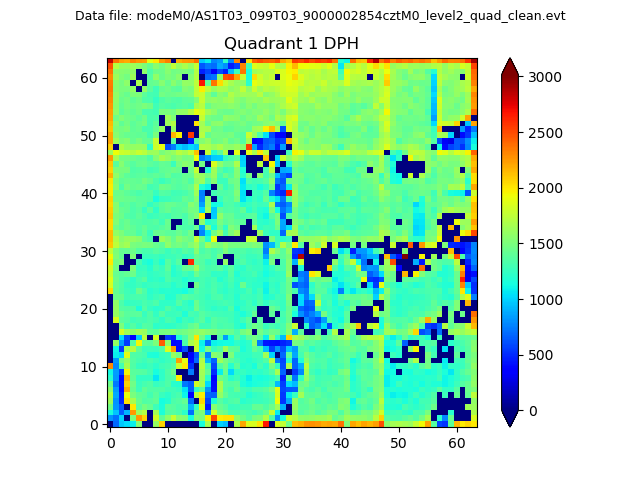
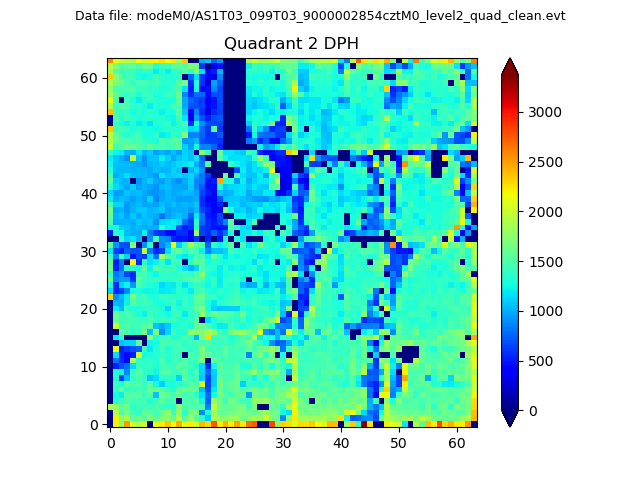
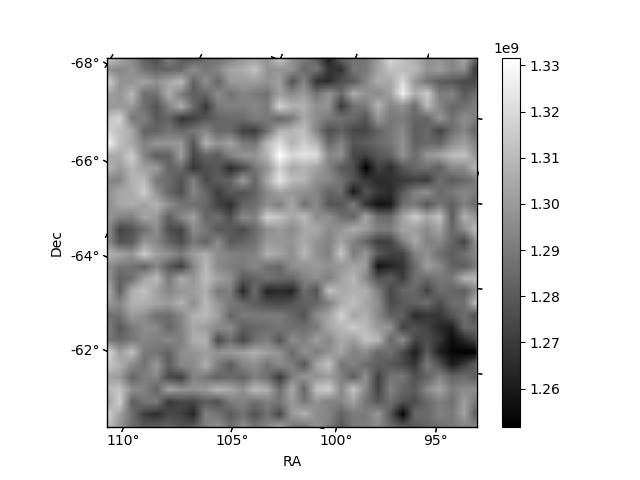
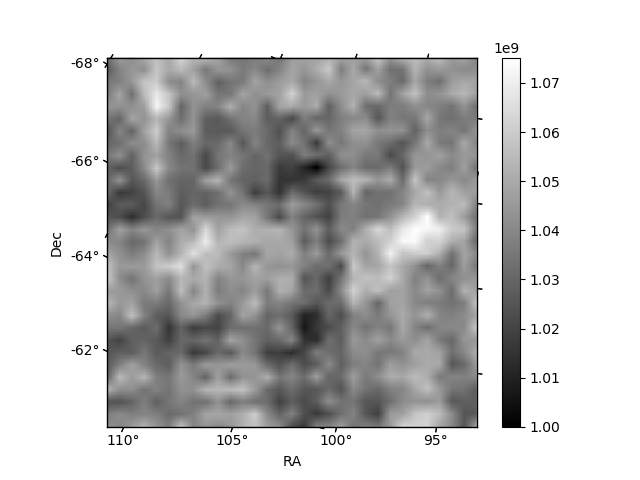
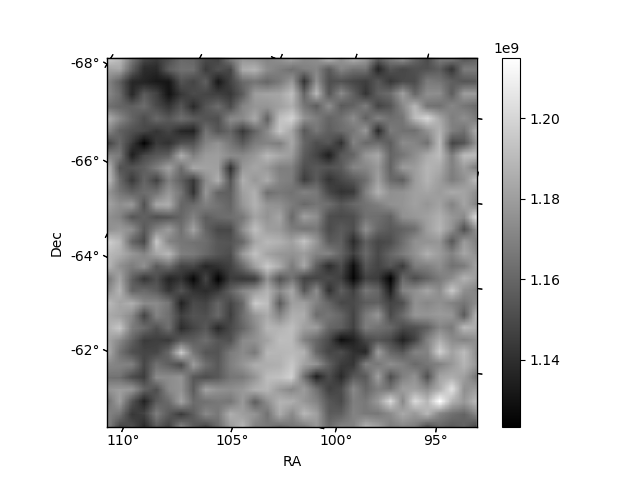
Histogram calculated using DETX and DETY for each event in the final _common_clean file
| Quadrant A | 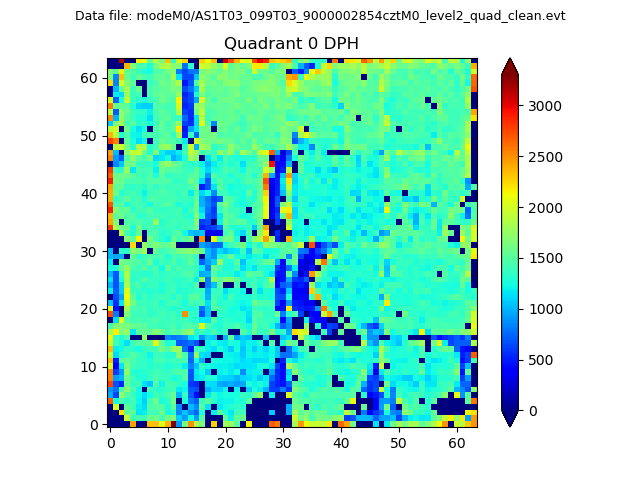 |
 |
Quadrant B |
|---|---|---|---|
| Quadrant D | 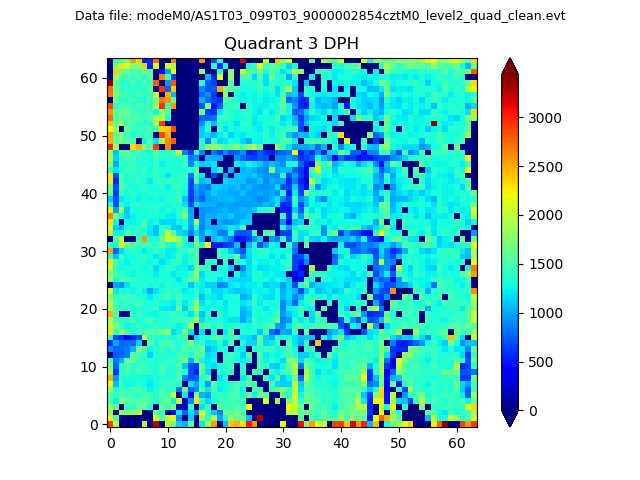 |
 |
Quadrant C |
| Plot type | Count rate plots | Images |
|---|---|---|
| Comparison with Poisson distribution Blue bars denote a histogram of data divided into 1 sec bins. Red curve is a Poisson curve with rate = median count rate of data. |
 |
 |
| Quadrant-wise count rates Data is divided into 100 sec bins |
 |
|
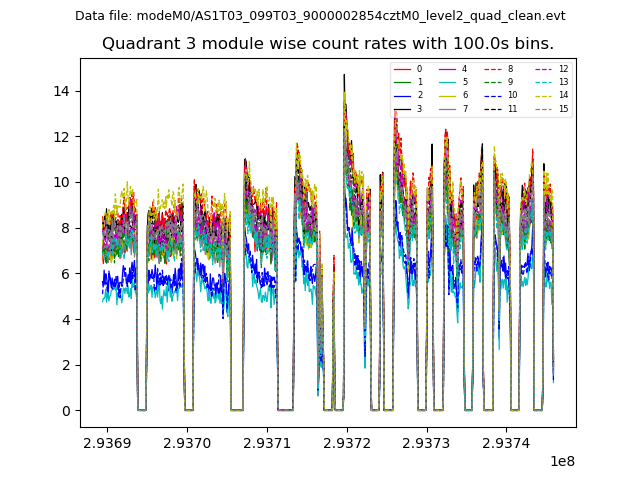
| Module-wise count rates for Quadrant A Data is divided into 100 sec bins |
 |
 |
| Module-wise count rates for Quadrant B Data is divided into 100 sec bins |
 |
 |
| Module-wise count rates for Quadrant C Data is divided into 100 sec bins |
 |
 |
| Module-wise count rates for Quadrant D Data is divided into 100 sec bins |
 |
 |
| Parameter | Plot |
|---|---|
| CZT HV Monitor | 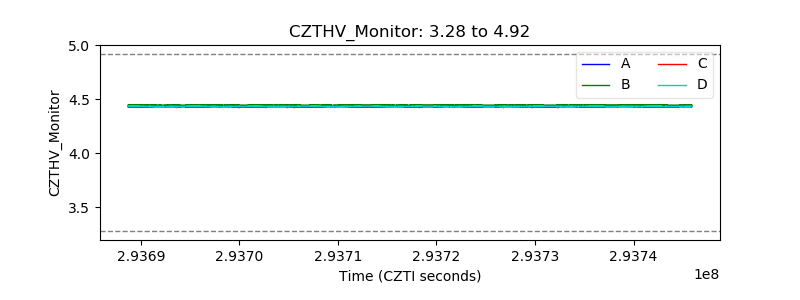 |
| D_VDD | 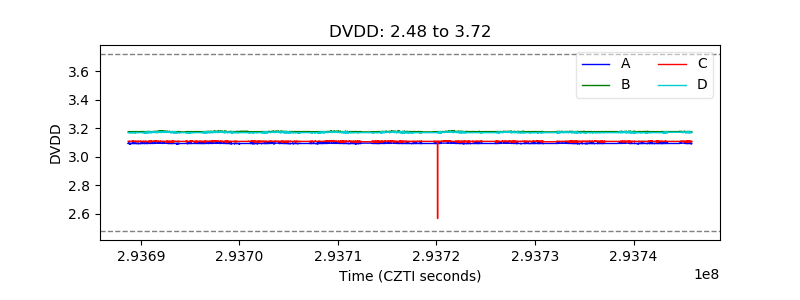 |
| Temperature 1 | 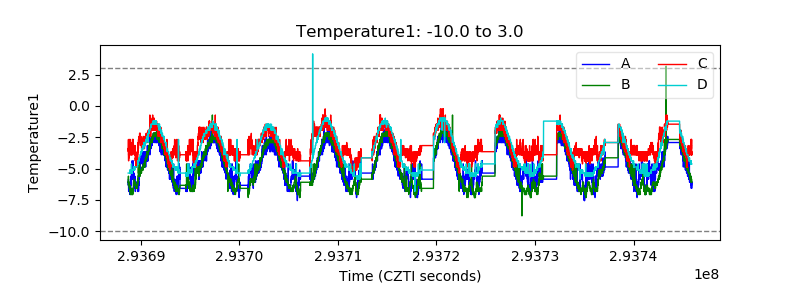 |
| Veto HV Monitor | 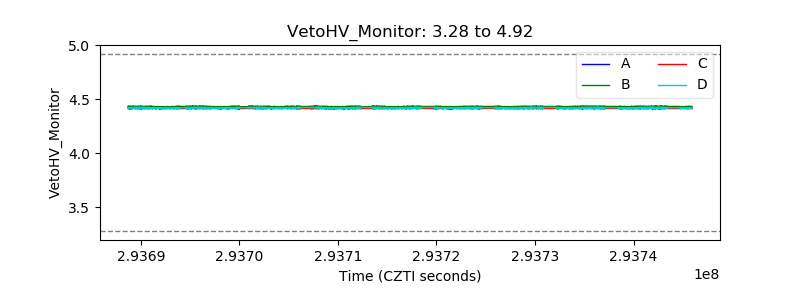 |
| Veto LLD | 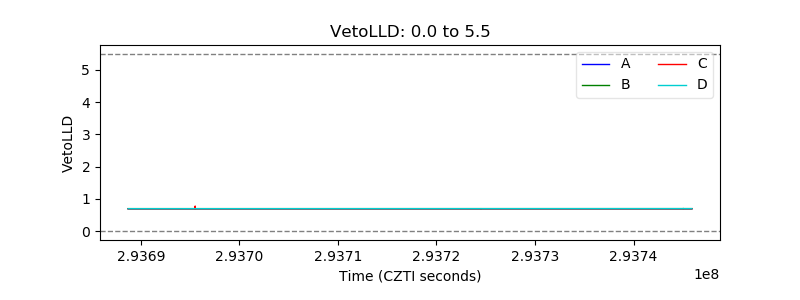 |
| Alpha Counter | 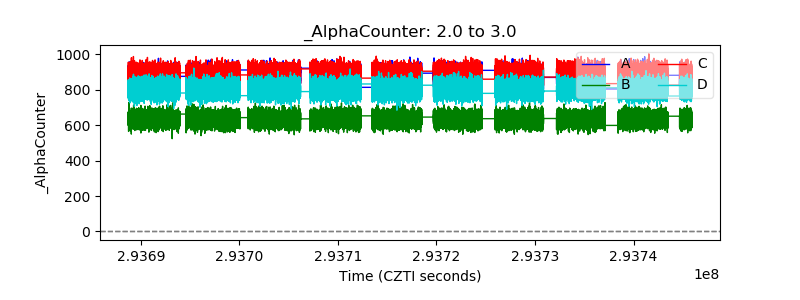 |
| _CPM_Rate | 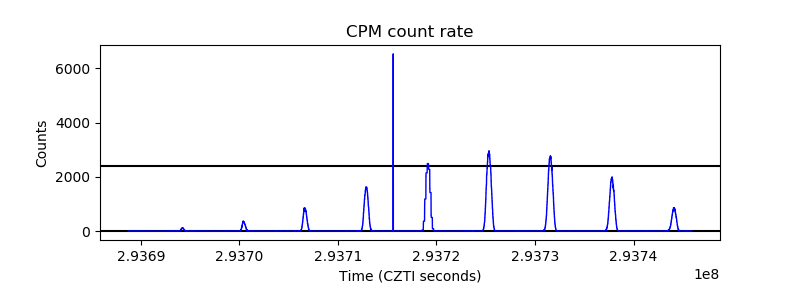 |
| CZT Counter | 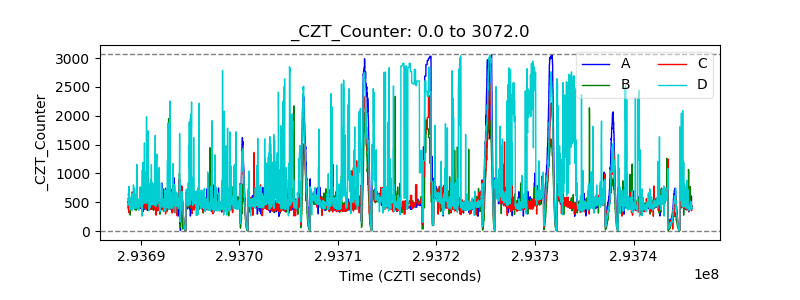 |
| +2.5 Volts monitor |  |
| +5 Volts monitor |  |
| _ROLL_ROT | 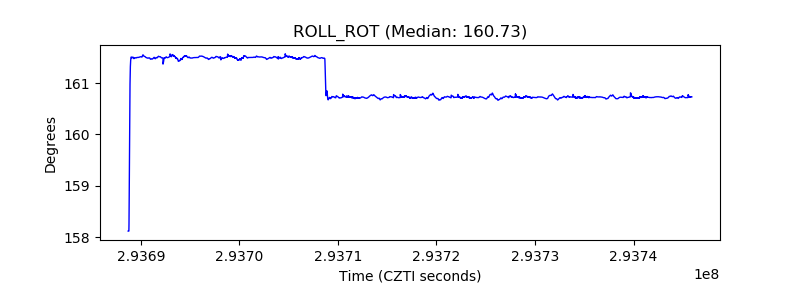 |
| _Roll_DEC | 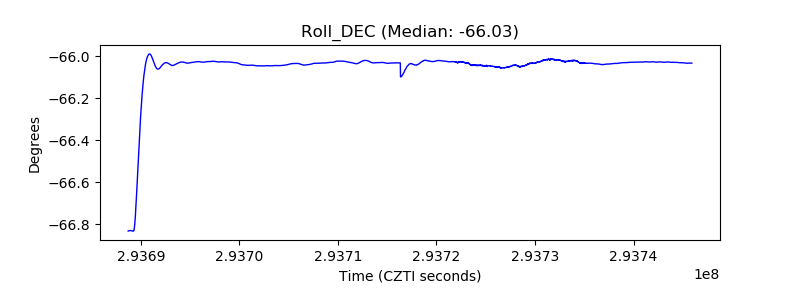 |
| _Roll_RA | 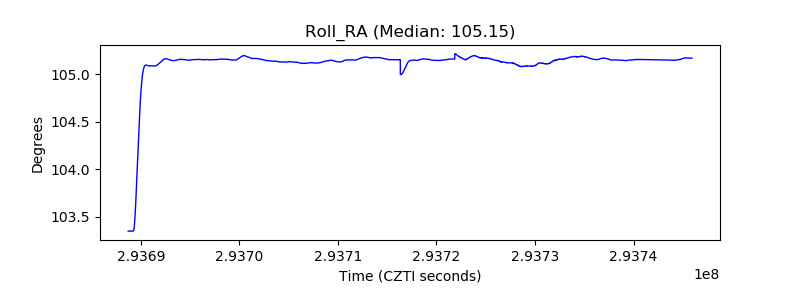 |
| Veto Counter |  |