| Param | Original file | Final file |
|---|---|---|
| Filename | modeM0/AS1T03_099T03_9000002854_19286cztM0_level2.evt | modeM0/AS1T03_099T03_9000002854_19286cztM0_level2_quad_clean.evt |
| Size (bytes) | 73,002,240 | 13,861,440 |
| Size | 69.6 MB | 13.2 MB |
| Events in quadrant A | 497,438 | 85,060 |
| Events in quadrant B | 506,813 | 87,956 |
| Events in quadrant C | 521,099 | 81,245 |
| Events in quadrant D | 605,934 | 79,504 |
| Mode SS | |||
|---|---|---|---|
| Quadrant | BADHDUFLAG | Total packets | Discarded packets |
| A | 0 | 22 | 0 |
| B | 0 | 22 | 0 |
| C | 0 | 22 | 0 |
| D | 0 | 22 | 0 |
| Mode M0 | |||
|---|---|---|---|
| Quadrant | BADHDUFLAG | Total packets | Discarded packets |
| A | 0 | 2256 | 0 |
| B | 0 | 2252 | 0 |
| C | 0 | 2258 | 0 |
| D | 0 | 2542 | 0 |
| Quadrant | Total seconds | Saturated seconds | Saturation percentage |
|---|---|---|---|
| A | 1125 | 0 | 0.000000% |
| B | 1125 | 1 | 0.088889% |
| C | 1125 | 10 | 0.888889% |
| D | 1125 | 8 | 0.711111% |
Noise dominated data is calculated using 1-second bins in cleaned event files. If a bin has >2000 counts, and if more than 50% of those come from <1% of pixels, then it is considered to be noise-dominated and hence unusable.
| Quadrant | # 1 sec bins | Bins with >0 counts | Bins with >2000 counts | High rate bins dominated by noise | Noise dominated (total time) | Noise dominated (detector-on time) | Marked lightcurve |
|---|---|---|---|---|---|---|---|
| A | 1125 | 1125 | 0 | 0 | 0.00% | 0.00% | 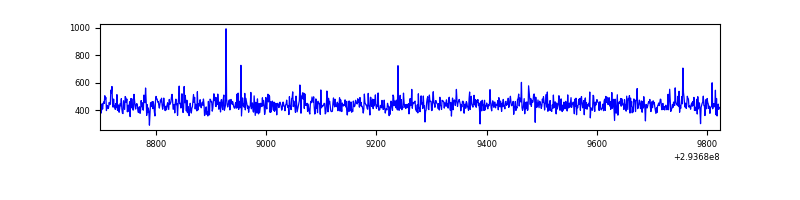 |
| B | 1125 | 1125 | 0 | 0 | 0.00% | 0.00% | 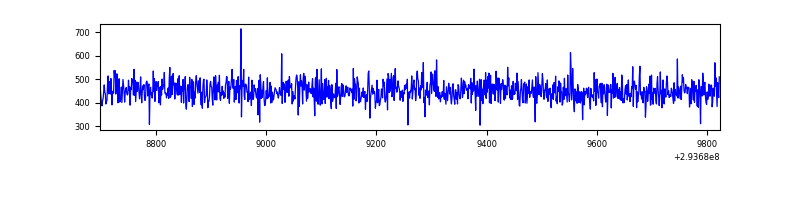 |
| C | 1125 | 1125 | 0 | 0 | 0.00% | 0.00% | 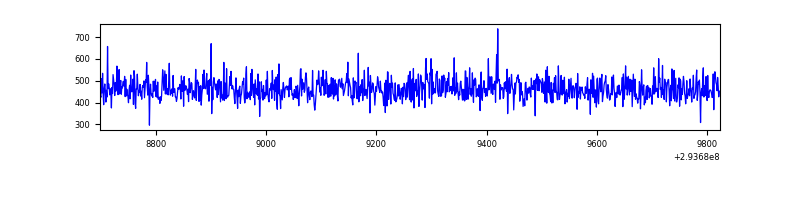 |
| D | 1125 | 1125 | 5 | 5 | 0.44% | 0.44% | 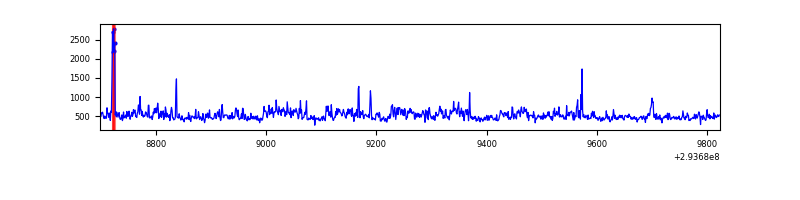 |
Top three noisy pixels from each quadrant. If the there are fewer than three noisy pixels in the level2.evt file, extra rows are filled as -1
| Pixel properties | Quadrant properties | ||||||
|---|---|---|---|---|---|---|---|
| Quadrant | DetID | PixID | Counts | Sigma | Mean | Median | Sigma |
| A | 11 | 29 | 2047 | 68.31 | 128 | 125 | 28.1 |
| A | 13 | 254 | 1627 | 53.38 | 128 | 125 | 28.1 |
| A | 4 | 2 | 1400 | 45.31 | 128 | 125 | 28.1 |
| B | 12 | 111 | 3067 | 110.67 | 129 | 125 | 26.6 |
| B | 11 | 111 | 2646 | 94.84 | 129 | 125 | 26.6 |
| B | 14 | 111 | 2347 | 83.59 | 129 | 125 | 26.6 |
| C | 14 | 238 | 19898 | 634.82 | 127 | 127 | 31.1 |
| C | 0 | 207 | 2673 | 81.75 | 127 | 127 | 31.1 |
| C | 3 | 233 | 2594 | 79.21 | 127 | 127 | 31.1 |
| D | 10 | 66 | 94750 | 2872.93 | 125 | 121 | 32.9 |
| D | 1 | 52 | 35095 | 1061.81 | 125 | 121 | 32.9 |
| D | 2 | 234 | 4693 | 138.81 | 125 | 121 | 32.9 |
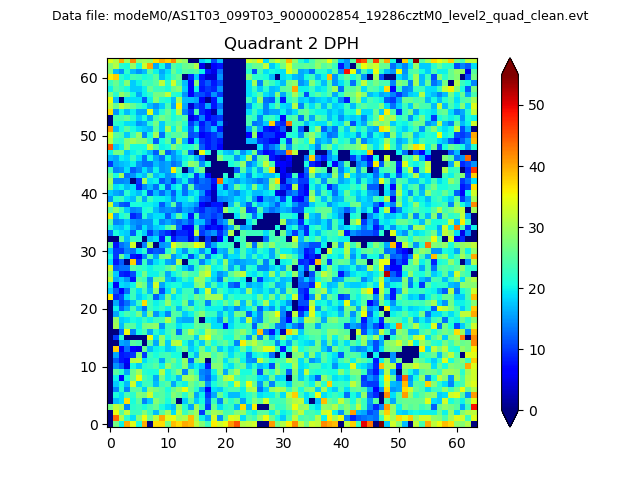
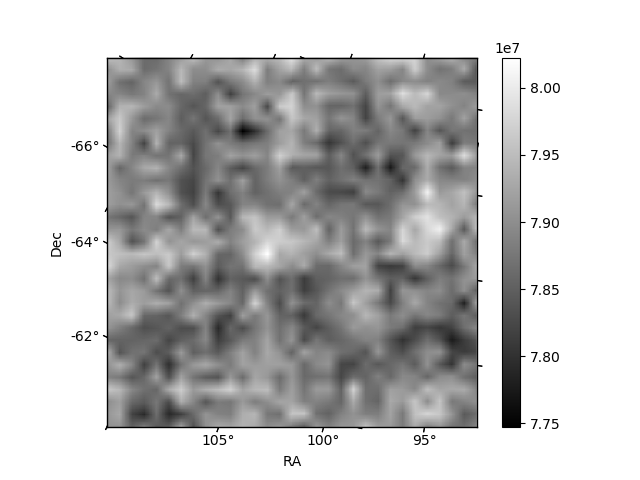
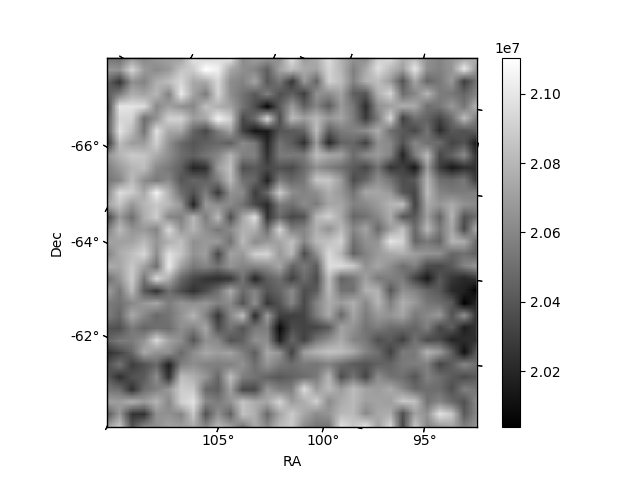
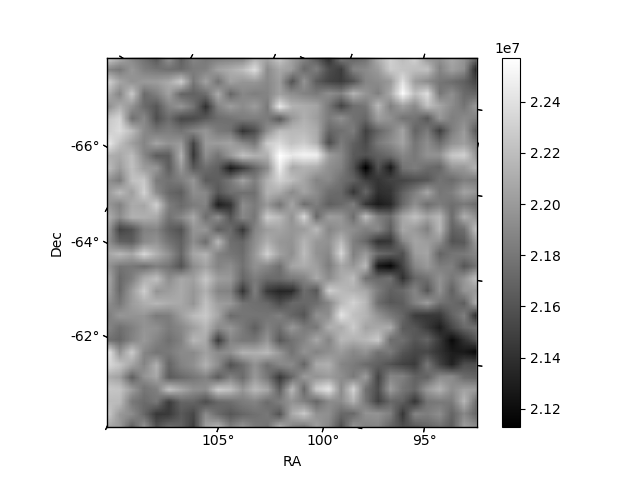
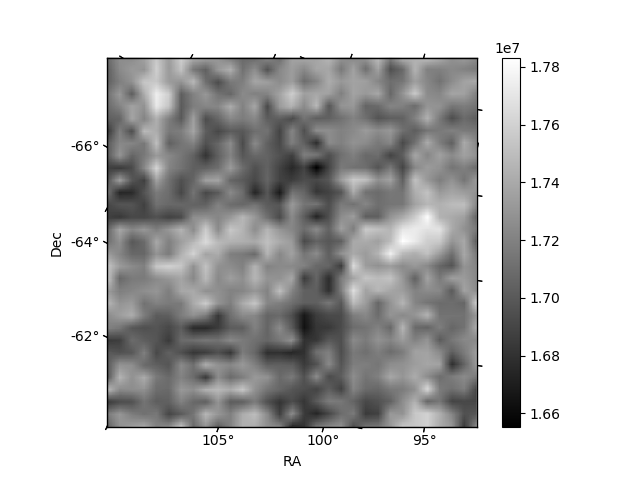
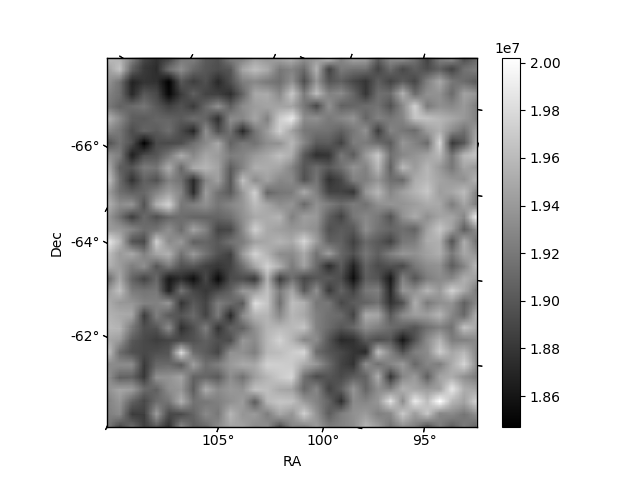
Histogram calculated using DETX and DETY for each event in the final _common_clean file
| Quadrant A | 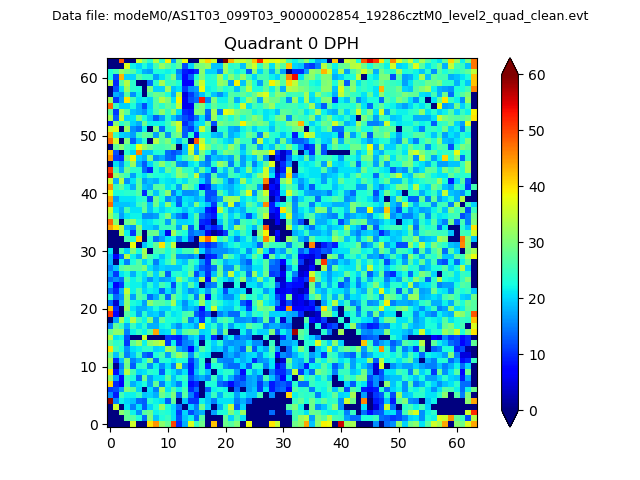 |
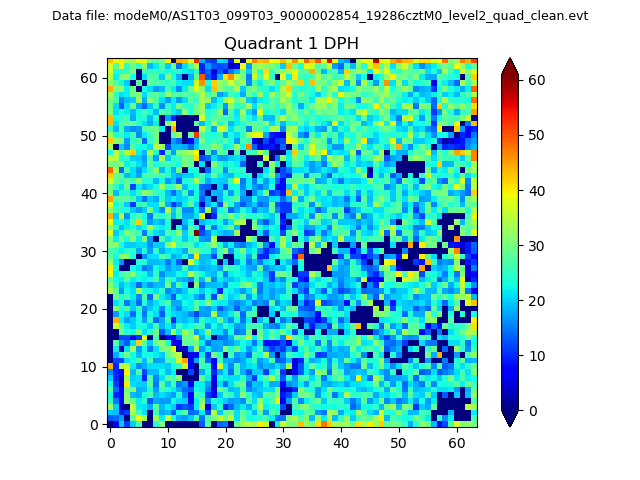 |
Quadrant B |
|---|---|---|---|
| Quadrant D | 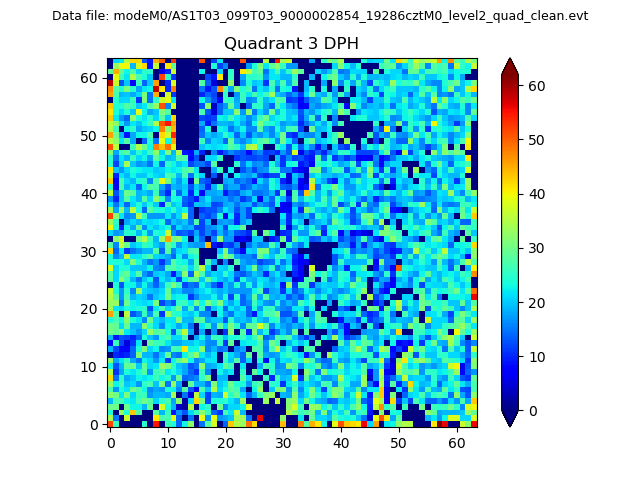 |
 |
Quadrant C |
| Plot type | Count rate plots | Images |
|---|---|---|
| Comparison with Poisson distribution Blue bars denote a histogram of data divided into 1 sec bins. Red curve is a Poisson curve with rate = median count rate of data. |
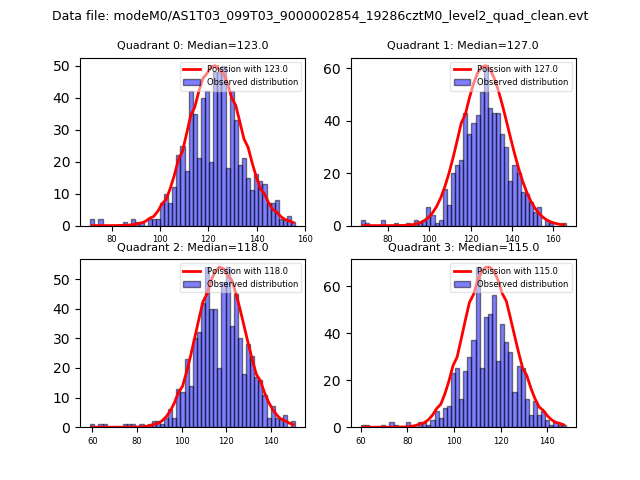 |
 |
| Quadrant-wise count rates Data is divided into 100 sec bins |
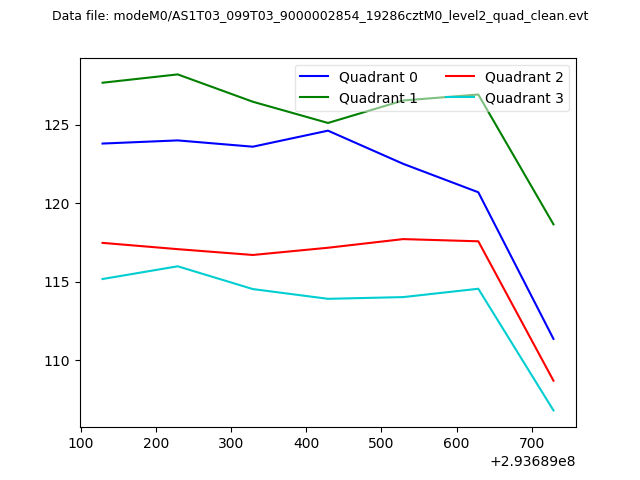 |
|
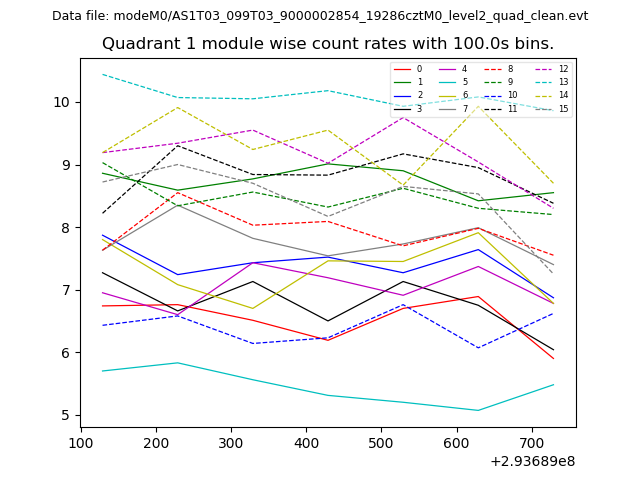
| Module-wise count rates for Quadrant A Data is divided into 100 sec bins |
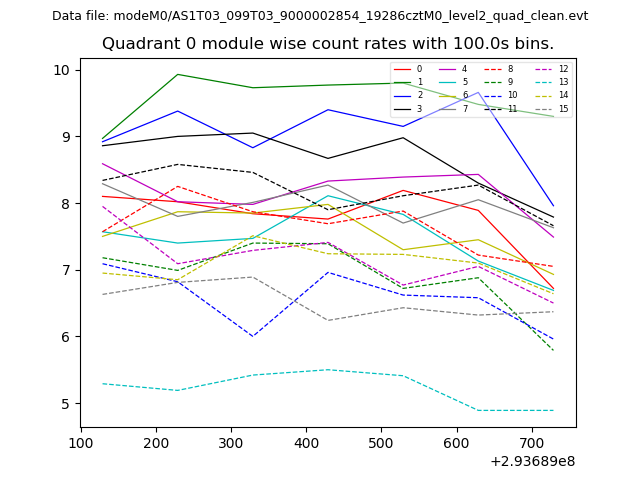 |
 |
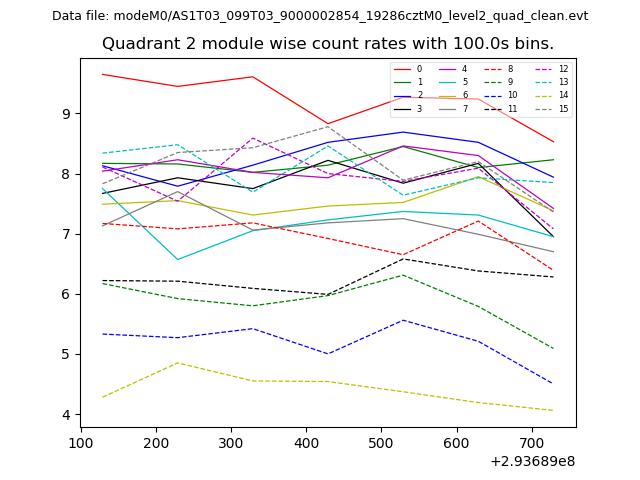
| Module-wise count rates for Quadrant B Data is divided into 100 sec bins |
 |
 |
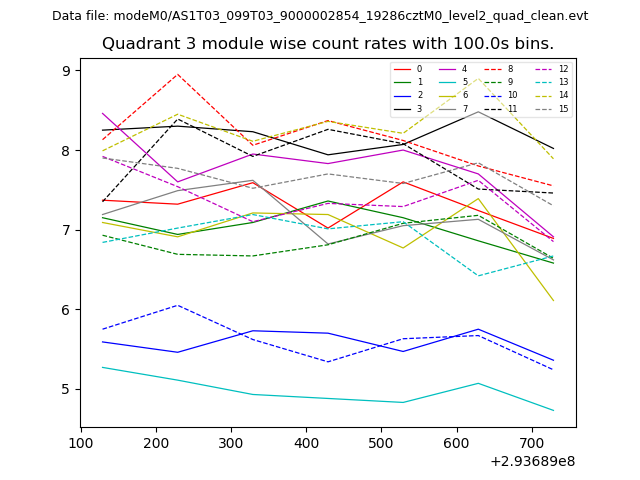
| Module-wise count rates for Quadrant C Data is divided into 100 sec bins |
 |
 |
| Module-wise count rates for Quadrant D Data is divided into 100 sec bins |
 |
 |
| Parameter | Plot |
|---|---|
| CZT HV Monitor | 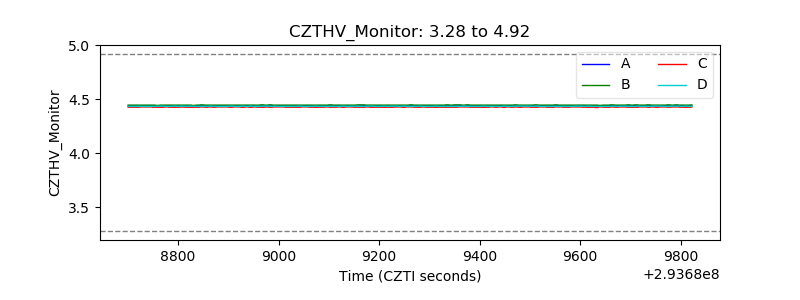 |
| D_VDD | 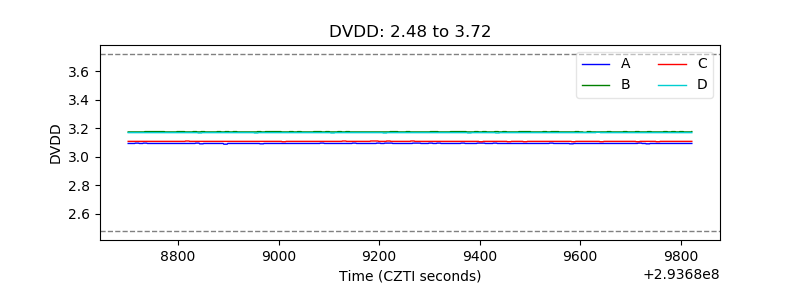 |
| Temperature 1 | 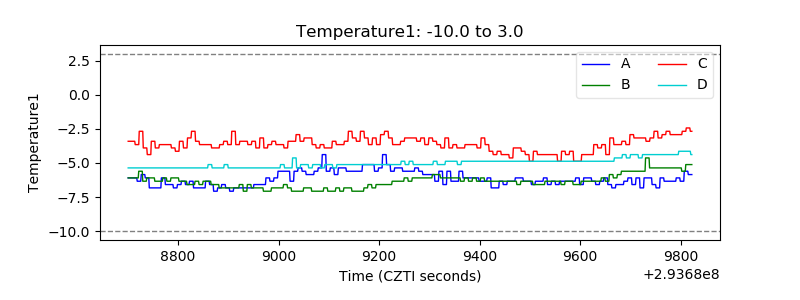 |
| Veto HV Monitor |  |
| Veto LLD | 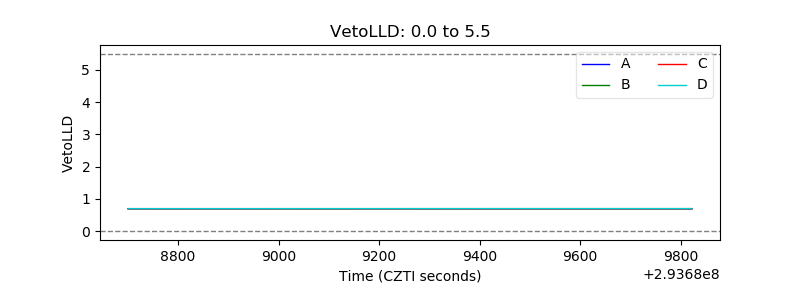 |
| Alpha Counter | 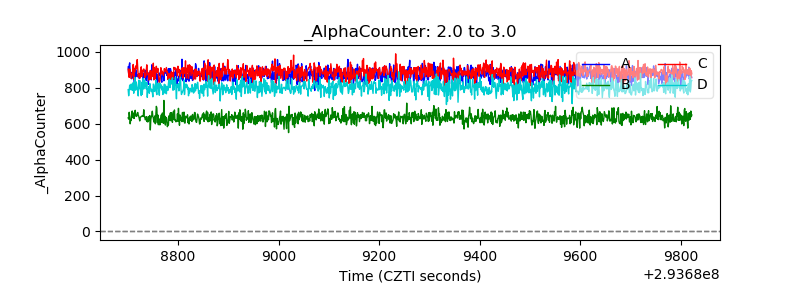 |
| _CPM_Rate | 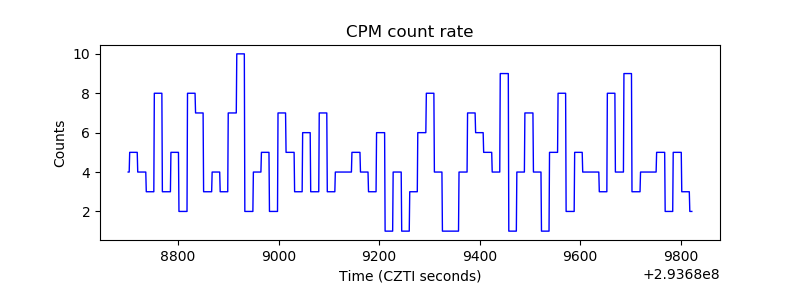 |
| CZT Counter | 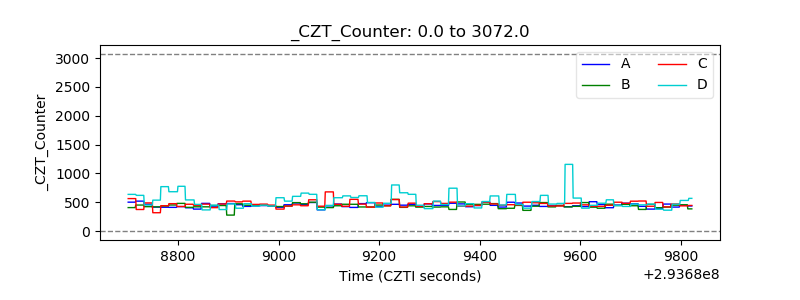 |
| +2.5 Volts monitor | 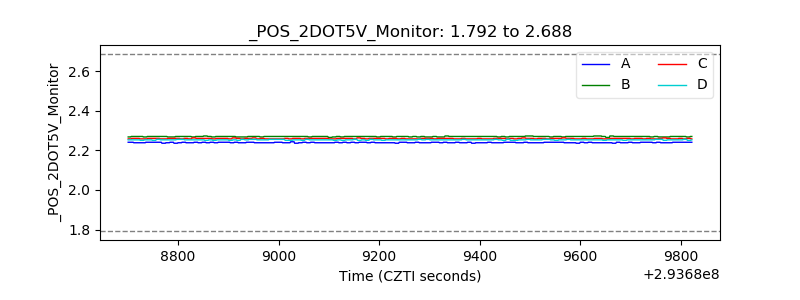 |
| +5 Volts monitor | 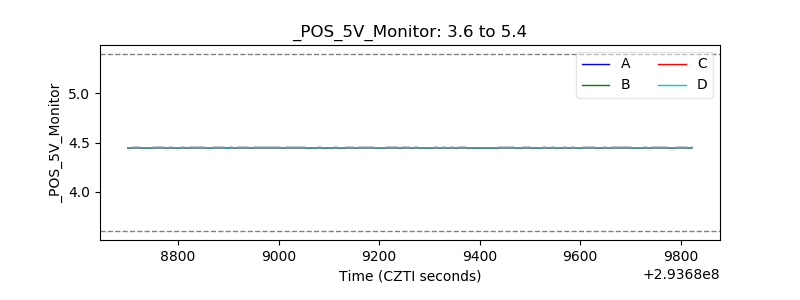 |
| _ROLL_ROT | 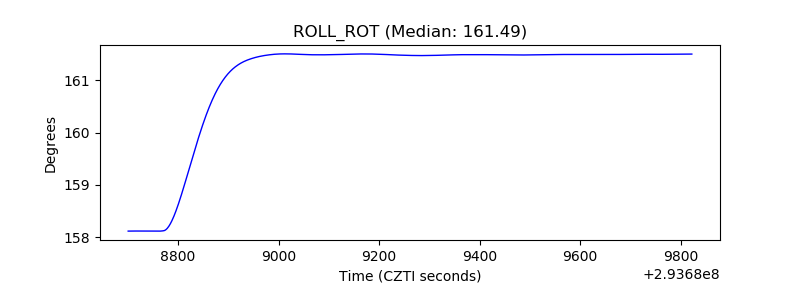 |
| _Roll_DEC | 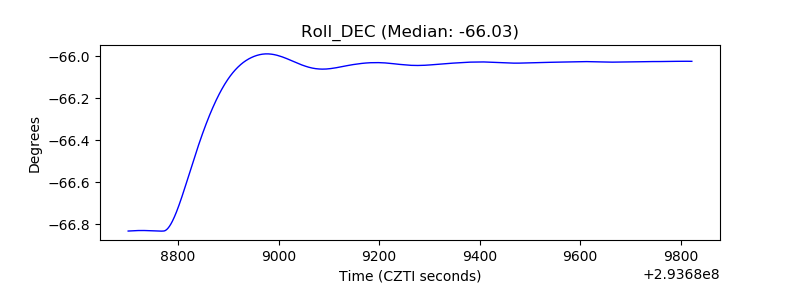 |
| _Roll_RA | 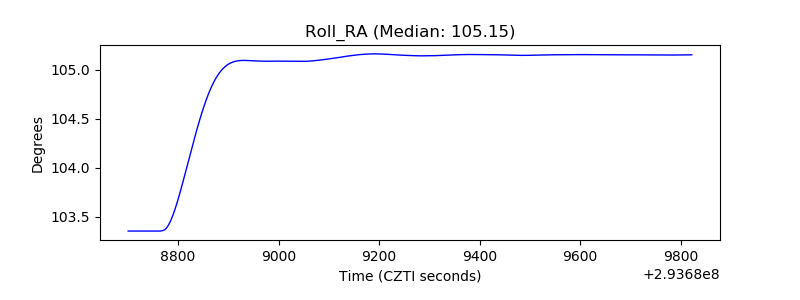 |
| Veto Counter | 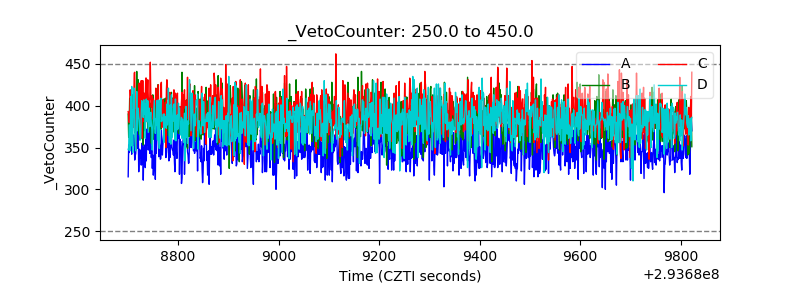 |