| Param | Original file | Final file |
|---|---|---|
| Filename | modeM0/AS1T03_099T03_9000002854_19288cztM0_level2.evt | modeM0/AS1T03_099T03_9000002854_19288cztM0_level2_quad_clean.evt |
| Size (bytes) | 843,609,600 | 204,649,920 |
| Size | 804.5 MB | 195.2 MB |
| Events in quadrant A | 5,818,790 | 1,350,655 |
| Events in quadrant B | 5,902,409 | 1,374,305 |
| Events in quadrant C | 5,729,397 | 1,323,963 |
| Events in quadrant D | 7,262,986 | 1,297,146 |
| Mode SS | |||
|---|---|---|---|
| Quadrant | BADHDUFLAG | Total packets | Discarded packets |
| A | 0 | 250 | 0 |
| B | 0 | 250 | 0 |
| C | 0 | 250 | 0 |
| D | 0 | 250 | 0 |
| Mode M9 | |||
|---|---|---|---|
| Quadrant | BADHDUFLAG | Total packets | Discarded packets |
| A | 0 | 14 | 0 |
| B | 0 | 14 | 0 |
| C | 0 | 14 | 0 |
| D | 0 | 14 | 0 |
| Mode M0 | |||
|---|---|---|---|
| Quadrant | BADHDUFLAG | Total packets | Discarded packets |
| A | 0 | 25459 | 2 |
| B | 0 | 25447 | 2 |
| C | 0 | 25072 | 2 |
| D | 0 | 29746 | 4 |
| Quadrant | Total seconds | Saturated seconds | Saturation percentage |
|---|---|---|---|
| A | 12337 | 99 | 0.802464% |
| B | 12337 | 147 | 1.191538% |
| C | 12337 | 176 | 1.426603% |
| D | 12336 | 222 | 1.799611% |
Noise dominated data is calculated using 1-second bins in cleaned event files. If a bin has >2000 counts, and if more than 50% of those come from <1% of pixels, then it is considered to be noise-dominated and hence unusable.
| Quadrant | # 1 sec bins | Bins with >0 counts | Bins with >2000 counts | High rate bins dominated by noise | Noise dominated (total time) | Noise dominated (detector-on time) | Marked lightcurve |
|---|---|---|---|---|---|---|---|
| A | 13712 | 12337 | 1 | 1 | 0.01% | 0.01% | 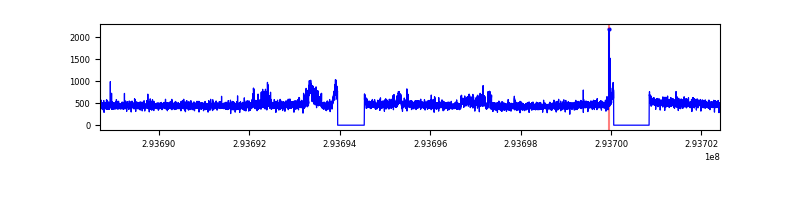 |
| B | 13712 | 12337 | 20 | 20 | 0.15% | 0.16% | 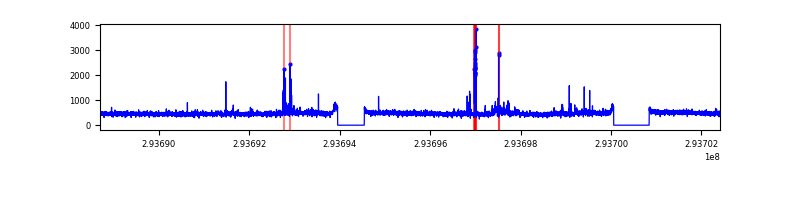 |
| C | 13712 | 12337 | 0 | 0 | 0.00% | 0.00% | 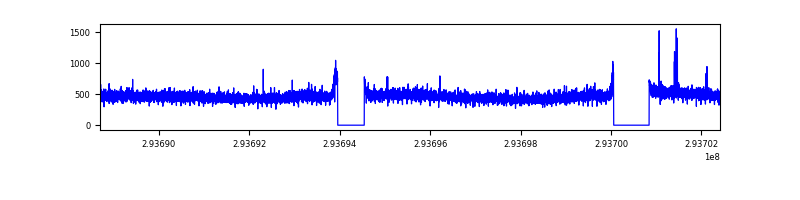 |
| D | 13711 | 12336 | 112 | 112 | 0.82% | 0.91% | 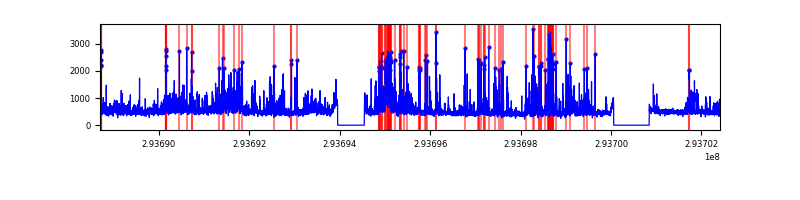 |
Top three noisy pixels from each quadrant. If the there are fewer than three noisy pixels in the level2.evt file, extra rows are filled as -1
| Pixel properties | Quadrant properties | ||||||
|---|---|---|---|---|---|---|---|
| Quadrant | DetID | PixID | Counts | Sigma | Mean | Median | Sigma |
| A | 5 | 168 | 164867 | 560.71 | 1453 | 1422 | 291.5 |
| A | 4 | 2 | 40371 | 133.62 | 1453 | 1422 | 291.5 |
| A | 13 | 254 | 16994 | 53.42 | 1453 | 1422 | 291.5 |
| B | 7 | 220 | 85398 | 307.33 | 1447 | 1409 | 273.3 |
| B | 15 | 201 | 67498 | 241.83 | 1447 | 1409 | 273.3 |
| B | 12 | 111 | 34022 | 119.34 | 1447 | 1409 | 273.3 |
| C | 14 | 238 | 218135 | 664.88 | 1401 | 1411 | 326.0 |
| C | 3 | 233 | 23159 | 66.72 | 1401 | 1411 | 326.0 |
| C | 9 | 15 | 19172 | 54.49 | 1401 | 1411 | 326.0 |
| D | 10 | 66 | 1177285 | 3429.14 | 1416 | 1373 | 342.9 |
| D | 1 | 52 | 348191 | 1011.37 | 1416 | 1373 | 342.9 |
| D | 7 | 223 | 264615 | 767.65 | 1416 | 1373 | 342.9 |
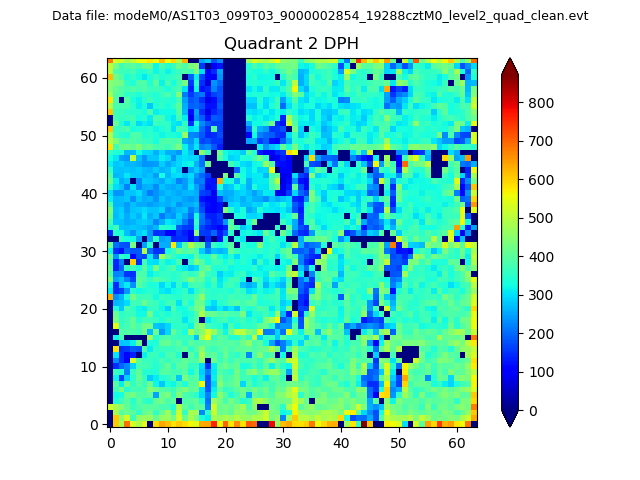
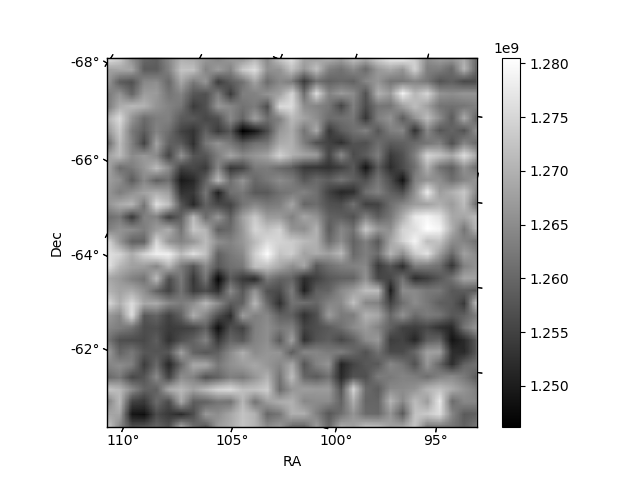
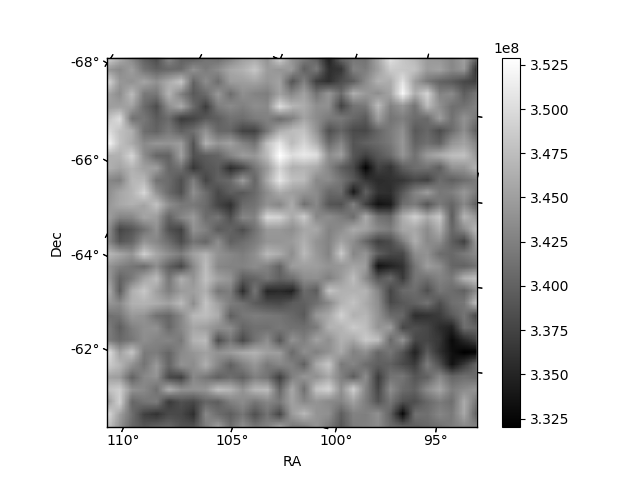
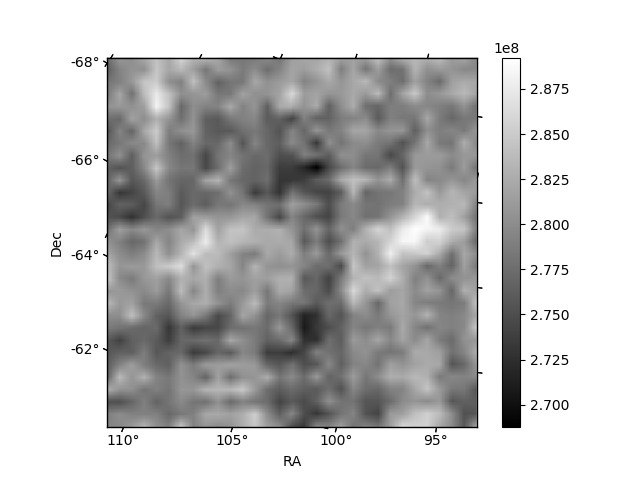
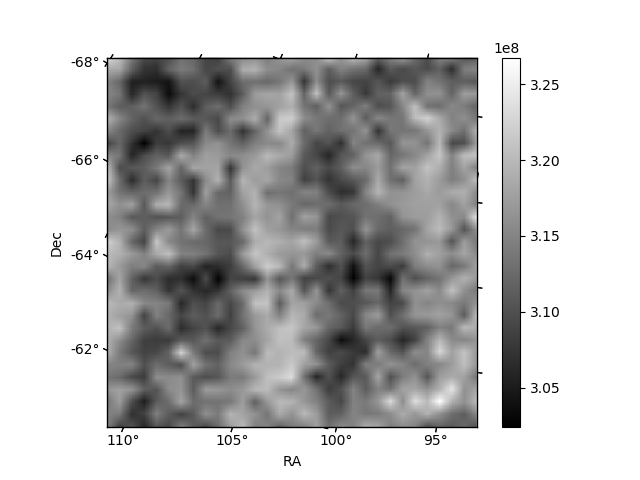
Histogram calculated using DETX and DETY for each event in the final _common_clean file
| Quadrant A | 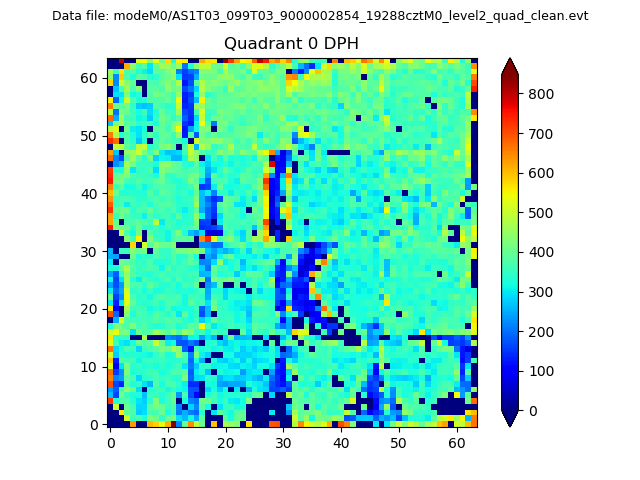 |
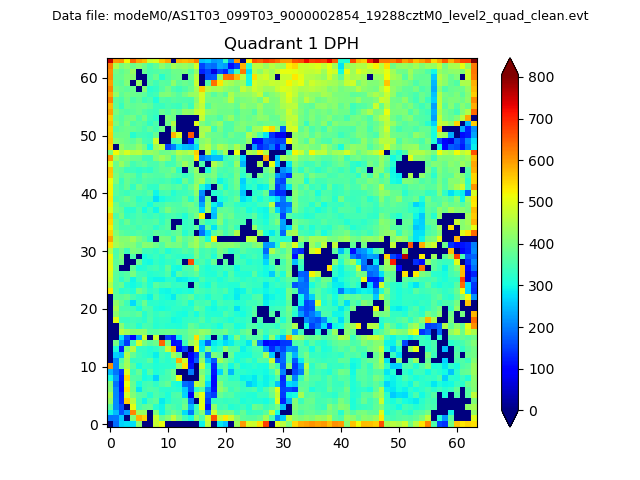 |
Quadrant B |
|---|---|---|---|
| Quadrant D | 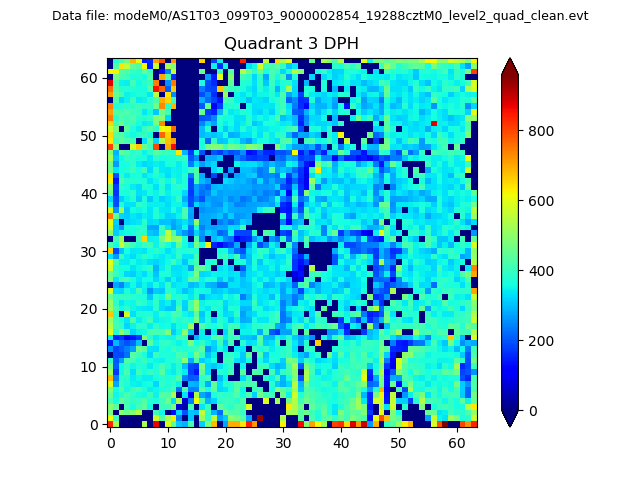 |
 |
Quadrant C |
| Plot type | Count rate plots | Images |
|---|---|---|
| Comparison with Poisson distribution Blue bars denote a histogram of data divided into 1 sec bins. Red curve is a Poisson curve with rate = median count rate of data. |
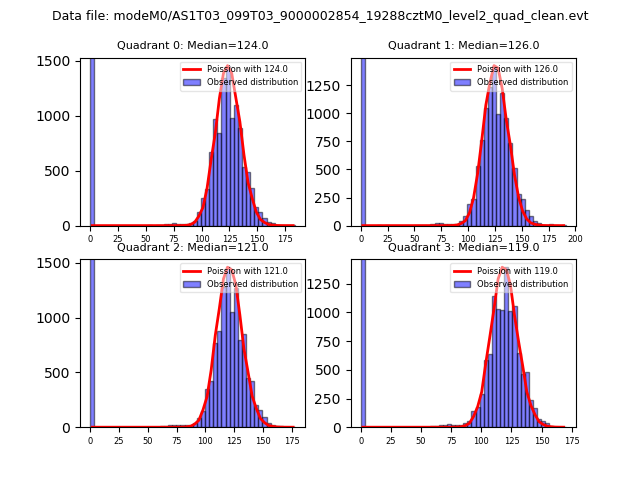 |
 |
| Quadrant-wise count rates Data is divided into 100 sec bins |
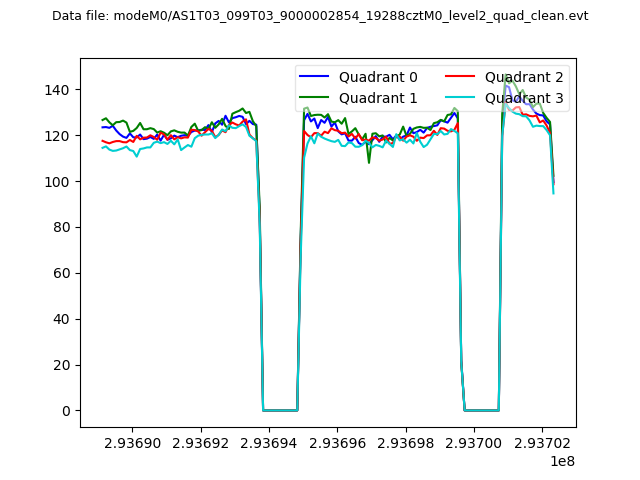 |
|
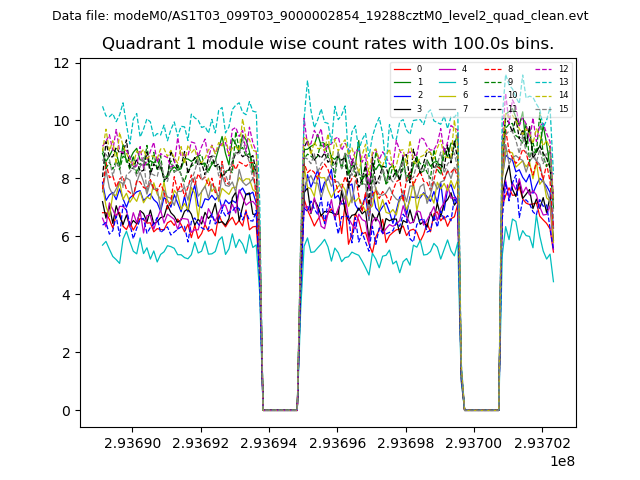
| Module-wise count rates for Quadrant A Data is divided into 100 sec bins |
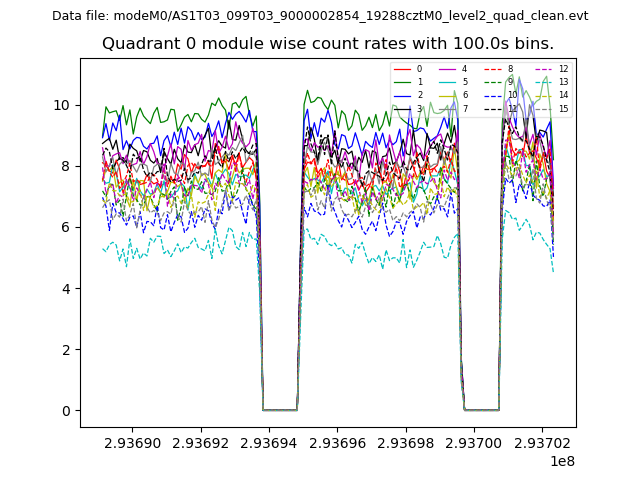 |
 |
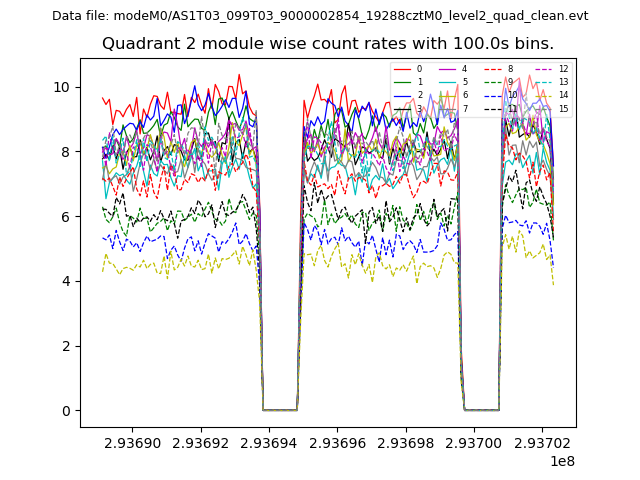
| Module-wise count rates for Quadrant B Data is divided into 100 sec bins |
 |
 |
| Module-wise count rates for Quadrant C Data is divided into 100 sec bins |
 |
 |
| Module-wise count rates for Quadrant D Data is divided into 100 sec bins |
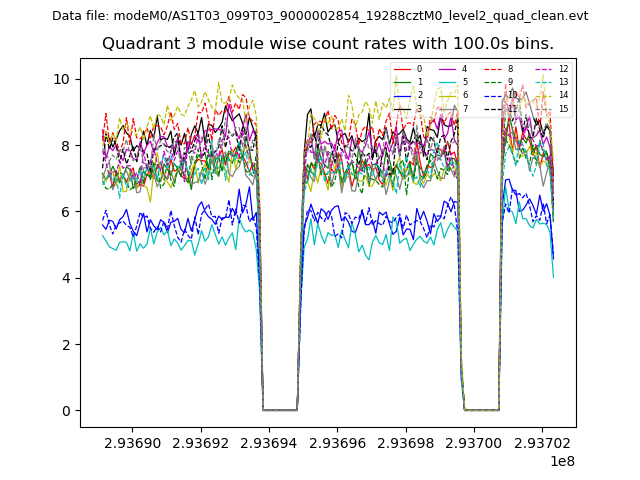 |
 |
| Parameter | Plot |
|---|---|
| CZT HV Monitor | 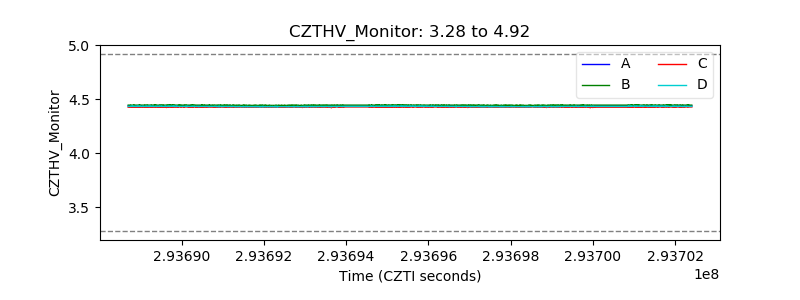 |
| D_VDD | 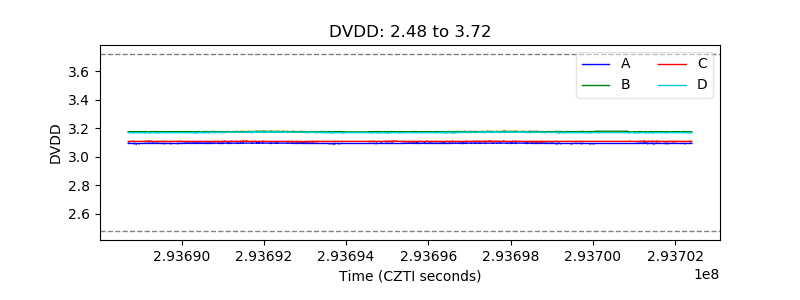 |
| Temperature 1 | 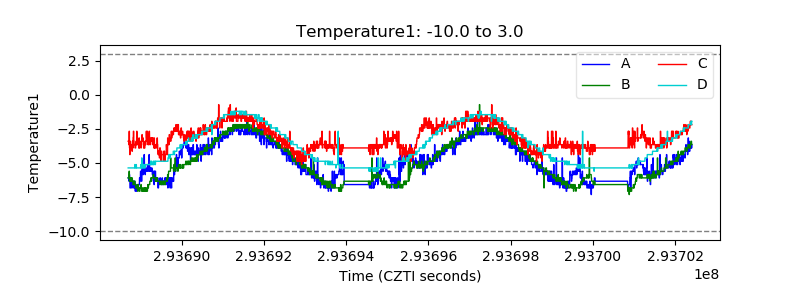 |
| Veto HV Monitor | 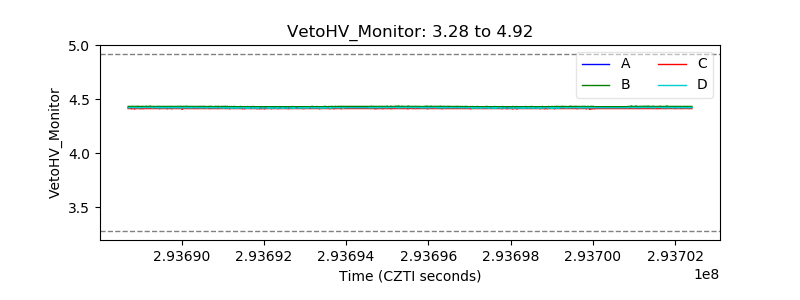 |
| Veto LLD | 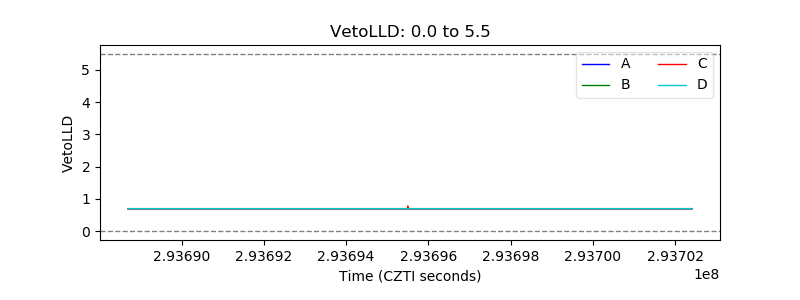 |
| Alpha Counter | 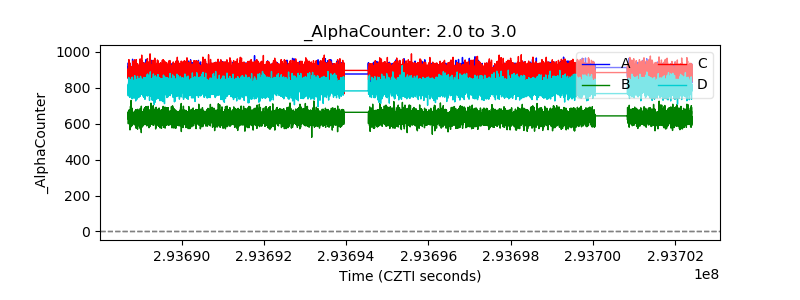 |
| _CPM_Rate | 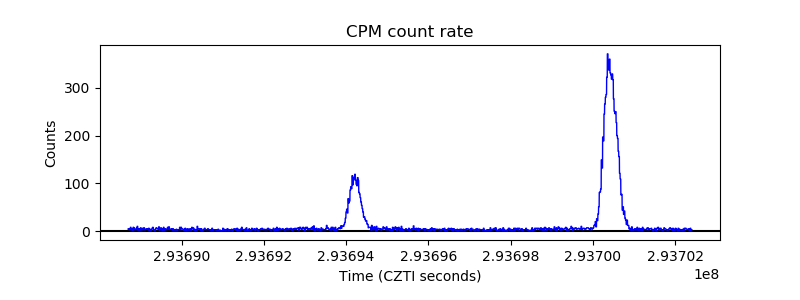 |
| CZT Counter | 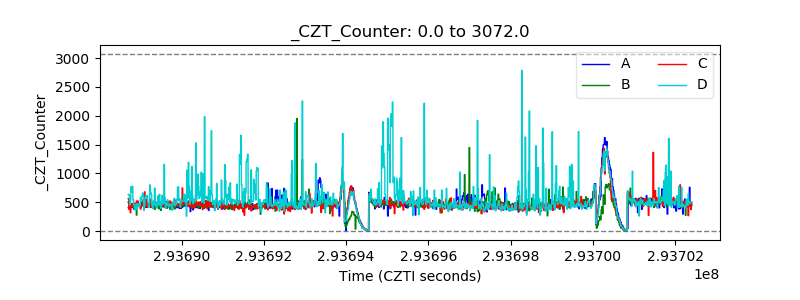 |
| +2.5 Volts monitor |  |
| +5 Volts monitor |  |
| _ROLL_ROT | 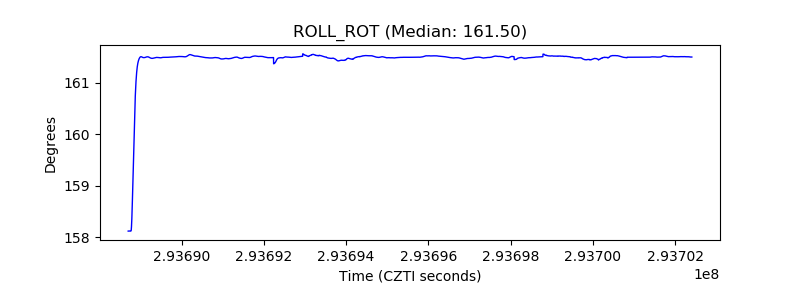 |
| _Roll_DEC |  |
| _Roll_RA | 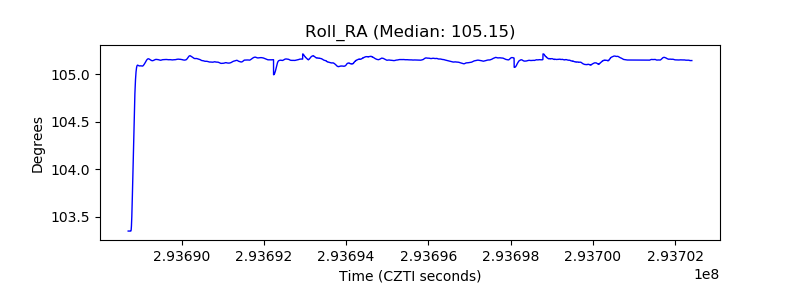 |
| Veto Counter | 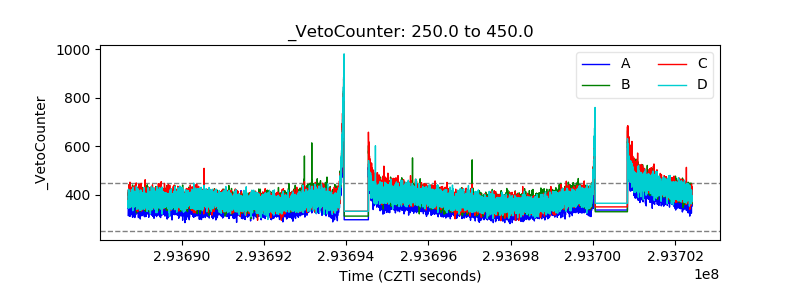 |