| Param | Original file | Final file |
|---|---|---|
| Filename | modeM0/AS1T03_099T03_9000002854_19290cztM0_level2.evt | modeM0/AS1T03_099T03_9000002854_19290cztM0_level2_quad_clean.evt |
| Size (bytes) | 495,760,320 | 112,887,360 |
| Size | 472.8 MB | 107.7 MB |
| Events in quadrant A | 3,139,621 | 760,046 |
| Events in quadrant B | 3,257,864 | 763,424 |
| Events in quadrant C | 3,205,499 | 733,801 |
| Events in quadrant D | 4,968,372 | 706,715 |
| Mode SS | |||
|---|---|---|---|
| Quadrant | BADHDUFLAG | Total packets | Discarded packets |
| A | 0 | 132 | 0 |
| B | 0 | 132 | 0 |
| C | 0 | 132 | 0 |
| D | 0 | 132 | 0 |
| Mode M9 | |||
|---|---|---|---|
| Quadrant | BADHDUFLAG | Total packets | Discarded packets |
| A | 0 | 11 | 0 |
| B | 0 | 11 | 0 |
| C | 0 | 11 | 0 |
| D | 0 | 11 | 0 |
| Mode M0 | |||
|---|---|---|---|
| Quadrant | BADHDUFLAG | Total packets | Discarded packets |
| A | 0 | 13633 | 1 |
| B | 0 | 13859 | 1 |
| C | 0 | 13860 | 1 |
| D | 0 | 18957 | 1 |
| Quadrant | Total seconds | Saturated seconds | Saturation percentage |
|---|---|---|---|
| A | 6524 | 58 | 0.889025% |
| B | 6525 | 61 | 0.934866% |
| C | 6525 | 96 | 1.471264% |
| D | 6525 | 466 | 7.141762% |
Noise dominated data is calculated using 1-second bins in cleaned event files. If a bin has >2000 counts, and if more than 50% of those come from <1% of pixels, then it is considered to be noise-dominated and hence unusable.
| Quadrant | # 1 sec bins | Bins with >0 counts | Bins with >2000 counts | High rate bins dominated by noise | Noise dominated (total time) | Noise dominated (detector-on time) | Marked lightcurve |
|---|---|---|---|---|---|---|---|
| A | 7599 | 6524 | 0 | 0 | 0.00% | 0.00% | 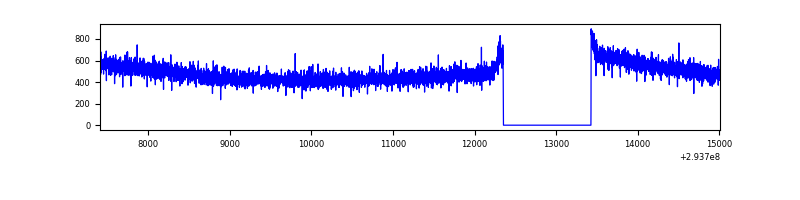 |
| B | 7600 | 6525 | 5 | 5 | 0.07% | 0.08% |  |
| C | 7600 | 6525 | 0 | 0 | 0.00% | 0.00% | 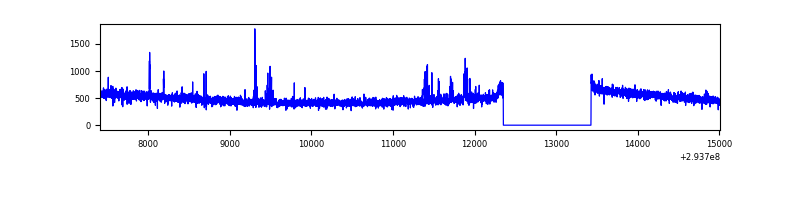 |
| D | 7600 | 6525 | 392 | 392 | 5.16% | 6.01% | 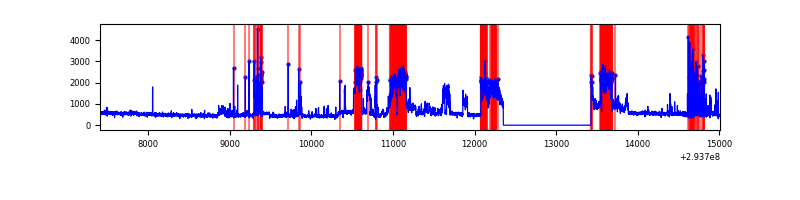 |
Top three noisy pixels from each quadrant. If the there are fewer than three noisy pixels in the level2.evt file, extra rows are filled as -1
| Pixel properties | Quadrant properties | ||||||
|---|---|---|---|---|---|---|---|
| Quadrant | DetID | PixID | Counts | Sigma | Mean | Median | Sigma |
| A | 13 | 254 | 8636 | 47.96 | 814 | 797 | 163.4 |
| A | 0 | 226 | 7221 | 39.31 | 814 | 797 | 163.4 |
| A | 3 | 137 | 6267 | 33.47 | 814 | 797 | 163.4 |
| B | 7 | 220 | 46269 | 300.31 | 802 | 782 | 151.5 |
| B | 3 | 64 | 19583 | 124.13 | 802 | 782 | 151.5 |
| B | 12 | 111 | 18294 | 115.62 | 802 | 782 | 151.5 |
| C | 14 | 238 | 121931 | 677.97 | 772 | 778 | 178.7 |
| C | 9 | 15 | 29950 | 163.25 | 772 | 778 | 178.7 |
| C | 9 | 54 | 18110 | 96.99 | 772 | 778 | 178.7 |
| D | 7 | 223 | 1553343 | 8224.24 | 777 | 753 | 188.8 |
| D | 1 | 52 | 277209 | 1464.42 | 777 | 753 | 188.8 |
| D | 13 | 138 | 84932 | 445.9 | 777 | 753 | 188.8 |
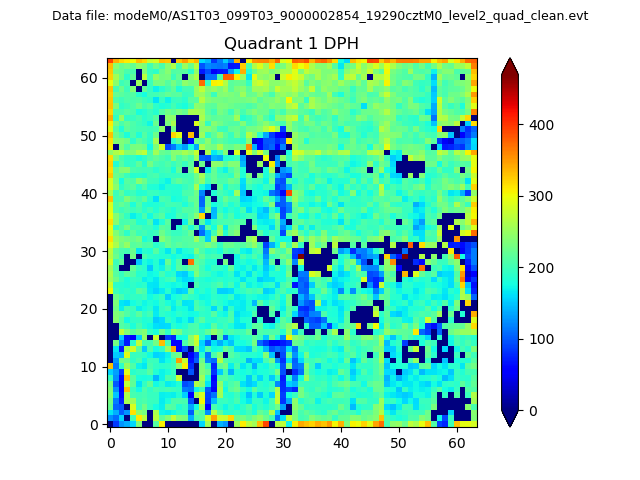
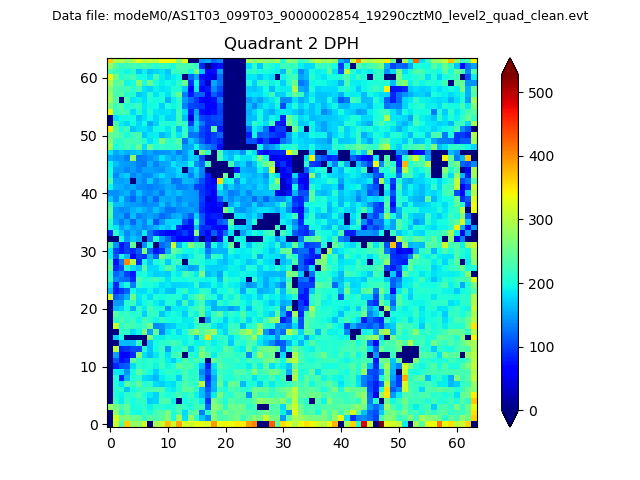
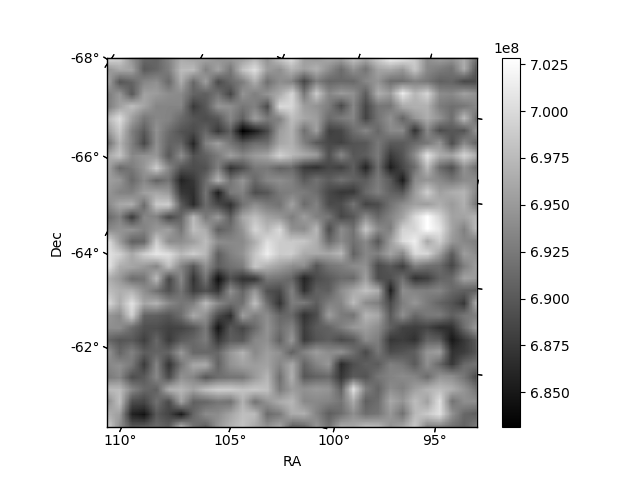
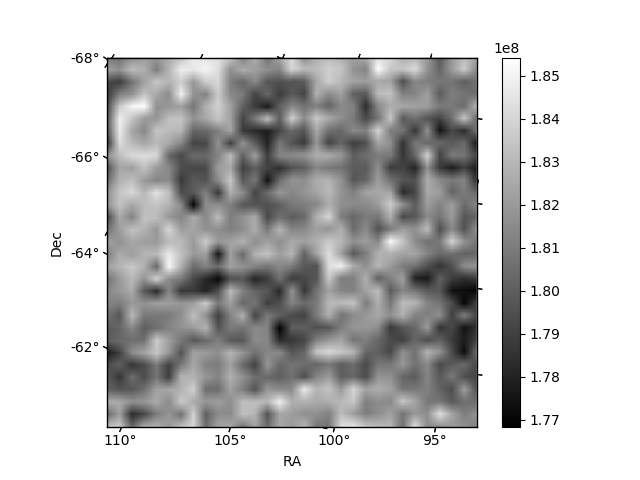
Histogram calculated using DETX and DETY for each event in the final _common_clean file
| Quadrant A | 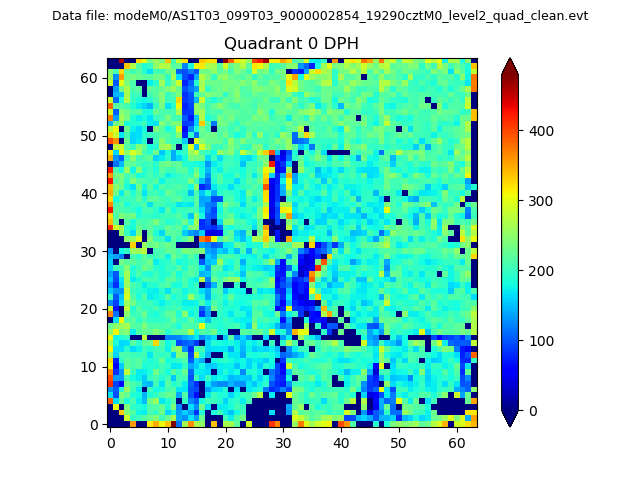 |
 |
Quadrant B |
|---|---|---|---|
| Quadrant D | 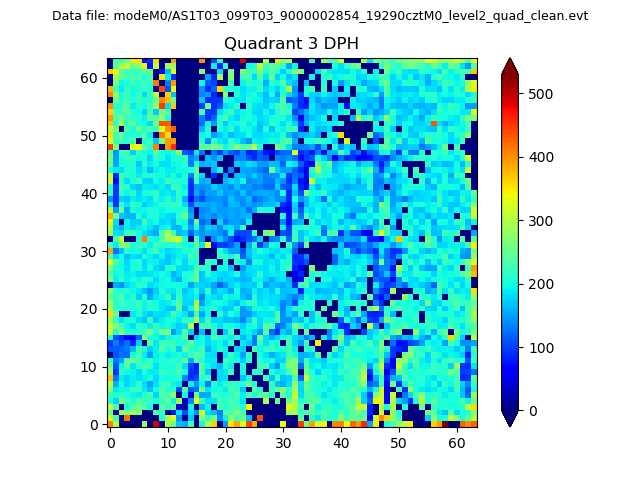 |
 |
Quadrant C |
| Plot type | Count rate plots | Images |
|---|---|---|
| Comparison with Poisson distribution Blue bars denote a histogram of data divided into 1 sec bins. Red curve is a Poisson curve with rate = median count rate of data. |
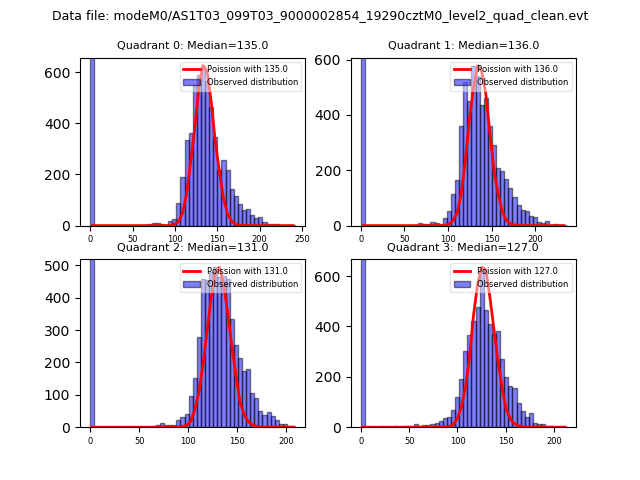 |
 |
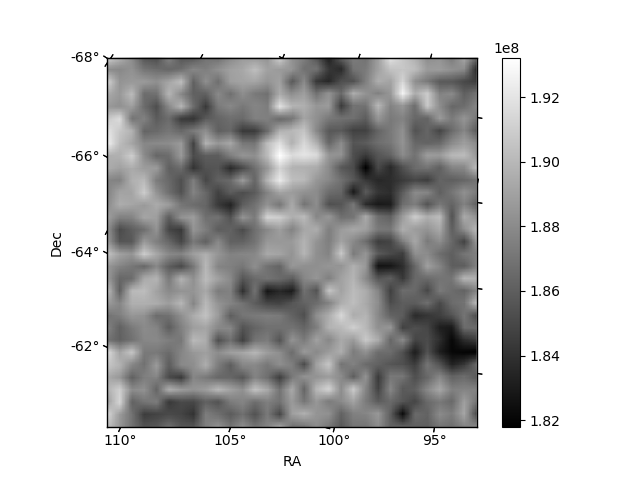
| Quadrant-wise count rates Data is divided into 100 sec bins |
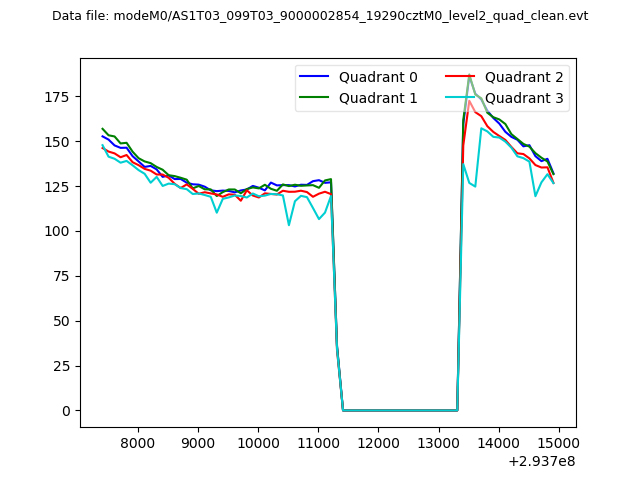 |
|
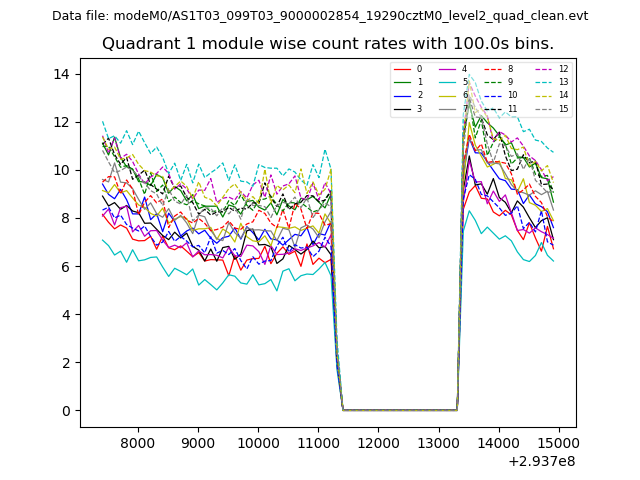
| Module-wise count rates for Quadrant A Data is divided into 100 sec bins |
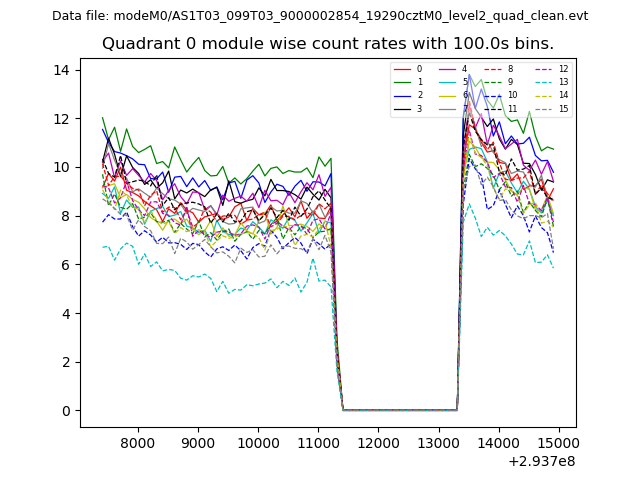 |
 |
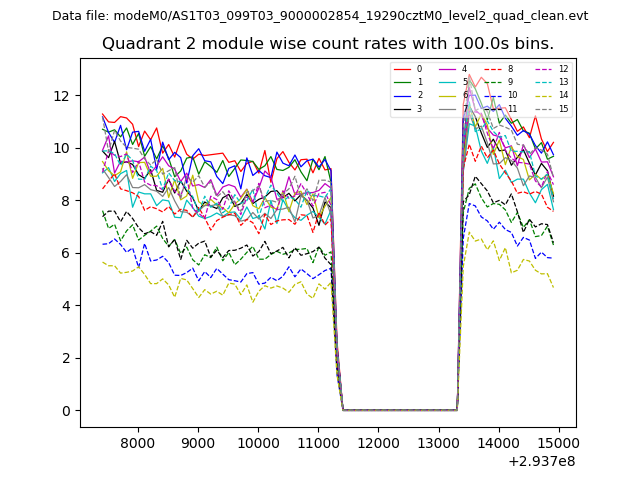
| Module-wise count rates for Quadrant B Data is divided into 100 sec bins |
 |
 |
| Module-wise count rates for Quadrant C Data is divided into 100 sec bins |
 |
 |
| Module-wise count rates for Quadrant D Data is divided into 100 sec bins |
 |
 |
| Parameter | Plot |
|---|---|
| CZT HV Monitor |  |
| D_VDD | 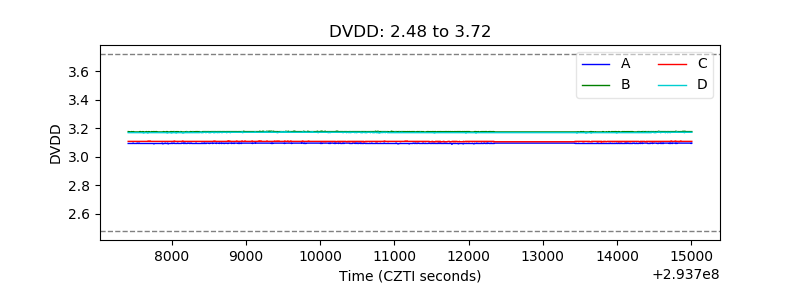 |
| Temperature 1 |  |
| Veto HV Monitor | 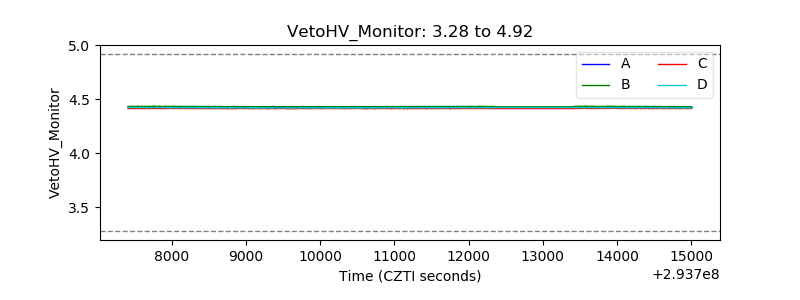 |
| Veto LLD | 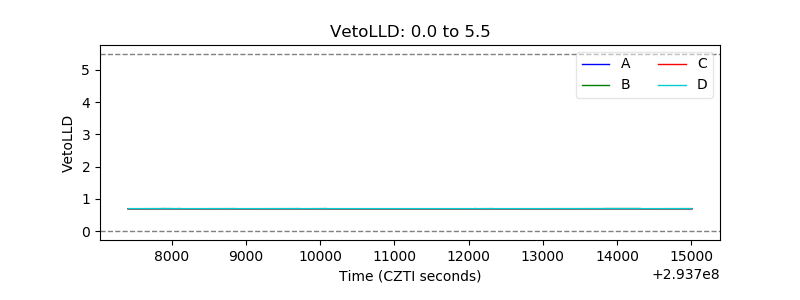 |
| Alpha Counter | 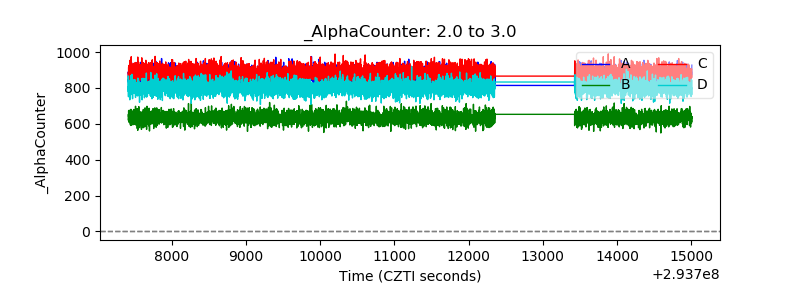 |
| _CPM_Rate | 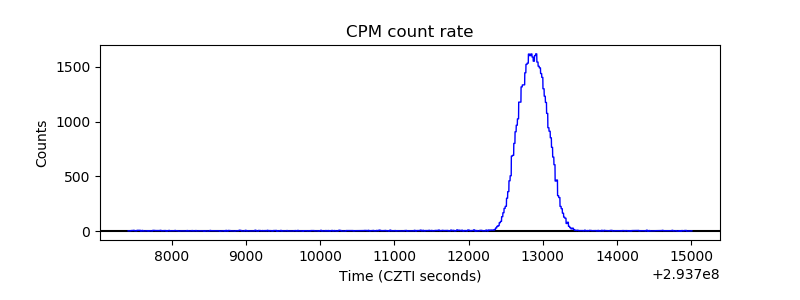 |
| CZT Counter | 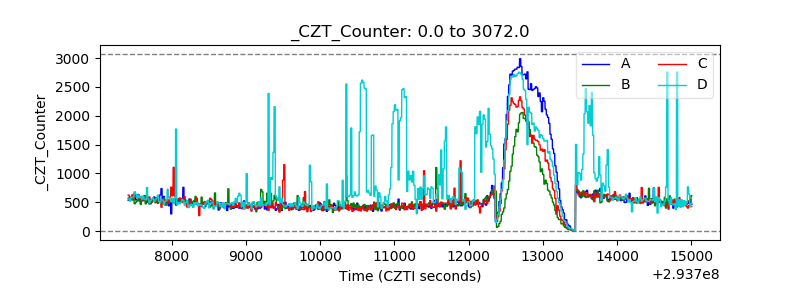 |
| +2.5 Volts monitor |  |
| +5 Volts monitor |  |
| _ROLL_ROT | 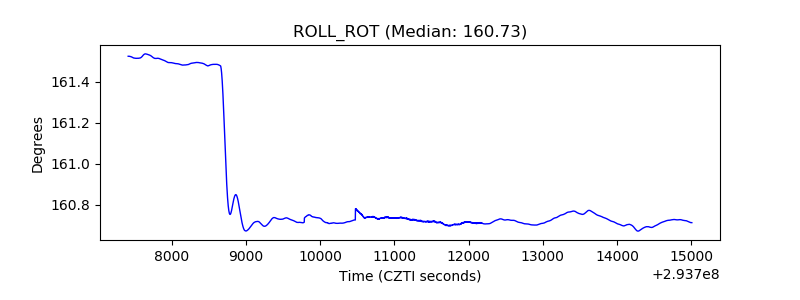 |
| _Roll_DEC |  |
| _Roll_RA | 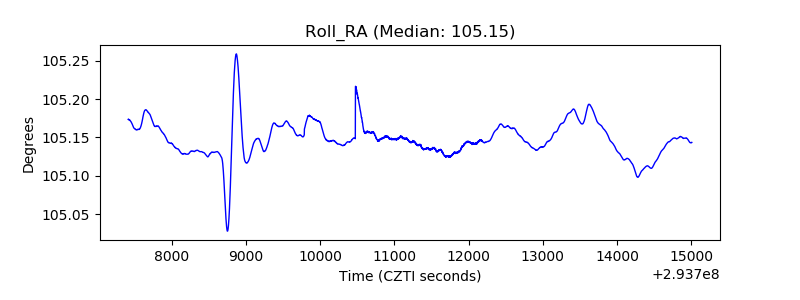 |
| Veto Counter | 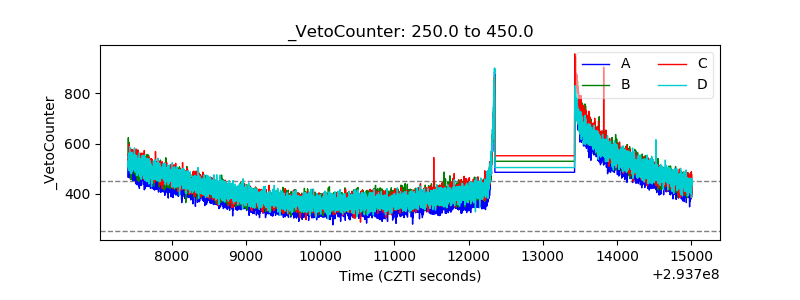 |