| Param | Original file | Final file |
|---|---|---|
| Filename | modeM0/AS1T03_099T03_9000002854_19292cztM0_level2.evt | modeM0/AS1T03_099T03_9000002854_19292cztM0_level2_quad_clean.evt |
| Size (bytes) | 555,863,040 | 105,353,280 |
| Size | 530.1 MB | 100.5 MB |
| Events in quadrant A | 3,007,401 | 727,732 |
| Events in quadrant B | 3,183,023 | 729,039 |
| Events in quadrant C | 3,025,912 | 689,517 |
| Events in quadrant D | 7,203,223 | 617,301 |
| Mode SS | |||
|---|---|---|---|
| Quadrant | BADHDUFLAG | Total packets | Discarded packets |
| A | 0 | 126 | 0 |
| B | 0 | 126 | 0 |
| C | 0 | 126 | 0 |
| D | 0 | 126 | 0 |
| Mode M9 | |||
|---|---|---|---|
| Quadrant | BADHDUFLAG | Total packets | Discarded packets |
| A | 0 | 11 | 0 |
| B | 0 | 11 | 0 |
| C | 0 | 11 | 0 |
| D | 0 | 11 | 0 |
| Mode M0 | |||
|---|---|---|---|
| Quadrant | BADHDUFLAG | Total packets | Discarded packets |
| A | 0 | 12966 | 1 |
| B | 0 | 13419 | 1 |
| C | 0 | 13058 | 1 |
| D | 0 | 25252 | 1 |
| Quadrant | Total seconds | Saturated seconds | Saturation percentage |
|---|---|---|---|
| A | 6107 | 59 | 0.966104% |
| B | 6107 | 74 | 1.211724% |
| C | 6108 | 81 | 1.326130% |
| D | 6108 | 1727 | 28.274394% |
Noise dominated data is calculated using 1-second bins in cleaned event files. If a bin has >2000 counts, and if more than 50% of those come from <1% of pixels, then it is considered to be noise-dominated and hence unusable.
| Quadrant | # 1 sec bins | Bins with >0 counts | Bins with >2000 counts | High rate bins dominated by noise | Noise dominated (total time) | Noise dominated (detector-on time) | Marked lightcurve |
|---|---|---|---|---|---|---|---|
| A | 7292 | 6107 | 0 | 0 | 0.00% | 0.00% | 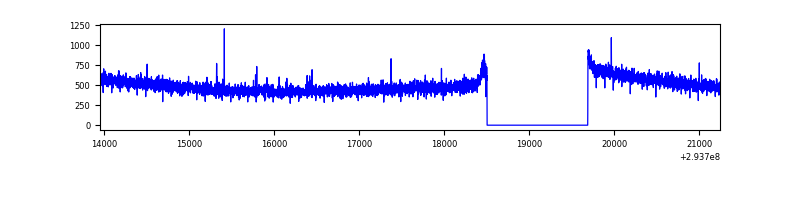 |
| B | 7292 | 6107 | 8 | 8 | 0.11% | 0.13% | 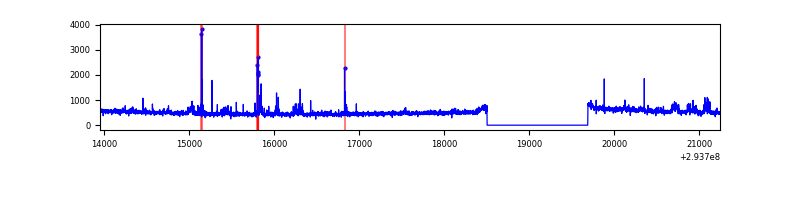 |
| C | 7293 | 6108 | 4 | 4 | 0.05% | 0.07% | 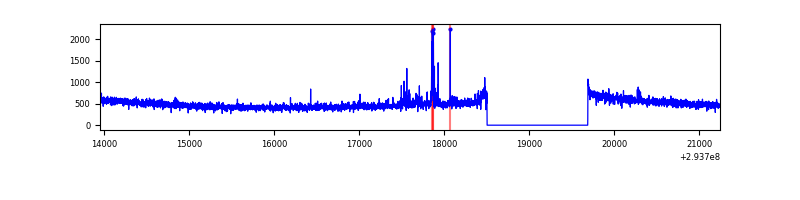 |
| D | 7293 | 6108 | 1618 | 1618 | 22.19% | 26.49% | 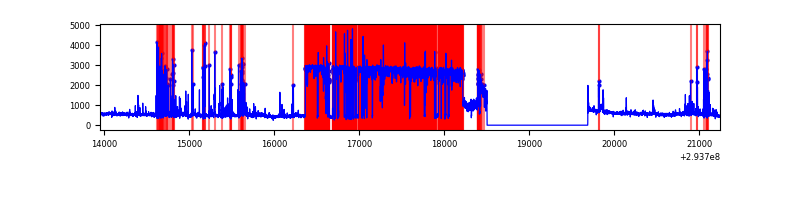 |
Top three noisy pixels from each quadrant. If the there are fewer than three noisy pixels in the level2.evt file, extra rows are filled as -1
| Pixel properties | Quadrant properties | ||||||
|---|---|---|---|---|---|---|---|
| Quadrant | DetID | PixID | Counts | Sigma | Mean | Median | Sigma |
| A | 13 | 254 | 7730 | 44.25 | 779 | 765 | 157.4 |
| A | 0 | 226 | 6945 | 39.26 | 779 | 765 | 157.4 |
| A | 3 | 137 | 5738 | 31.59 | 779 | 765 | 157.4 |
| B | 7 | 220 | 75589 | 522.14 | 766 | 748 | 143.3 |
| B | 0 | 229 | 24506 | 165.75 | 766 | 748 | 143.3 |
| B | 6 | 36 | 19095 | 128.0 | 766 | 748 | 143.3 |
| C | 14 | 238 | 115865 | 689.16 | 728 | 733 | 167.1 |
| C | 5 | 112 | 57684 | 340.9 | 728 | 733 | 167.1 |
| C | 3 | 233 | 7061 | 37.88 | 728 | 733 | 167.1 |
| D | 7 | 223 | 4160344 | 27418.5 | 635 | 617 | 151.7 |
| D | 1 | 52 | 476178 | 3134.62 | 635 | 617 | 151.7 |
| D | 13 | 104 | 54572 | 355.64 | 635 | 617 | 151.7 |
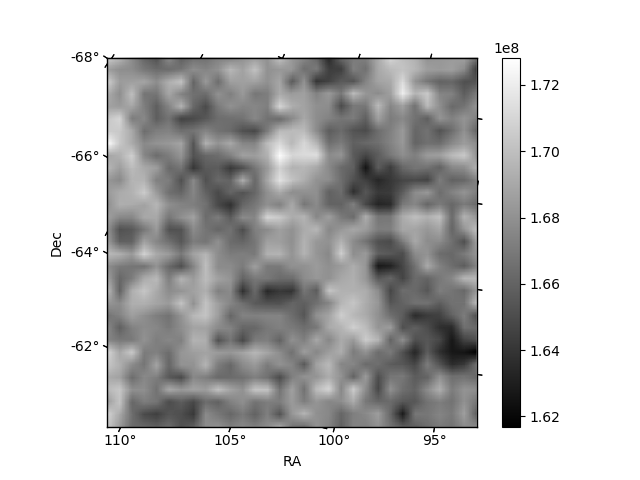
Histogram calculated using DETX and DETY for each event in the final _common_clean file
| Quadrant A | 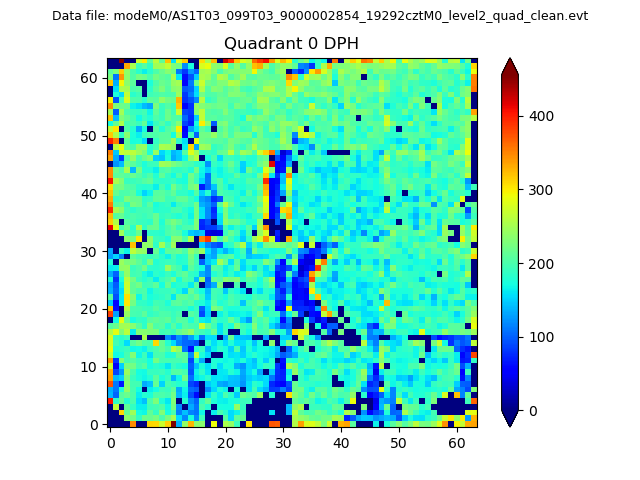 |
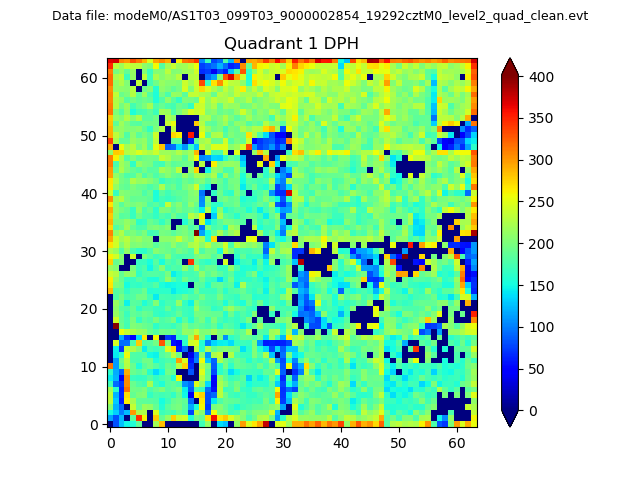 |
Quadrant B |
|---|---|---|---|
| Quadrant D | 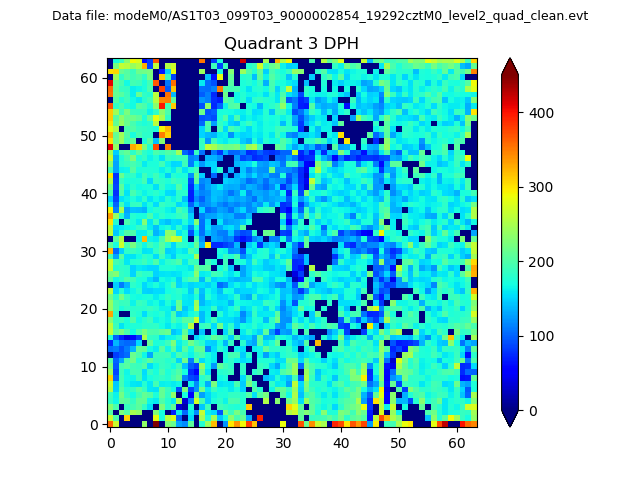 |
 |
Quadrant C |
| Plot type | Count rate plots | Images |
|---|---|---|
| Comparison with Poisson distribution Blue bars denote a histogram of data divided into 1 sec bins. Red curve is a Poisson curve with rate = median count rate of data. |
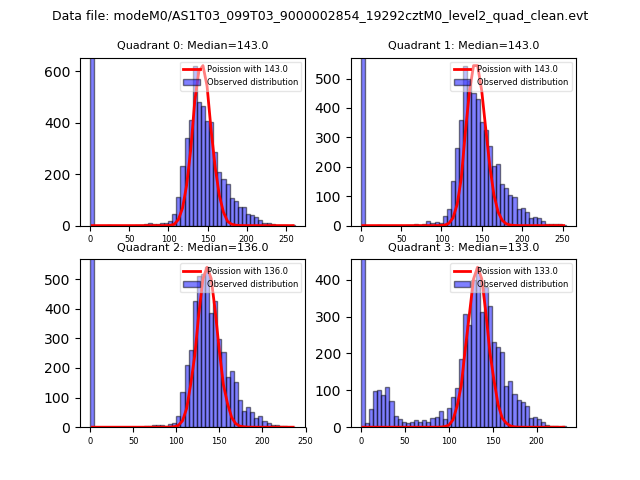 |
 |
| Quadrant-wise count rates Data is divided into 100 sec bins |
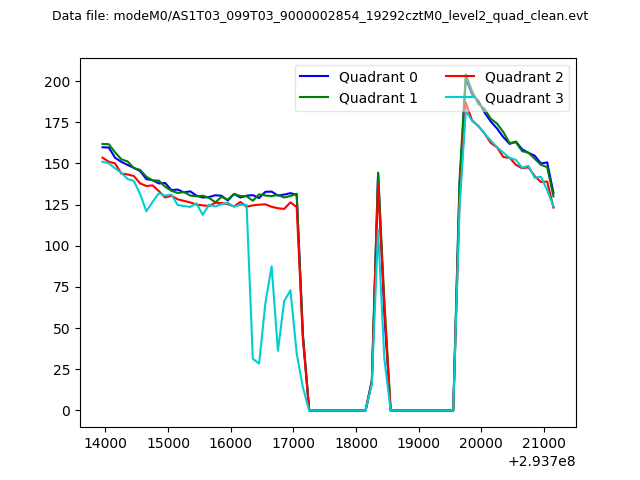 |
|
| Module-wise count rates for Quadrant A Data is divided into 100 sec bins |
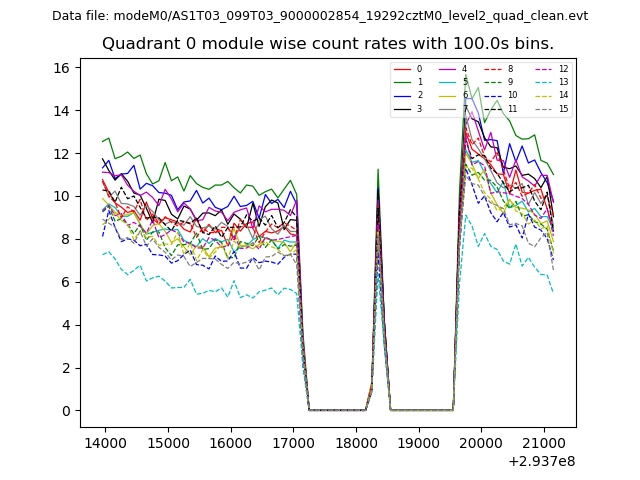 |
 |
| Module-wise count rates for Quadrant B Data is divided into 100 sec bins |
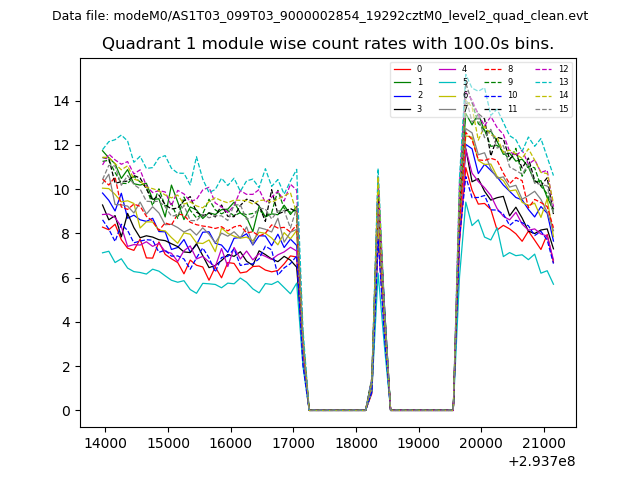 |
 |
| Module-wise count rates for Quadrant C Data is divided into 100 sec bins |
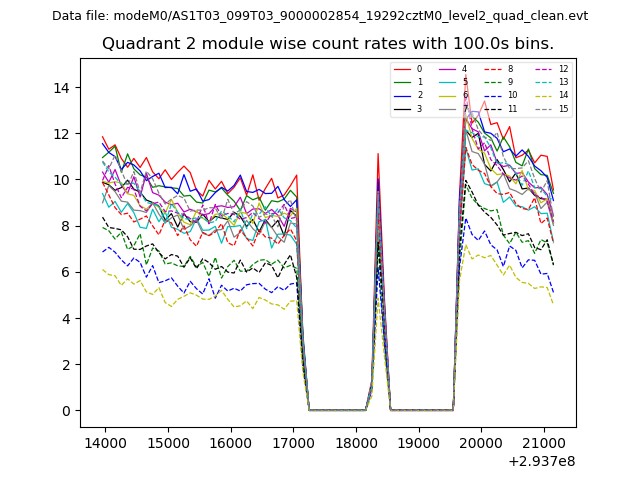 |
 |
| Module-wise count rates for Quadrant D Data is divided into 100 sec bins |
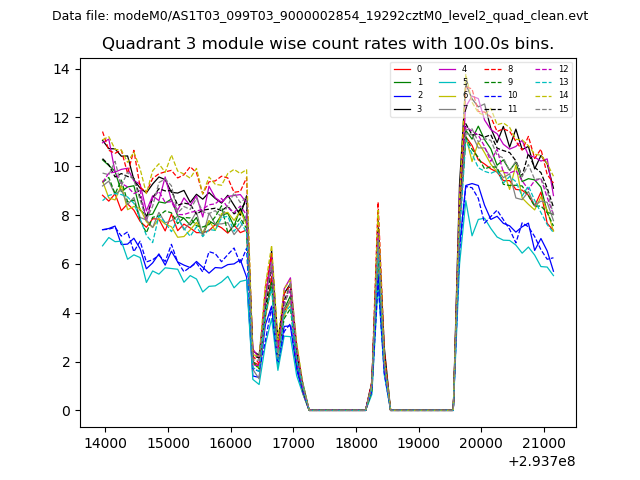 |
 |
| Parameter | Plot |
|---|---|
| CZT HV Monitor | 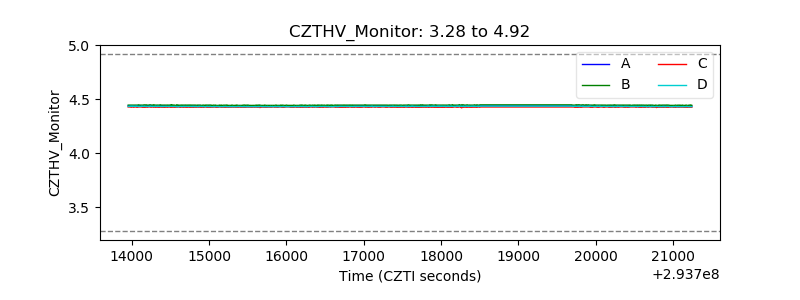 |
| D_VDD | 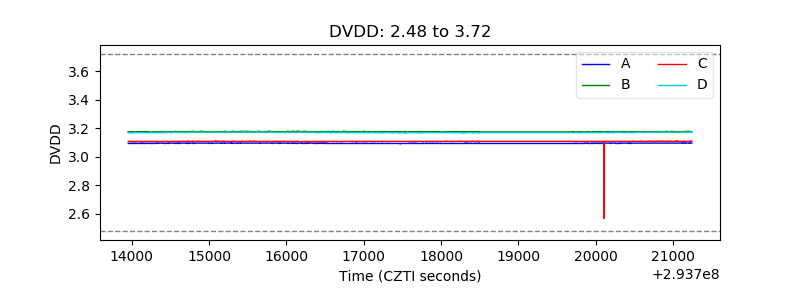 |
| Temperature 1 | 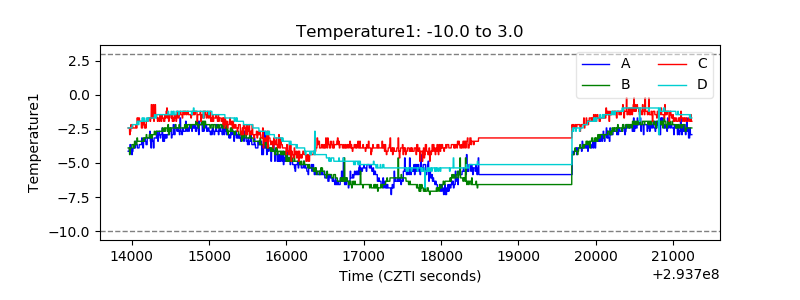 |
| Veto HV Monitor | 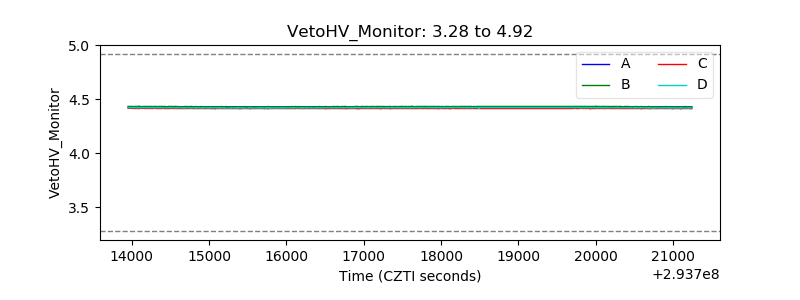 |
| Veto LLD | 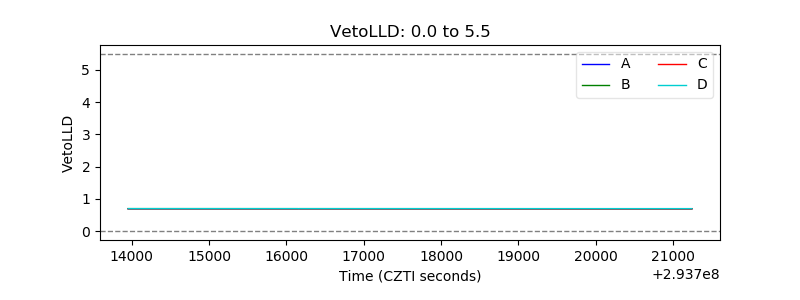 |
| Alpha Counter | 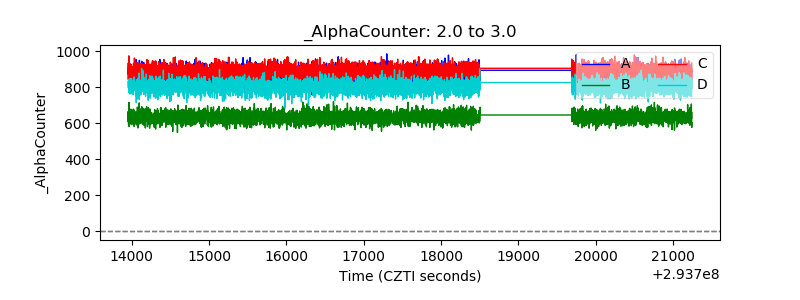 |
| _CPM_Rate | 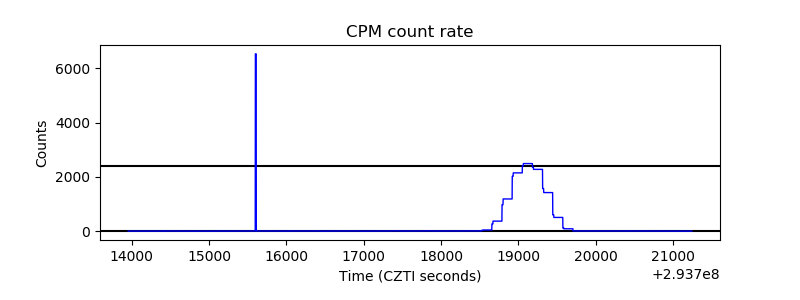 |
| CZT Counter |  |
| +2.5 Volts monitor |  |
| +5 Volts monitor |  |
| _ROLL_ROT | 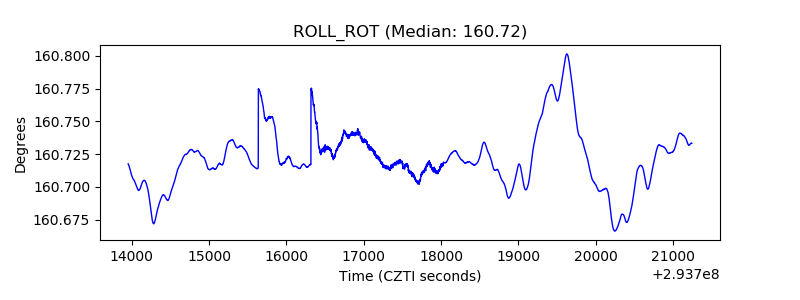 |
| _Roll_DEC | 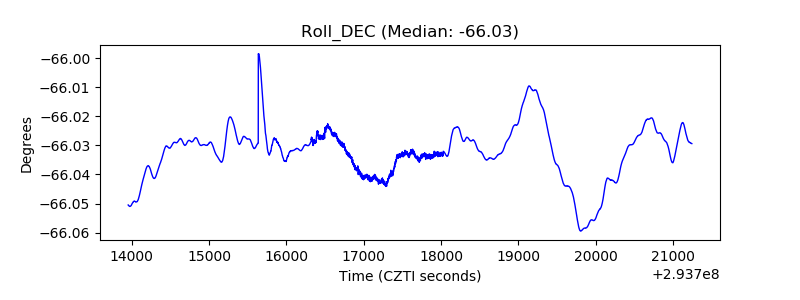 |
| _Roll_RA | 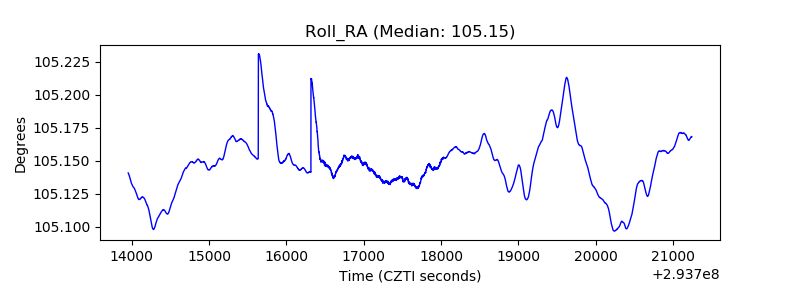 |
| Veto Counter | 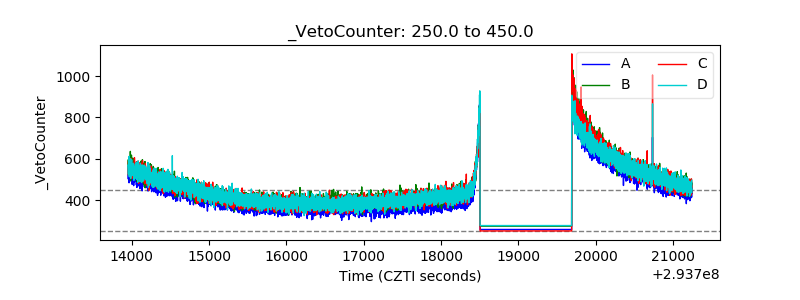 |