| Param | Original file | Final file |
|---|---|---|
| Filename | modeM0/AS1T03_099T03_9000002854_19294cztM0_level2.evt | modeM0/AS1T03_099T03_9000002854_19294cztM0_level2_quad_clean.evt |
| Size (bytes) | 533,488,320 | 103,838,400 |
| Size | 508.8 MB | 99.0 MB |
| Events in quadrant A | 3,010,534 | 717,767 |
| Events in quadrant B | 3,028,718 | 720,308 |
| Events in quadrant C | 2,864,592 | 670,006 |
| Events in quadrant D | 6,859,381 | 631,233 |
| Mode SS | |||
|---|---|---|---|
| Quadrant | BADHDUFLAG | Total packets | Discarded packets |
| A | 0 | 118 | 0 |
| B | 0 | 118 | 0 |
| C | 0 | 118 | 0 |
| D | 0 | 118 | 0 |
| Mode M9 | |||
|---|---|---|---|
| Quadrant | BADHDUFLAG | Total packets | Discarded packets |
| A | 0 | 13 | 0 |
| B | 0 | 13 | 0 |
| C | 0 | 13 | 0 |
| D | 0 | 13 | 0 |
| Mode M0 | |||
|---|---|---|---|
| Quadrant | BADHDUFLAG | Total packets | Discarded packets |
| A | 0 | 12550 | 1 |
| B | 0 | 12624 | 1 |
| C | 0 | 12173 | 1 |
| D | 0 | 24334 | 1 |
| Quadrant | Total seconds | Saturated seconds | Saturation percentage |
|---|---|---|---|
| A | 5799 | 83 | 1.431281% |
| B | 5799 | 82 | 1.414037% |
| C | 5799 | 74 | 1.276082% |
| D | 5799 | 1418 | 24.452492% |
Noise dominated data is calculated using 1-second bins in cleaned event files. If a bin has >2000 counts, and if more than 50% of those come from <1% of pixels, then it is considered to be noise-dominated and hence unusable.
| Quadrant | # 1 sec bins | Bins with >0 counts | Bins with >2000 counts | High rate bins dominated by noise | Noise dominated (total time) | Noise dominated (detector-on time) | Marked lightcurve |
|---|---|---|---|---|---|---|---|
| A | 7129 | 5799 | 3 | 3 | 0.04% | 0.05% | 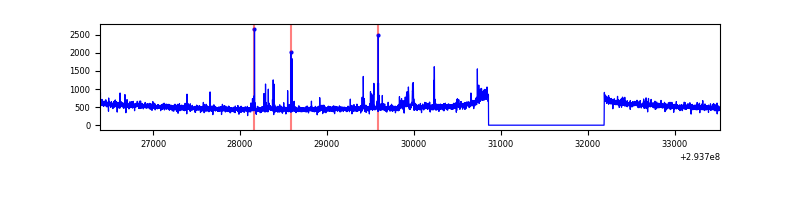 |
| B | 7129 | 5799 | 3 | 3 | 0.04% | 0.05% | 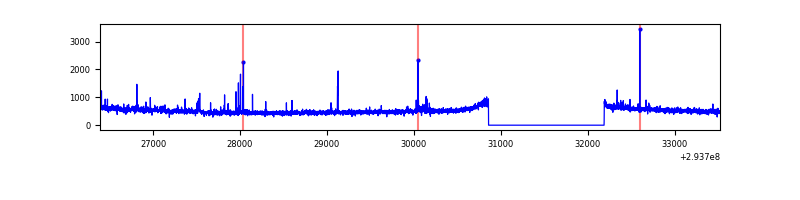 |
| C | 7129 | 5800 | 0 | 0 | 0.00% | 0.00% | 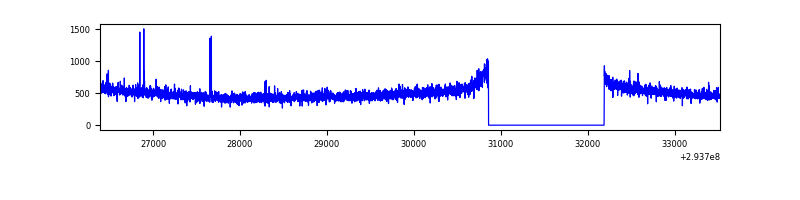 |
| D | 7128 | 5799 | 1395 | 1395 | 19.57% | 24.06% | 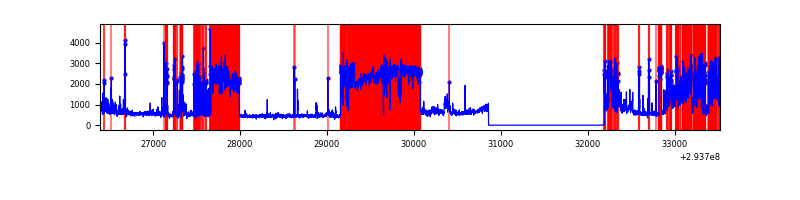 |
Top three noisy pixels from each quadrant. If the there are fewer than three noisy pixels in the level2.evt file, extra rows are filled as -1
| Pixel properties | Quadrant properties | ||||||
|---|---|---|---|---|---|---|---|
| Quadrant | DetID | PixID | Counts | Sigma | Mean | Median | Sigma |
| A | 4 | 2 | 74985 | 490.57 | 756 | 743 | 151.3 |
| A | 5 | 16 | 18741 | 118.93 | 756 | 743 | 151.3 |
| A | 13 | 254 | 9106 | 55.26 | 756 | 743 | 151.3 |
| B | 3 | 64 | 41321 | 292.03 | 746 | 731 | 139.0 |
| B | 0 | 229 | 19030 | 131.66 | 746 | 731 | 139.0 |
| B | 0 | 197 | 17110 | 117.84 | 746 | 731 | 139.0 |
| C | 14 | 238 | 111583 | 687.08 | 699 | 703 | 161.4 |
| C | 5 | 112 | 18034 | 107.39 | 699 | 703 | 161.4 |
| C | 3 | 233 | 10421 | 60.22 | 699 | 703 | 161.4 |
| D | 7 | 238 | 4013419 | 26144.38 | 637 | 618 | 153.5 |
| D | 1 | 52 | 309894 | 2015.01 | 637 | 618 | 153.5 |
| D | 13 | 138 | 65373 | 421.89 | 637 | 618 | 153.5 |
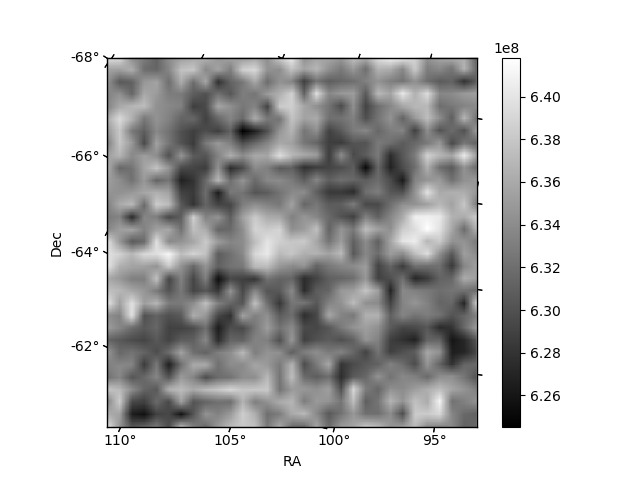
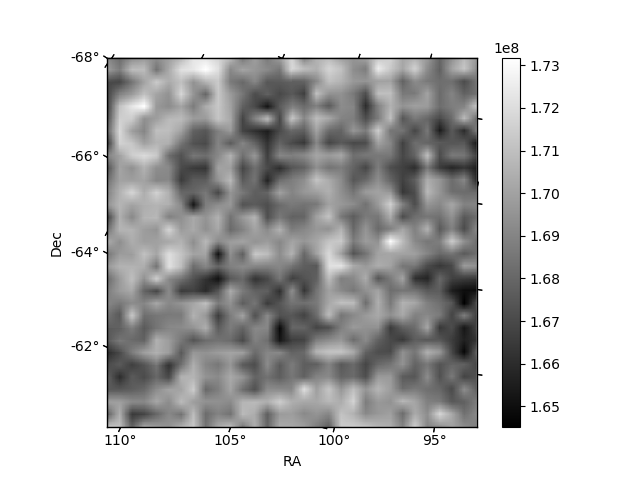
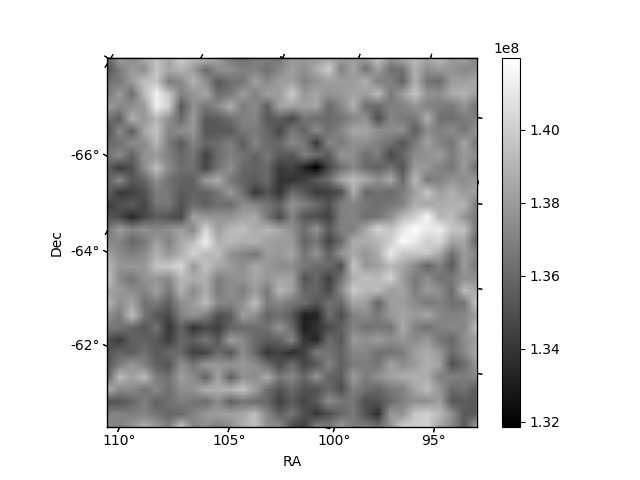
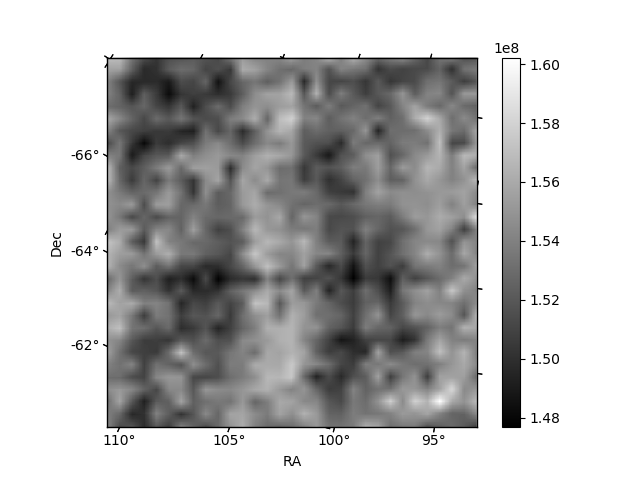
Histogram calculated using DETX and DETY for each event in the final _common_clean file
| Quadrant A | 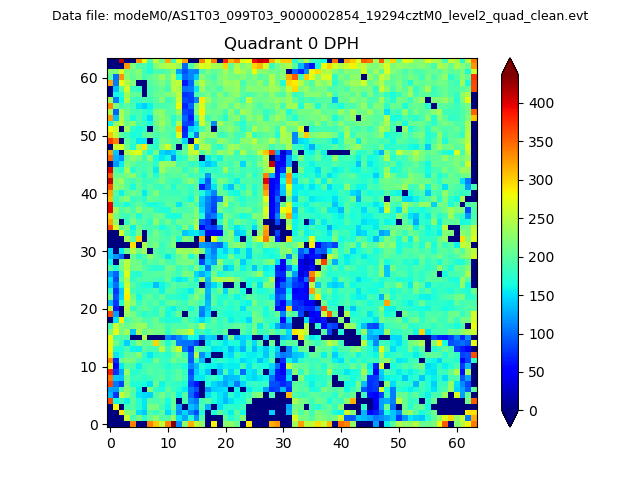 |
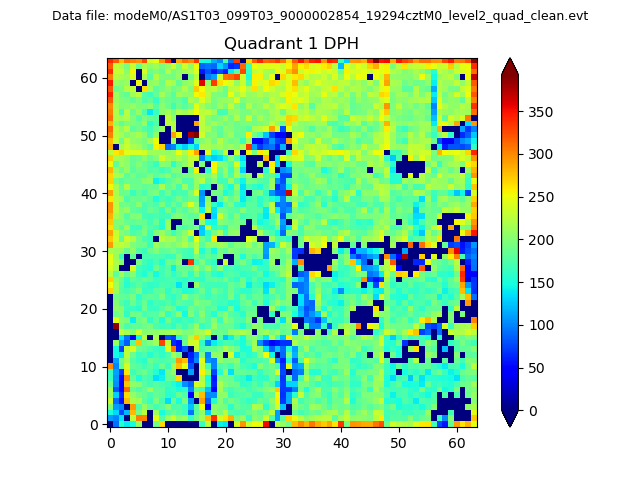 |
Quadrant B |
|---|---|---|---|
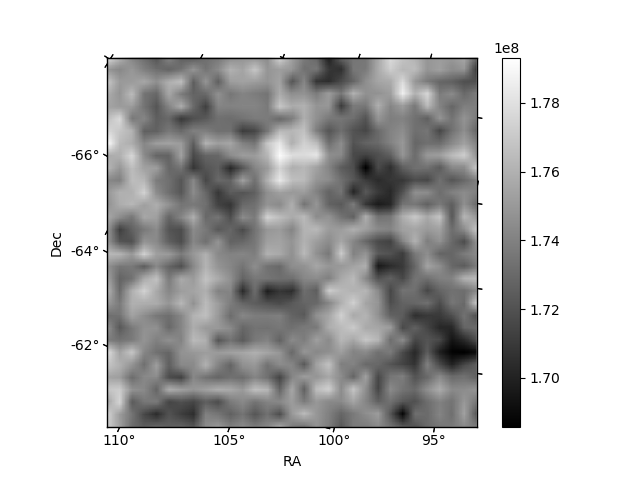
| Quadrant D | 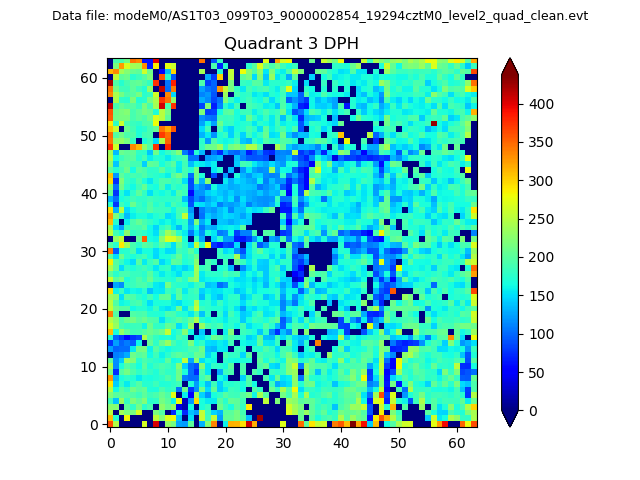 |
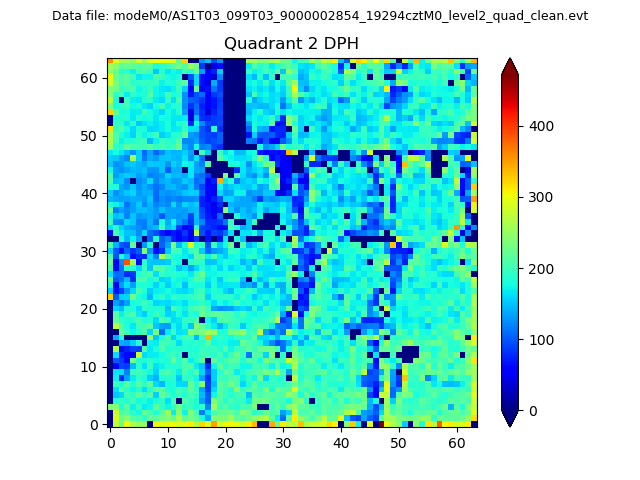 |
Quadrant C |
| Plot type | Count rate plots | Images |
|---|---|---|
| Comparison with Poisson distribution Blue bars denote a histogram of data divided into 1 sec bins. Red curve is a Poisson curve with rate = median count rate of data. |
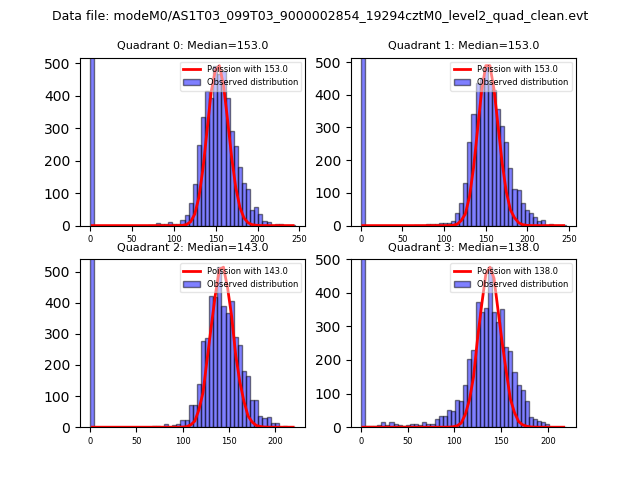 |
 |
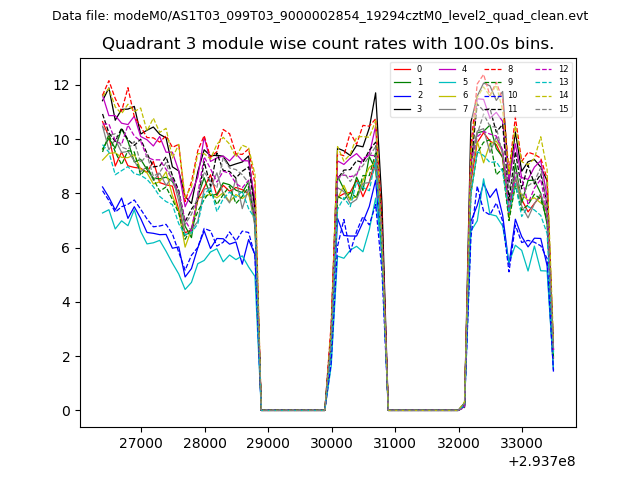
| Quadrant-wise count rates Data is divided into 100 sec bins |
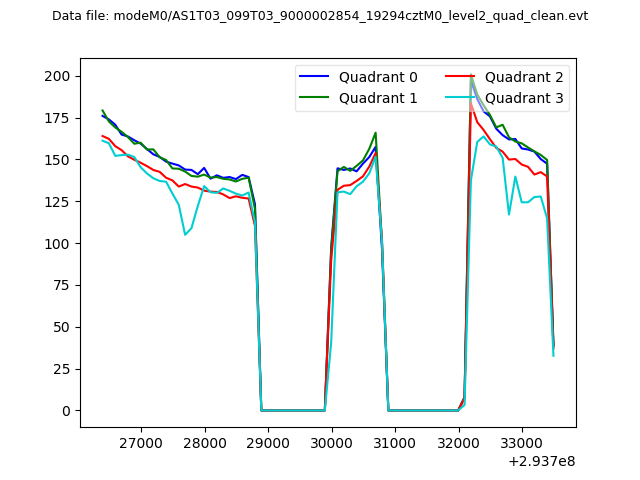 |
|
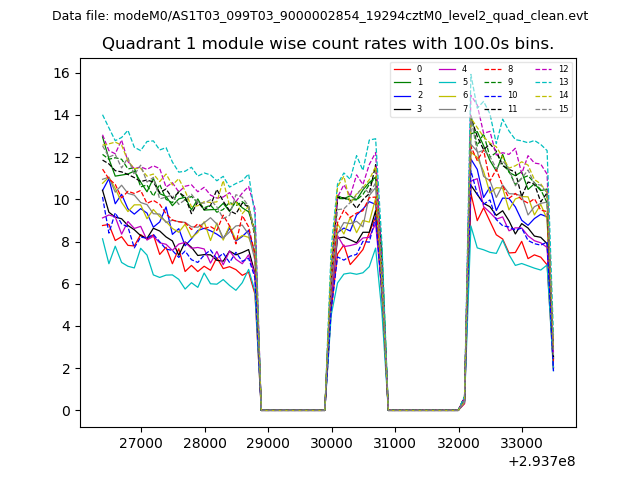
| Module-wise count rates for Quadrant A Data is divided into 100 sec bins |
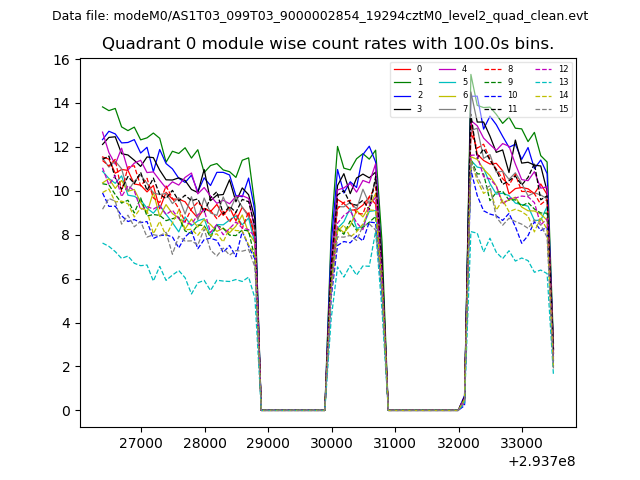 |
 |
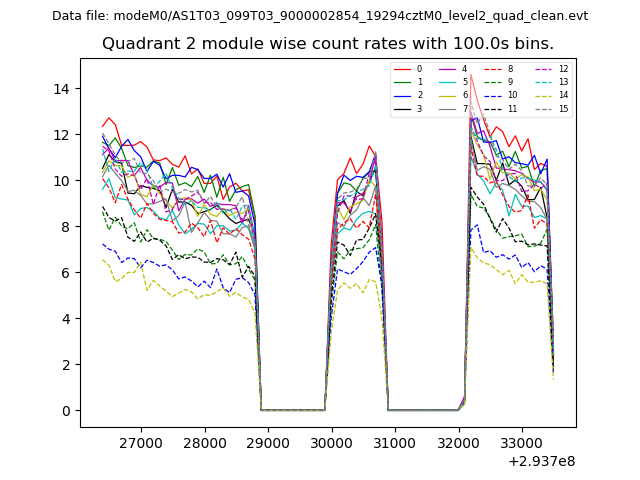
| Module-wise count rates for Quadrant B Data is divided into 100 sec bins |
 |
 |
| Module-wise count rates for Quadrant C Data is divided into 100 sec bins |
 |
 |
| Module-wise count rates for Quadrant D Data is divided into 100 sec bins |
 |
 |
| Parameter | Plot |
|---|---|
| CZT HV Monitor | 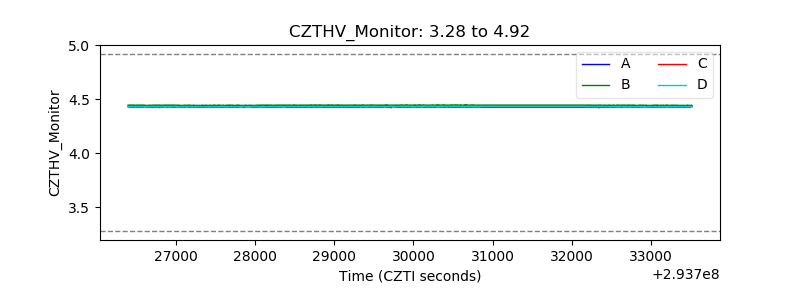 |
| D_VDD | 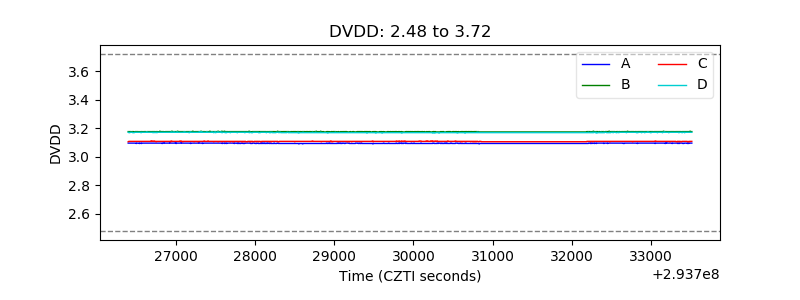 |
| Temperature 1 | 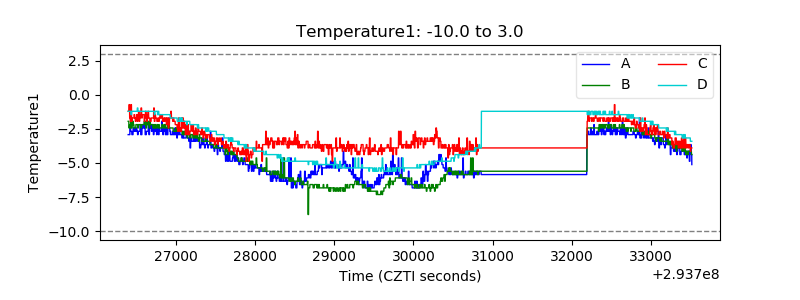 |
| Veto HV Monitor | 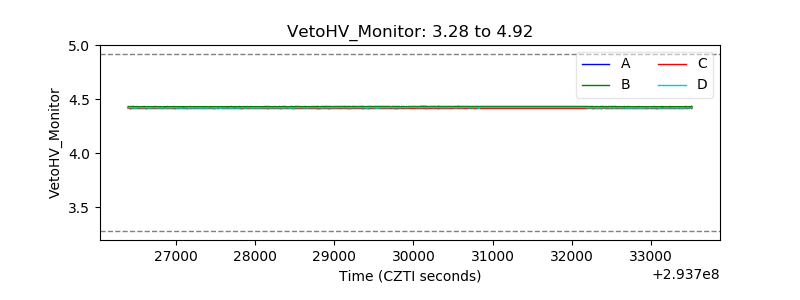 |
| Veto LLD | 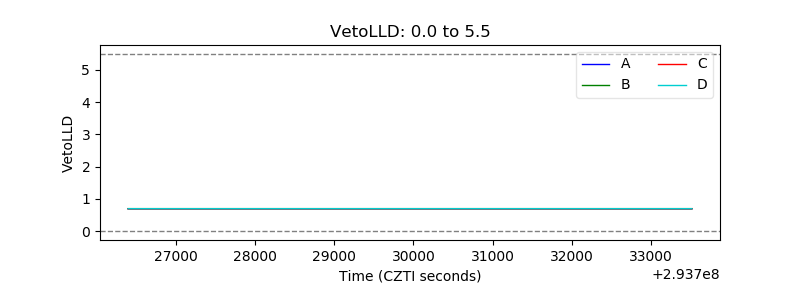 |
| Alpha Counter | 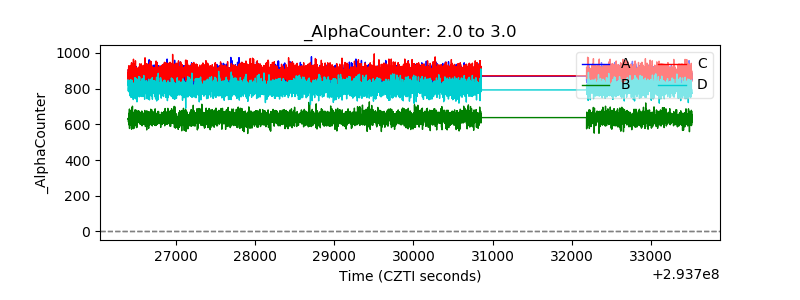 |
| _CPM_Rate | 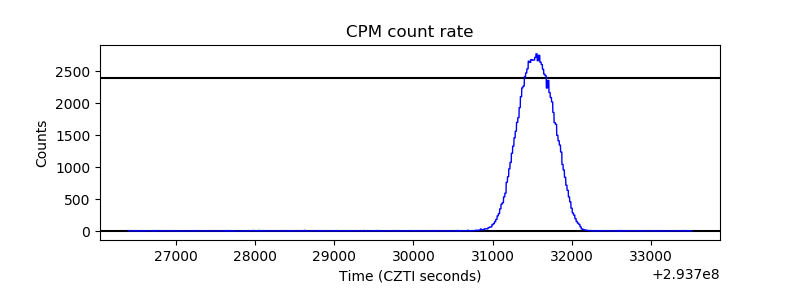 |
| CZT Counter | 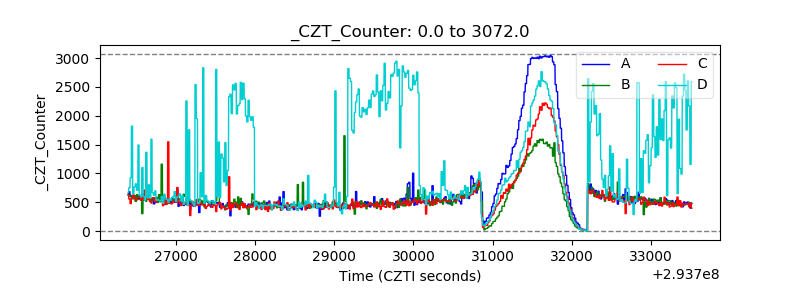 |
| +2.5 Volts monitor |  |
| +5 Volts monitor | 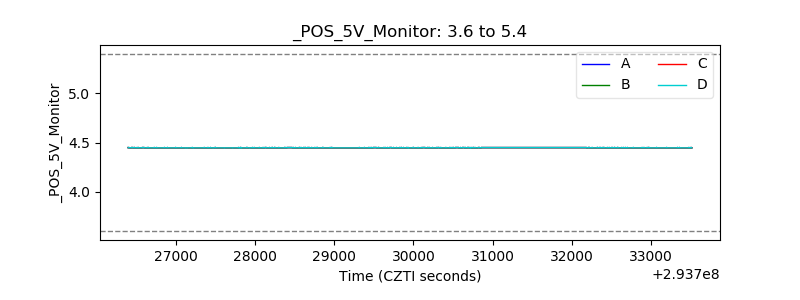 |
| _ROLL_ROT | 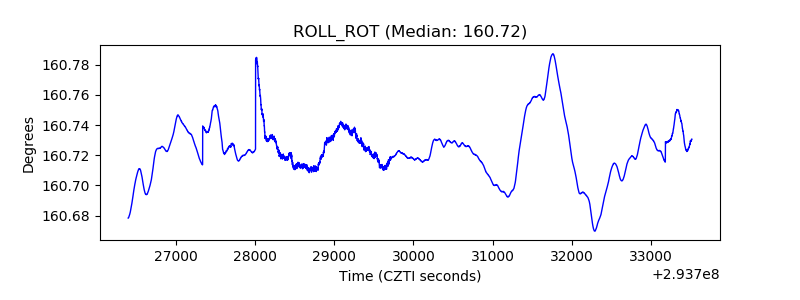 |
| _Roll_DEC | 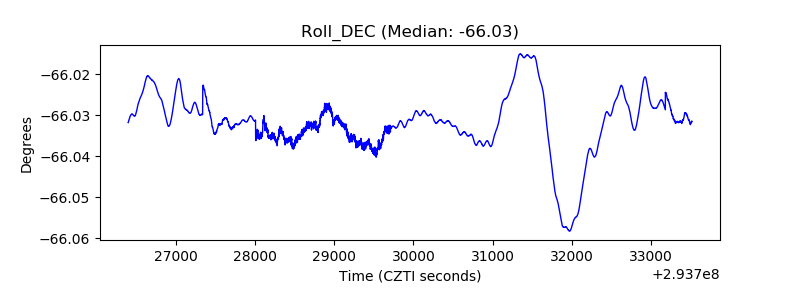 |
| _Roll_RA | 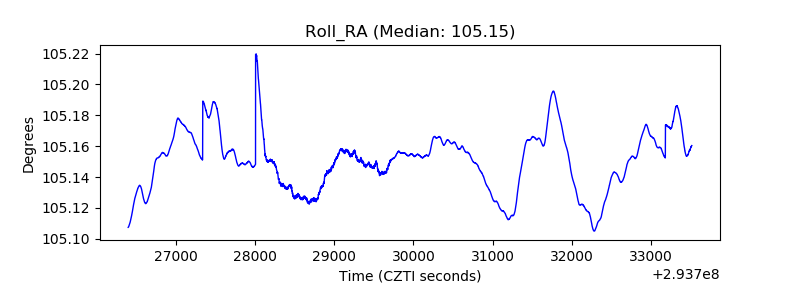 |
| Veto Counter | 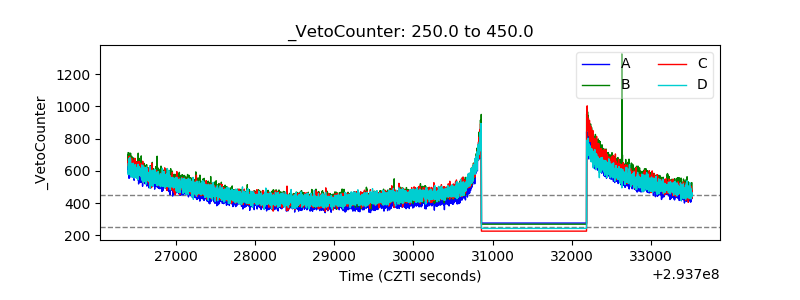 |