| Param | Original file | Final file |
|---|---|---|
| Filename | modeM0/AS1T03_099T03_9000002854_19295cztM0_level2.evt | modeM0/AS1T03_099T03_9000002854_19295cztM0_level2_quad_clean.evt |
| Size (bytes) | 501,102,720 | 109,085,760 |
| Size | 477.9 MB | 104.0 MB |
| Events in quadrant A | 3,054,295 | 749,520 |
| Events in quadrant B | 3,192,930 | 759,937 |
| Events in quadrant C | 2,985,484 | 705,191 |
| Events in quadrant D | 5,526,954 | 660,717 |
| Mode SS | |||
|---|---|---|---|
| Quadrant | BADHDUFLAG | Total packets | Discarded packets |
| A | 0 | 126 | 0 |
| B | 0 | 126 | 0 |
| C | 0 | 126 | 0 |
| D | 0 | 126 | 0 |
| Mode M9 | |||
|---|---|---|---|
| Quadrant | BADHDUFLAG | Total packets | Discarded packets |
| A | 0 | 13 | 0 |
| B | 0 | 13 | 0 |
| C | 0 | 13 | 0 |
| D | 0 | 13 | 0 |
| Mode M0 | |||
|---|---|---|---|
| Quadrant | BADHDUFLAG | Total packets | Discarded packets |
| A | 0 | 12952 | 1 |
| B | 0 | 13339 | 1 |
| C | 0 | 12825 | 1 |
| D | 0 | 20558 | 1 |
| Quadrant | Total seconds | Saturated seconds | Saturation percentage |
|---|---|---|---|
| A | 6129 | 76 | 1.240007% |
| B | 6129 | 99 | 1.615272% |
| C | 6129 | 81 | 1.321586% |
| D | 6129 | 675 | 11.013216% |
Noise dominated data is calculated using 1-second bins in cleaned event files. If a bin has >2000 counts, and if more than 50% of those come from <1% of pixels, then it is considered to be noise-dominated and hence unusable.
| Quadrant | # 1 sec bins | Bins with >0 counts | Bins with >2000 counts | High rate bins dominated by noise | Noise dominated (total time) | Noise dominated (detector-on time) | Marked lightcurve |
|---|---|---|---|---|---|---|---|
| A | 7454 | 6129 | 1 | 1 | 0.01% | 0.02% |  |
| B | 7454 | 6130 | 9 | 9 | 0.12% | 0.15% |  |
| C | 7454 | 6130 | 0 | 0 | 0.00% | 0.00% |  |
| D | 7454 | 6130 | 693 | 693 | 9.30% | 11.31% |  |
Top three noisy pixels from each quadrant. If the there are fewer than three noisy pixels in the level2.evt file, extra rows are filled as -1
| Pixel properties | Quadrant properties | ||||||
|---|---|---|---|---|---|---|---|
| Quadrant | DetID | PixID | Counts | Sigma | Mean | Median | Sigma |
| A | 5 | 16 | 11232 | 66.52 | 789 | 776 | 157.2 |
| A | 13 | 254 | 8671 | 50.23 | 789 | 776 | 157.2 |
| A | 0 | 226 | 6954 | 39.3 | 789 | 776 | 157.2 |
| B | 3 | 64 | 39117 | 263.49 | 781 | 765 | 145.6 |
| B | 0 | 229 | 28837 | 192.86 | 781 | 765 | 145.6 |
| B | 0 | 197 | 25921 | 172.83 | 781 | 765 | 145.6 |
| C | 14 | 238 | 116813 | 687.69 | 733 | 737 | 168.8 |
| C | 3 | 233 | 7997 | 43.01 | 733 | 737 | 168.8 |
| C | 13 | 61 | 5100 | 25.85 | 733 | 737 | 168.8 |
| D | 7 | 238 | 2222671 | 12674.24 | 726 | 703 | 175.3 |
| D | 1 | 52 | 343611 | 1955.97 | 726 | 703 | 175.3 |
| D | 0 | 32 | 120740 | 684.7 | 726 | 703 | 175.3 |
Histogram calculated using DETX and DETY for each event in the final _common_clean file
| Quadrant A |  |
 |
Quadrant B |
|---|---|---|---|
| Quadrant D |  |
 |
Quadrant C |
| Plot type | Count rate plots | Images |
|---|---|---|
| Comparison with Poisson distribution Blue bars denote a histogram of data divided into 1 sec bins. Red curve is a Poisson curve with rate = median count rate of data. |
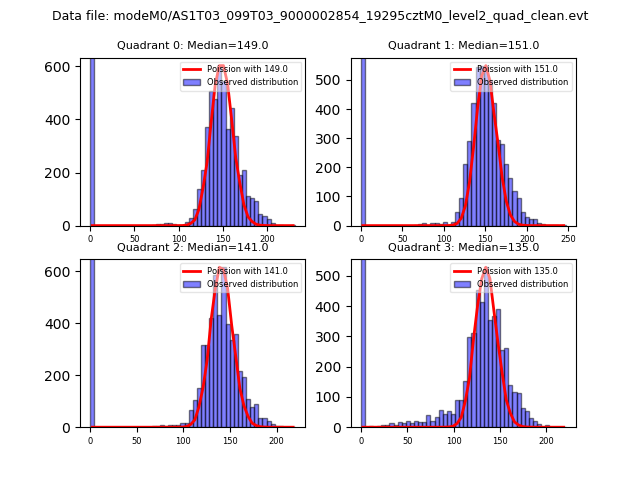 |
 |
| Quadrant-wise count rates Data is divided into 100 sec bins |
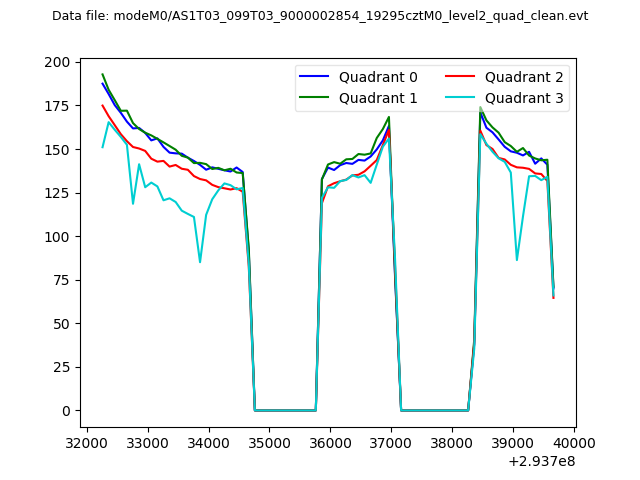 |
|
| Module-wise count rates for Quadrant A Data is divided into 100 sec bins |
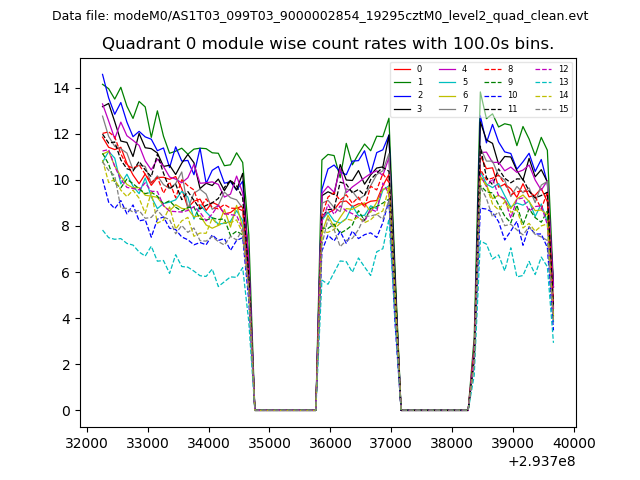 |
 |
| Module-wise count rates for Quadrant B Data is divided into 100 sec bins |
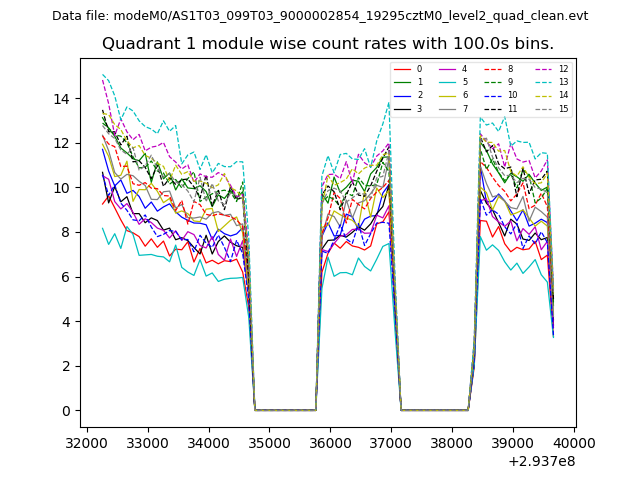 |
 |
| Module-wise count rates for Quadrant C Data is divided into 100 sec bins |
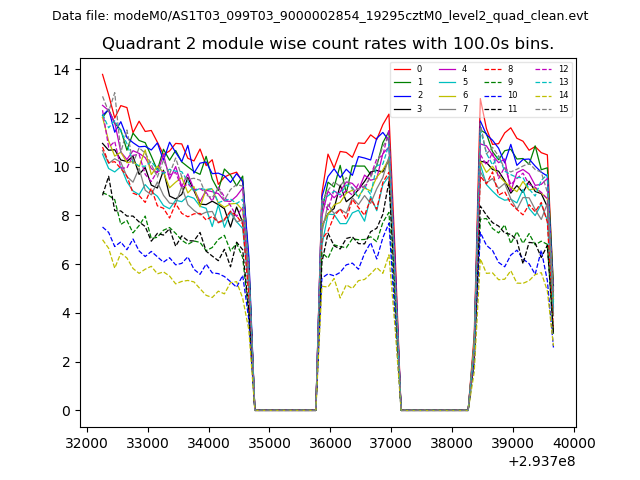 |
 |
| Module-wise count rates for Quadrant D Data is divided into 100 sec bins |
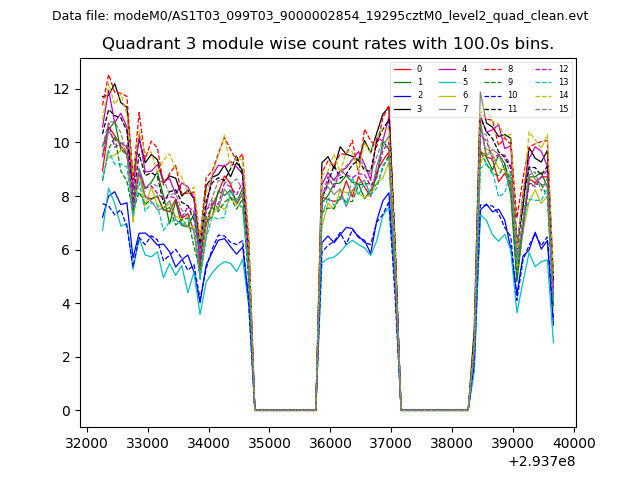 |
 |
| Parameter | Plot |
|---|---|
| CZT HV Monitor | 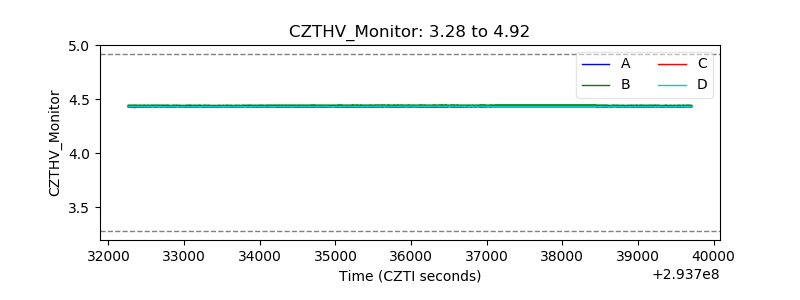 |
| D_VDD |  |
| Temperature 1 |  |
| Veto HV Monitor |  |
| Veto LLD |  |
| Alpha Counter | 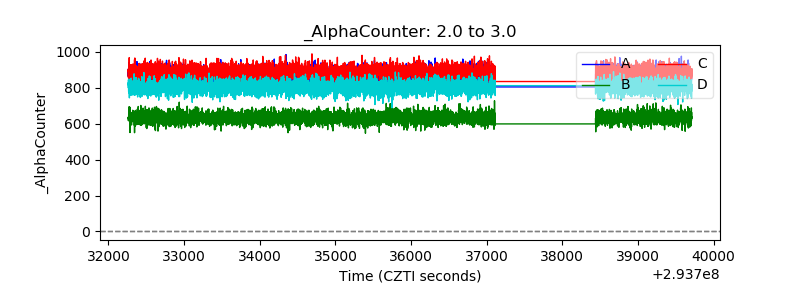 |
| _CPM_Rate | 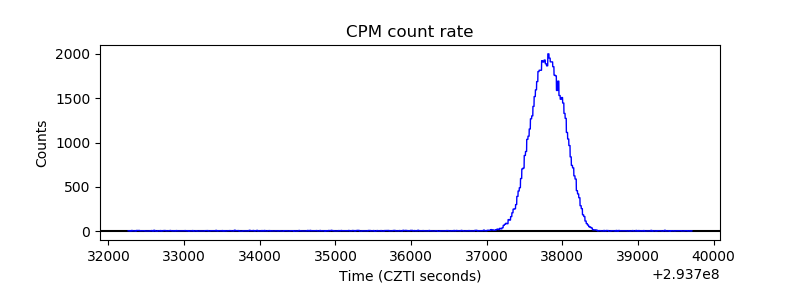 |
| CZT Counter |  |
| +2.5 Volts monitor |  |
| +5 Volts monitor |  |
| _ROLL_ROT | 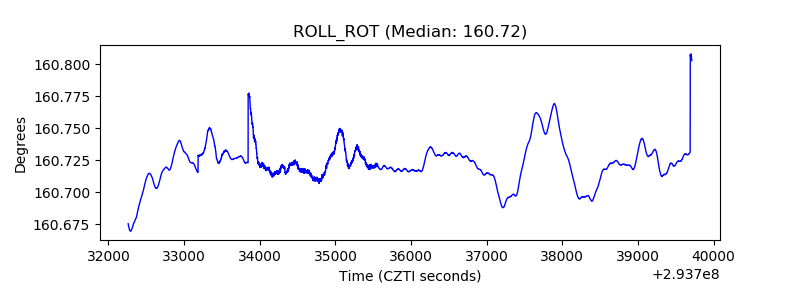 |
| _Roll_DEC | 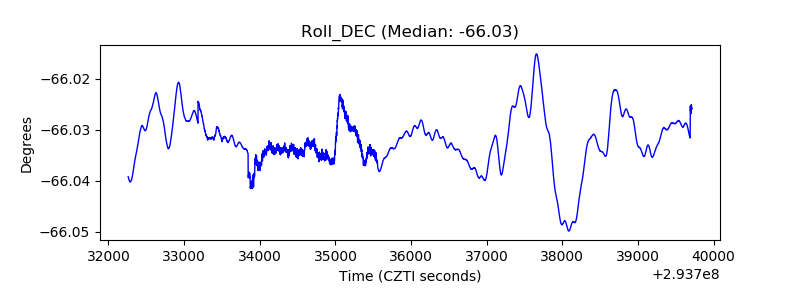 |
| _Roll_RA |  |
| Veto Counter | 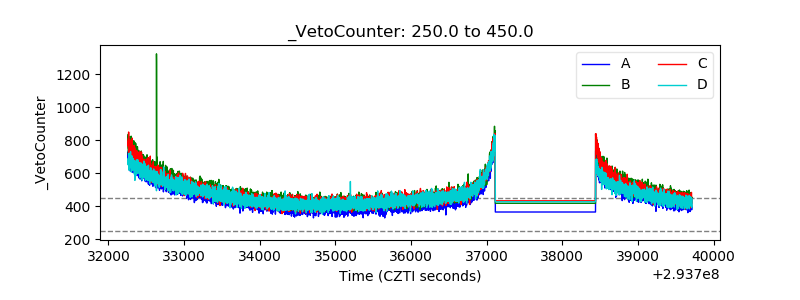 |