| Param | Original file | Final file |
|---|---|---|
| Filename | modeM0/AS1T03_099T03_9000002854_19297cztM0_level2.evt | modeM0/AS1T03_099T03_9000002854_19297cztM0_level2_quad_clean.evt |
| Size (bytes) | 443,770,560 | 107,804,160 |
| Size | 423.2 MB | 102.8 MB |
| Events in quadrant A | 3,028,710 | 727,577 |
| Events in quadrant B | 3,184,812 | 738,814 |
| Events in quadrant C | 2,979,734 | 690,014 |
| Events in quadrant D | 3,819,096 | 669,900 |
| Mode SS | |||
|---|---|---|---|
| Quadrant | BADHDUFLAG | Total packets | Discarded packets |
| A | 0 | 128 | 0 |
| B | 0 | 128 | 0 |
| C | 0 | 128 | 0 |
| D | 0 | 128 | 0 |
| Mode M9 | |||
|---|---|---|---|
| Quadrant | BADHDUFLAG | Total packets | Discarded packets |
| A | 0 | 14 | 0 |
| B | 0 | 15 | 0 |
| C | 0 | 15 | 0 |
| D | 0 | 15 | 0 |
| Mode M0 | |||
|---|---|---|---|
| Quadrant | BADHDUFLAG | Total packets | Discarded packets |
| A | 0 | 13112 | 2 |
| B | 0 | 13483 | 2 |
| C | 0 | 13060 | 2 |
| D | 0 | 15687 | 2 |
| Quadrant | Total seconds | Saturated seconds | Saturation percentage |
|---|---|---|---|
| A | 6285 | 35 | 0.556881% |
| B | 6285 | 62 | 0.986476% |
| C | 6285 | 48 | 0.763723% |
| D | 6285 | 262 | 4.168656% |
Noise dominated data is calculated using 1-second bins in cleaned event files. If a bin has >2000 counts, and if more than 50% of those come from <1% of pixels, then it is considered to be noise-dominated and hence unusable.
| Quadrant | # 1 sec bins | Bins with >0 counts | Bins with >2000 counts | High rate bins dominated by noise | Noise dominated (total time) | Noise dominated (detector-on time) | Marked lightcurve |
|---|---|---|---|---|---|---|---|
| A | 7480 | 6286 | 1 | 1 | 0.01% | 0.02% | 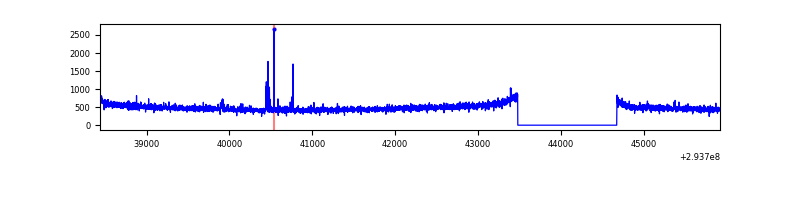 |
| B | 7480 | 6286 | 8 | 8 | 0.11% | 0.13% | 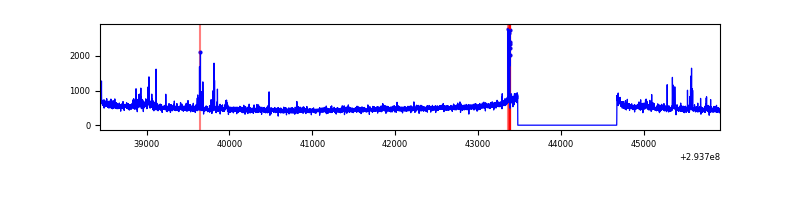 |
| C | 7480 | 6286 | 1 | 1 | 0.01% | 0.02% | 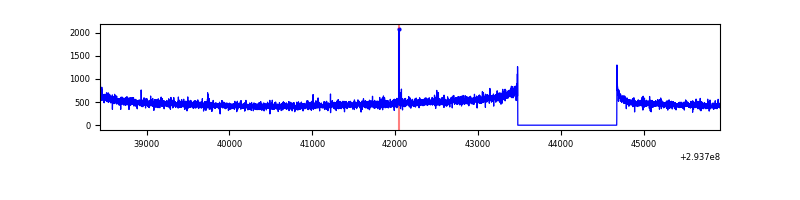 |
| D | 7480 | 6286 | 239 | 239 | 3.20% | 3.80% | 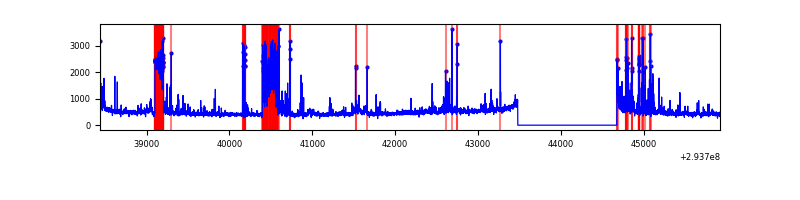 |
Top three noisy pixels from each quadrant. If the there are fewer than three noisy pixels in the level2.evt file, extra rows are filled as -1
| Pixel properties | Quadrant properties | ||||||
|---|---|---|---|---|---|---|---|
| Quadrant | DetID | PixID | Counts | Sigma | Mean | Median | Sigma |
| A | 5 | 16 | 20857 | 128.34 | 778 | 764 | 156.6 |
| A | 13 | 254 | 8684 | 50.59 | 778 | 764 | 156.6 |
| A | 0 | 31 | 8078 | 46.72 | 778 | 764 | 156.6 |
| B | 0 | 197 | 43238 | 293.28 | 774 | 756 | 144.8 |
| B | 0 | 229 | 32166 | 216.85 | 774 | 756 | 144.8 |
| B | 6 | 36 | 25592 | 171.46 | 774 | 756 | 144.8 |
| C | 14 | 238 | 116548 | 685.36 | 730 | 732 | 169.0 |
| C | 3 | 233 | 9847 | 53.94 | 730 | 732 | 169.0 |
| C | 5 | 112 | 6552 | 34.44 | 730 | 732 | 169.0 |
| D | 1 | 52 | 850042 | 4795.93 | 729 | 707 | 177.1 |
| D | 13 | 138 | 149229 | 838.66 | 729 | 707 | 177.1 |
| D | 2 | 234 | 26606 | 146.24 | 729 | 707 | 177.1 |
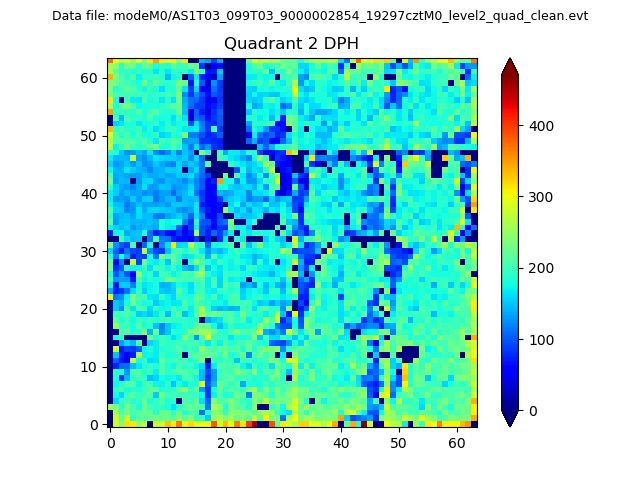
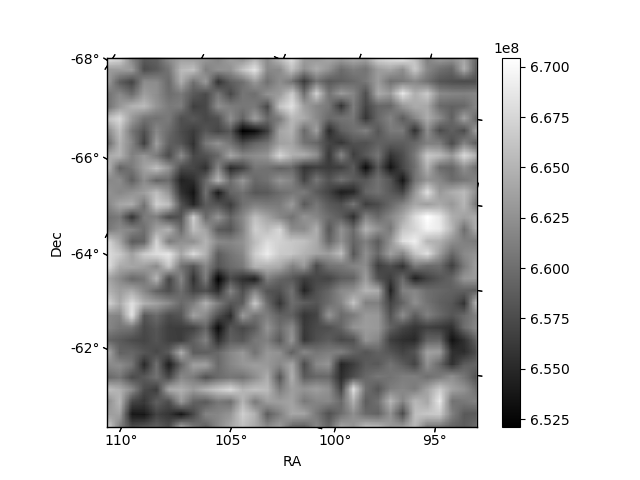
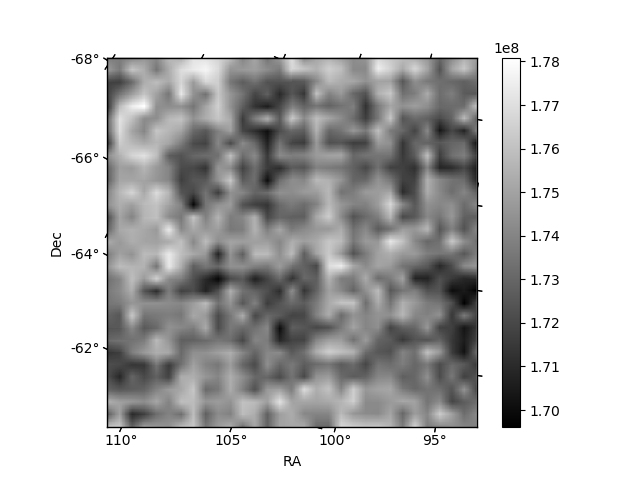
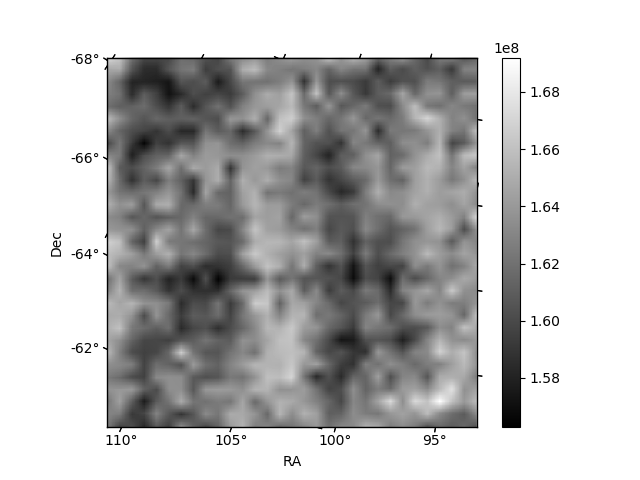
Histogram calculated using DETX and DETY for each event in the final _common_clean file
| Quadrant A | 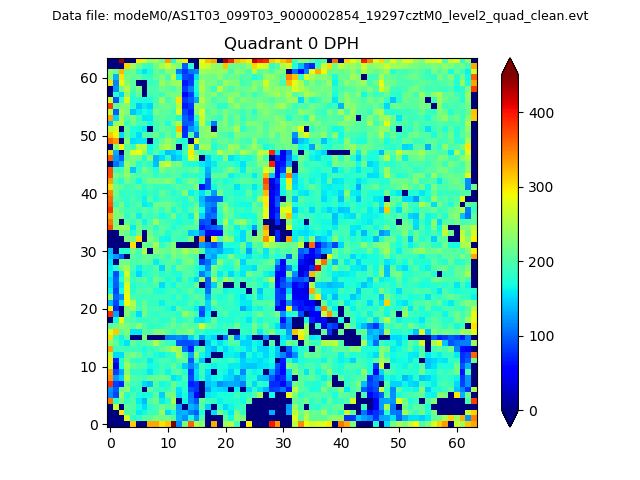 |
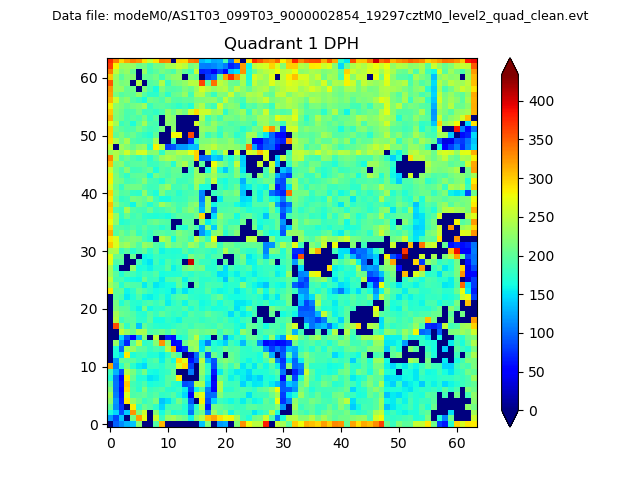 |
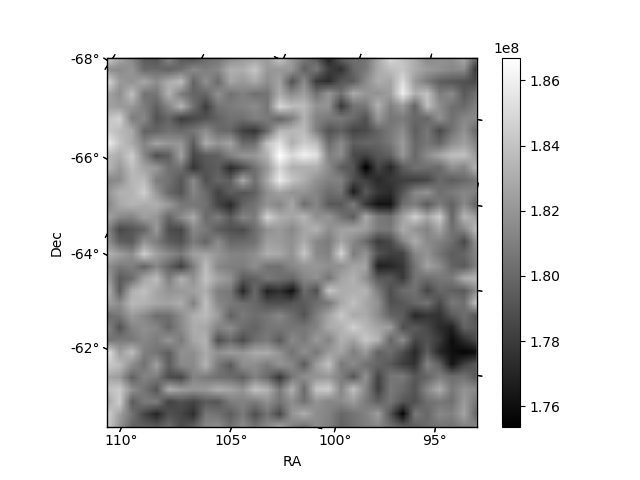
Quadrant B |
|---|---|---|---|
| Quadrant D | 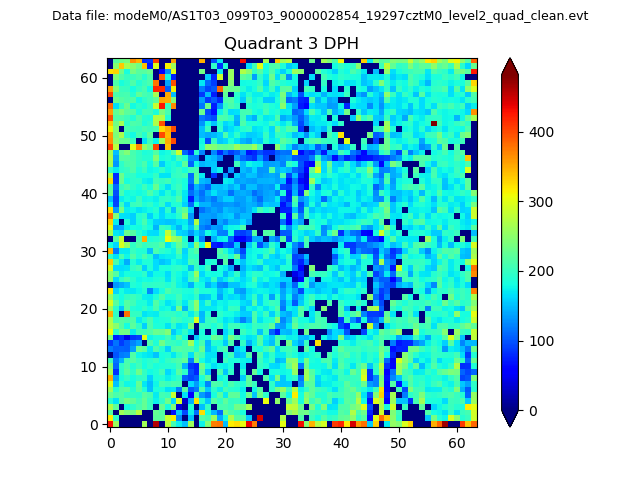 |
 |
Quadrant C |
| Plot type | Count rate plots | Images |
|---|---|---|
| Comparison with Poisson distribution Blue bars denote a histogram of data divided into 1 sec bins. Red curve is a Poisson curve with rate = median count rate of data. |
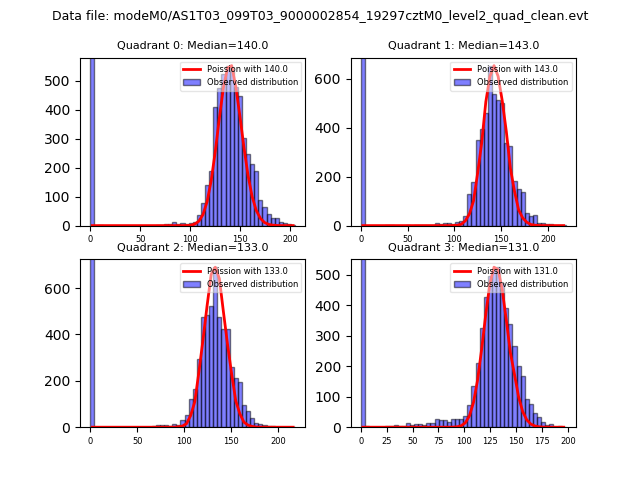 |
 |
| Quadrant-wise count rates Data is divided into 100 sec bins |
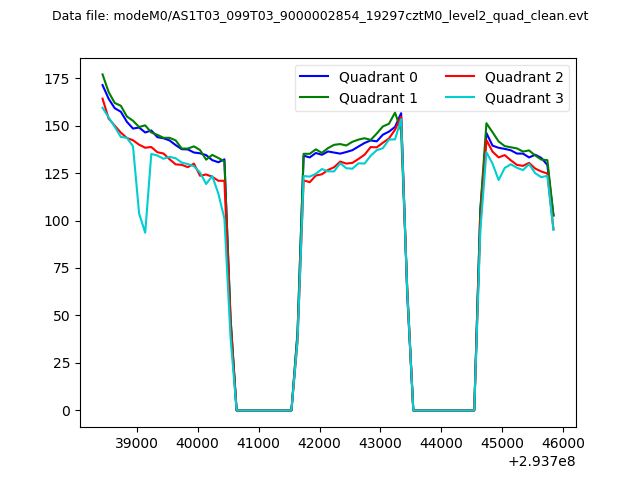 |
|
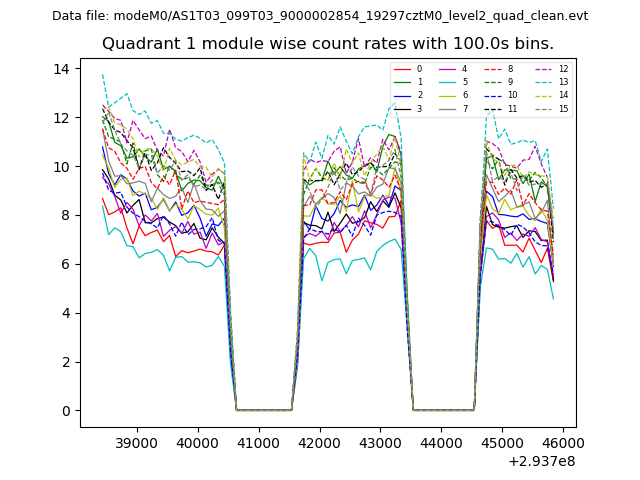
| Module-wise count rates for Quadrant A Data is divided into 100 sec bins |
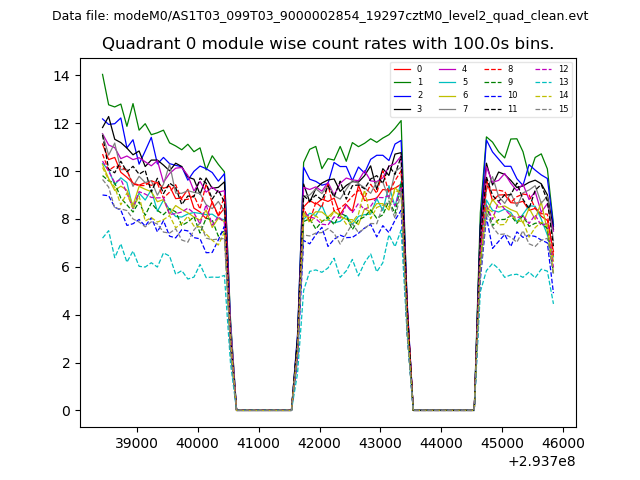 |
 |
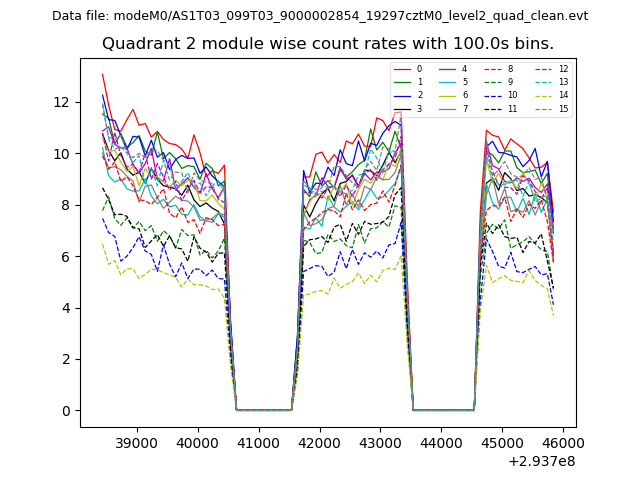
| Module-wise count rates for Quadrant B Data is divided into 100 sec bins |
 |
 |
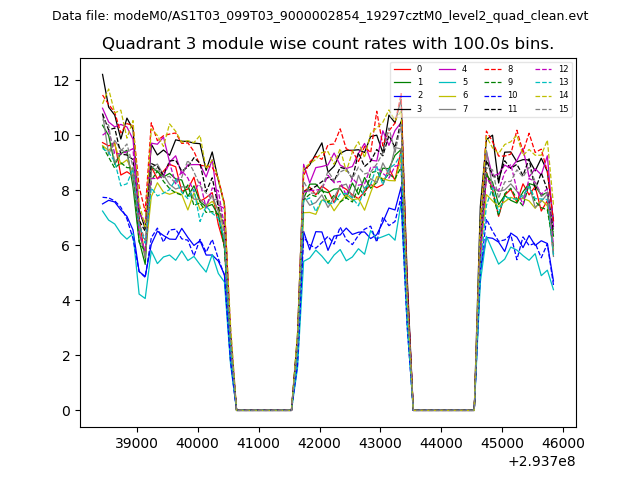
| Module-wise count rates for Quadrant C Data is divided into 100 sec bins |
 |
 |
| Module-wise count rates for Quadrant D Data is divided into 100 sec bins |
 |
 |
| Parameter | Plot |
|---|---|
| CZT HV Monitor | 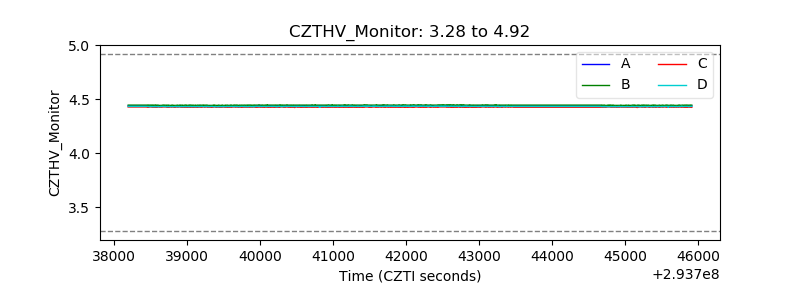 |
| D_VDD | 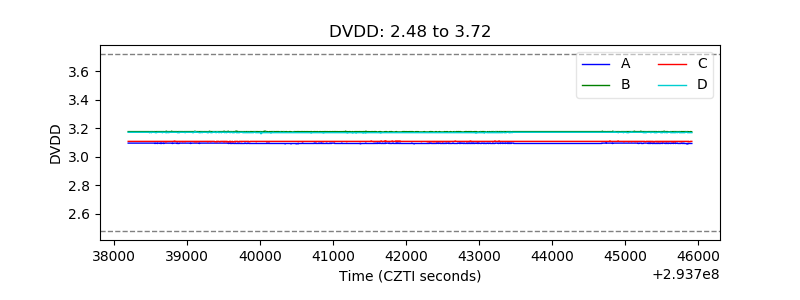 |
| Temperature 1 | 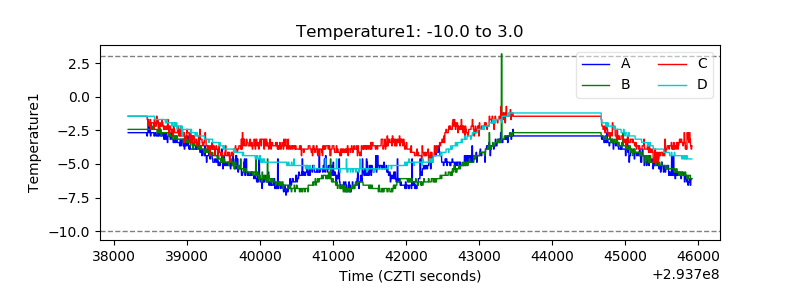 |
| Veto HV Monitor | 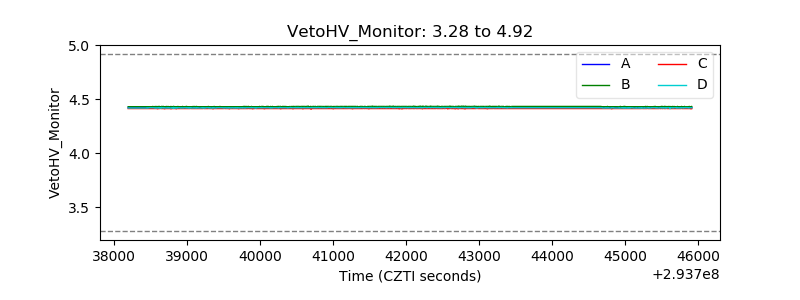 |
| Veto LLD |  |
| Alpha Counter | 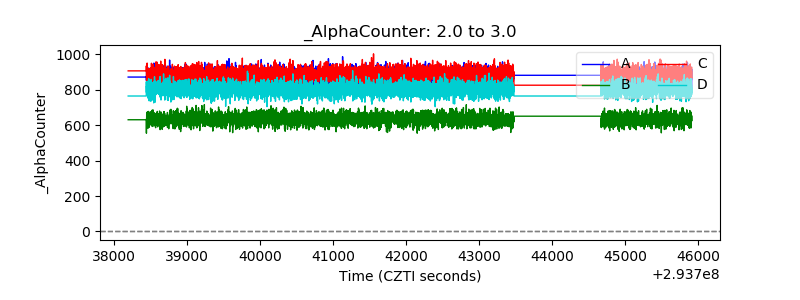 |
| _CPM_Rate | 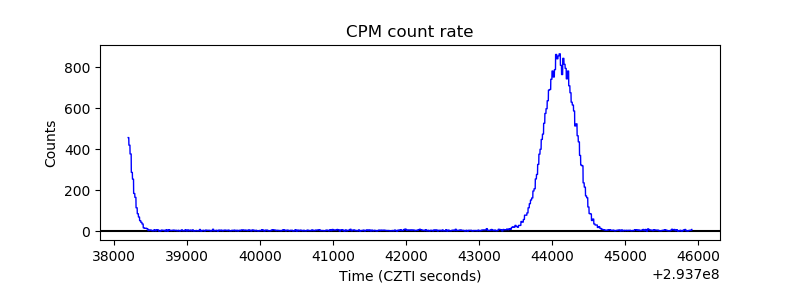 |
| CZT Counter | 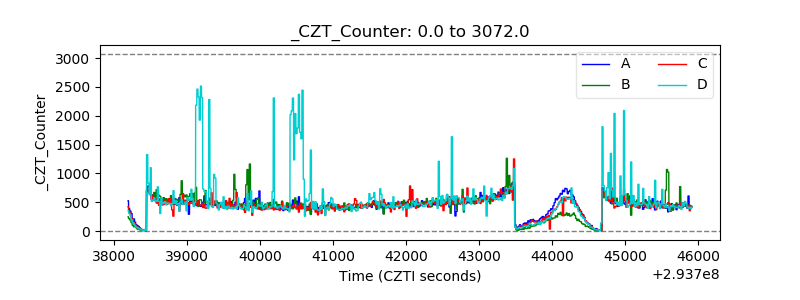 |
| +2.5 Volts monitor |  |
| +5 Volts monitor | 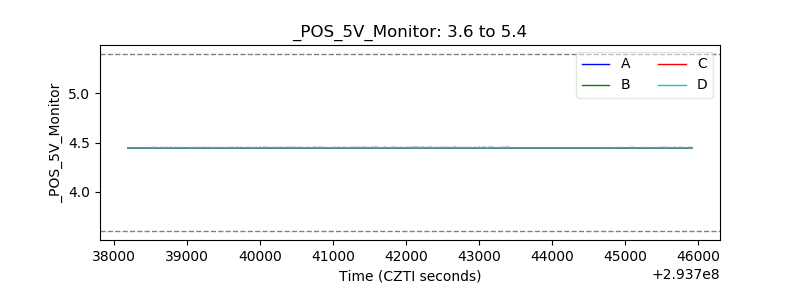 |
| _ROLL_ROT | 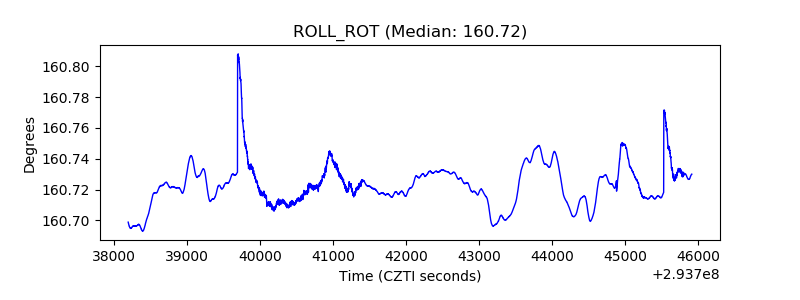 |
| _Roll_DEC | 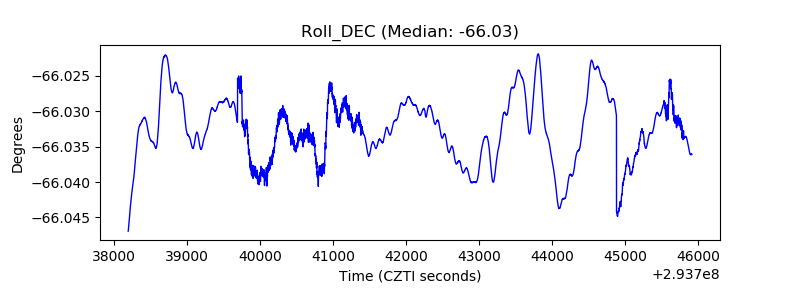 |
| _Roll_RA | 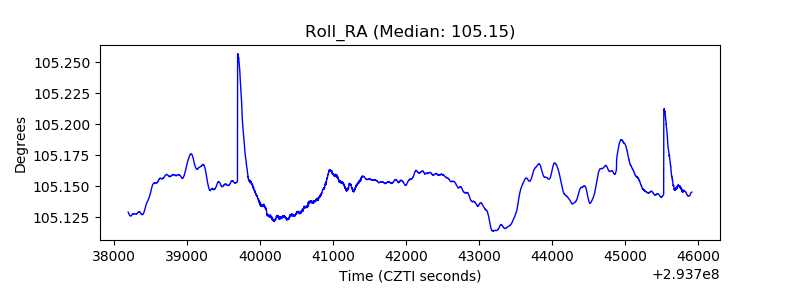 |
| Veto Counter | 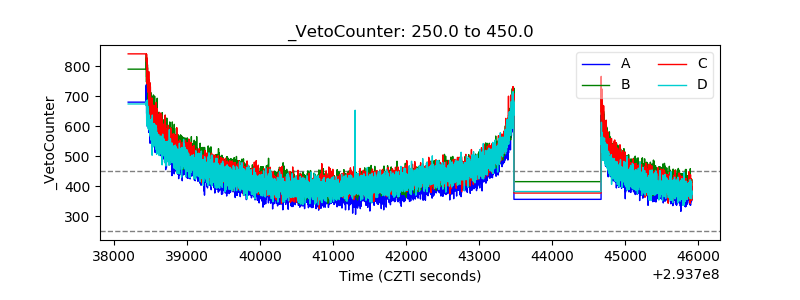 |