| Param | Original file | Final file |
|---|---|---|
| Filename | modeM0/AS1A05_025T17_9000002858cztM0_level2.fits | modeM0/AS1A05_025T17_9000002858cztM0_level2_quad_clean.evt |
| Size (bytes) | 150,598,080 | 92,937,600 |
| Size | 143.6 MB | 88.6 MB |
| Events in quadrant A | 974,242 | 491,544 |
| Events in quadrant B | 921,442 | 483,570 |
| Events in quadrant C | 923,802 | 453,794 |
| Events in quadrant D | 746,102 | 389,967 |
| Mode M0 | |||
|---|---|---|---|
| Quadrant | BADHDUFLAG | Total packets | Discarded packets |
| A | 0 | 30696 | 0 |
| B | 0 | 31340 | 0 |
| C | 0 | 30681 | 0 |
| D | 0 | 66873 | 0 |
| Mode SS | |||
|---|---|---|---|
| Quadrant | BADHDUFLAG | Total packets | Discarded packets |
| A | 0 | 296 | 0 |
| B | 0 | 296 | 0 |
| C | 0 | 296 | 0 |
| D | 0 | 296 | 0 |
| Mode M9 | |||
|---|---|---|---|
| Quadrant | BADHDUFLAG | Total packets | Discarded packets |
| A | 0 | 33 | 0 |
| B | 0 | 33 | 0 |
| C | 0 | 33 | 0 |
| D | 0 | 33 | 0 |
| Quadrant | Total seconds | Saturated seconds | Saturation percentage |
|---|---|---|---|
| A | 14398 | 178 | 1.236283% |
| B | 14398 | 225 | 1.562717% |
| C | 14396 | 255 | 1.771325% |
| D | 14395 | 2427 | 16.860021% |
Noise dominated data is calculated using 1-second bins in cleaned event files. If a bin has >2000 counts, and if more than 50% of those come from <1% of pixels, then it is considered to be noise-dominated and hence unusable.
| Quadrant | # 1 sec bins | Bins with >0 counts | Bins with >2000 counts | High rate bins dominated by noise | Noise dominated (total time) | Noise dominated (detector-on time) | Marked lightcurve |
|---|---|---|---|---|---|---|---|
| A | 17779 | 14396 | 0 | 0 | 0.00% | 0.00% |  |
| B | 17779 | 14396 | 0 | 0 | 0.00% | 0.00% |  |
| C | 17779 | 14396 | 0 | 0 | 0.00% | 0.00% |  |
| D | 17779 | 14393 | 0 | 0 | 0.00% | 0.00% |  |
Top three noisy pixels from each quadrant. If the there are fewer than three noisy pixels in the level2.evt file, extra rows are filled as -1
| Pixel properties | Quadrant properties | ||||||
|---|---|---|---|---|---|---|---|
| Quadrant | DetID | PixID | Counts | Sigma | Mean | Median | Sigma |
| A | 0 | 29 | 878 | 10.26 | 254 | 242 | 62.0 |
| A | 7 | 110 | 746 | 8.13 | 254 | 242 | 62.0 |
| A | 9 | 19 | 723 | 7.76 | 254 | 242 | 62.0 |
| B | 2 | 9 | 670 | 8.89 | 244 | 236 | 48.8 |
| B | 5 | 128 | 622 | 7.91 | 244 | 236 | 48.8 |
| B | 5 | 255 | 579 | 7.03 | 244 | 236 | 48.8 |
| C | 1 | 81 | 720 | 7.73 | 244 | 231 | 63.3 |
| C | 1 | 80 | 715 | 7.65 | 244 | 231 | 63.3 |
| C | 3 | 126 | 668 | 6.9 | 244 | 231 | 63.3 |
| D | 4 | 246 | 609 | 7.06 | 213 | 196 | 58.5 |
| D | 6 | 67 | 579 | 6.55 | 213 | 196 | 58.5 |
| D | 6 | 38 | 530 | 5.71 | 213 | 196 | 58.5 |
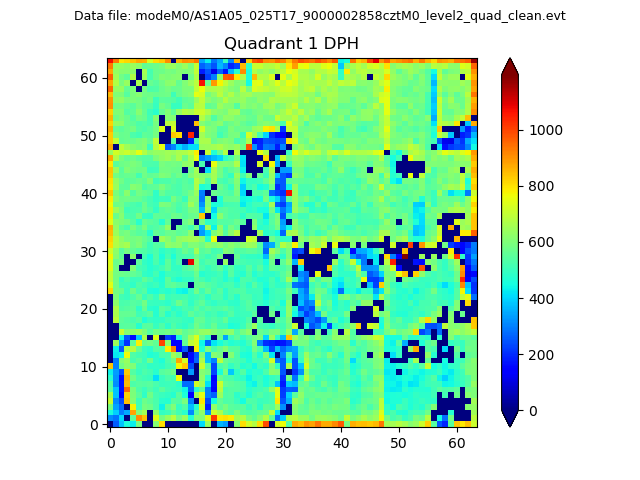
Histogram calculated using DETX and DETY for each event in the final _common_clean file
| Quadrant A |  |
 |
Quadrant B |
|---|---|---|---|
| Quadrant D |  |
 |
Quadrant C |
| Plot type | Count rate plots | Images |
|---|---|---|
| Comparison with Poisson distribution Blue bars denote a histogram of data divided into 1 sec bins. Red curve is a Poisson curve with rate = median count rate of data. |
 |
 |
| Quadrant-wise count rates Data is divided into 100 sec bins |
 |
|
| Module-wise count rates for Quadrant A Data is divided into 100 sec bins |
 |
 |
| Module-wise count rates for Quadrant B Data is divided into 100 sec bins |
 |
 |
| Module-wise count rates for Quadrant C Data is divided into 100 sec bins |
 |
 |
| Module-wise count rates for Quadrant D Data is divided into 100 sec bins |
 |
 |
| Parameter | Plot |
|---|---|
| CZT HV Monitor |  |
| D_VDD |  |
| Temperature 1 | 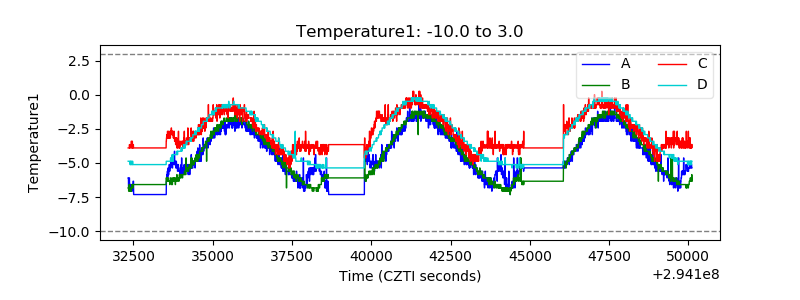 |
| Veto HV Monitor |  |
| Veto LLD |  |
| Alpha Counter |  |
| _CPM_Rate |  |
| CZT Counter |  |
| +2.5 Volts monitor |  |
| +5 Volts monitor |  |
| _ROLL_ROT |  |
| _Roll_DEC |  |
| _Roll_RA |  |
| Veto Counter |  |