| Param | Original file | Final file |
|---|---|---|
| Filename | modeM0/AS1A05_025T17_9000002858_19364cztM0_level2.evt | modeM0/AS1A05_025T17_9000002858_19364cztM0_level2_quad_clean.evt |
| Size (bytes) | 608,760,000 | 126,144,000 |
| Size | 580.6 MB | 120.3 MB |
| Events in quadrant A | 3,050,153 | 884,314 |
| Events in quadrant B | 3,153,966 | 893,034 |
| Events in quadrant C | 3,092,194 | 856,130 |
| Events in quadrant D | 8,719,698 | 753,248 |
| Mode M0 | |||
|---|---|---|---|
| Quadrant | BADHDUFLAG | Total packets | Discarded packets |
| A | 0 | 13144 | 1 |
| B | 0 | 13326 | 1 |
| C | 0 | 13273 | 1 |
| D | 0 | 30251 | 1 |
| Mode SS | |||
|---|---|---|---|
| Quadrant | BADHDUFLAG | Total packets | Discarded packets |
| A | 0 | 126 | 0 |
| B | 0 | 126 | 0 |
| C | 0 | 126 | 0 |
| D | 0 | 126 | 0 |
| Mode M9 | |||
|---|---|---|---|
| Quadrant | BADHDUFLAG | Total packets | Discarded packets |
| A | 0 | 11 | 0 |
| B | 0 | 11 | 0 |
| C | 0 | 11 | 0 |
| D | 0 | 11 | 0 |
| Quadrant | Total seconds | Saturated seconds | Saturation percentage |
|---|---|---|---|
| A | 6212 | 68 | 1.094656% |
| B | 6212 | 95 | 1.529298% |
| C | 6212 | 117 | 1.883451% |
| D | 6213 | 1386 | 22.308064% |
Noise dominated data is calculated using 1-second bins in cleaned event files. If a bin has >2000 counts, and if more than 50% of those come from <1% of pixels, then it is considered to be noise-dominated and hence unusable.
| Quadrant | # 1 sec bins | Bins with >0 counts | Bins with >2000 counts | High rate bins dominated by noise | Noise dominated (total time) | Noise dominated (detector-on time) | Marked lightcurve |
|---|---|---|---|---|---|---|---|
| A | 7332 | 6212 | 0 | 0 | 0.00% | 0.00% | 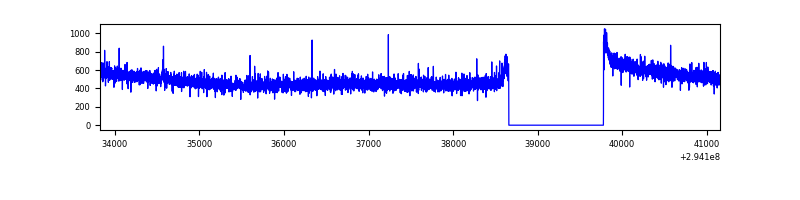 |
| B | 7332 | 6212 | 12 | 12 | 0.16% | 0.19% | 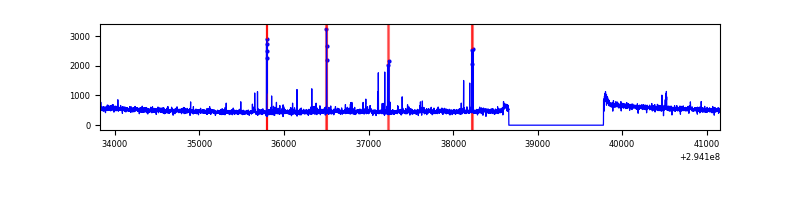 |
| C | 7332 | 6212 | 1 | 1 | 0.01% | 0.02% | 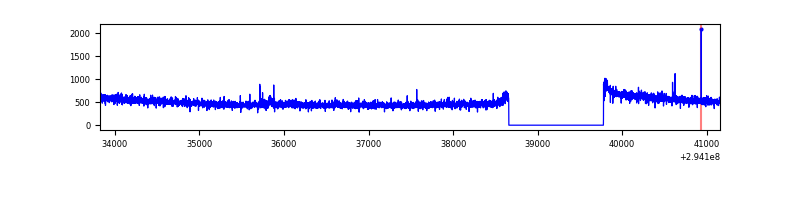 |
| D | 7333 | 6213 | 1238 | 1238 | 16.88% | 19.93% | 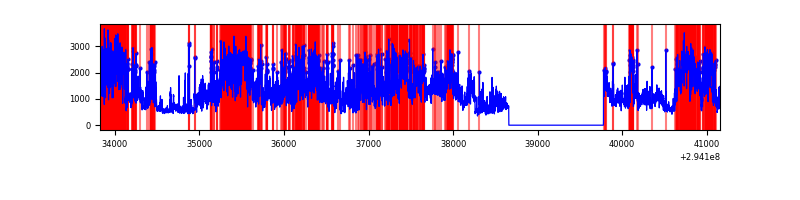 |
Top three noisy pixels from each quadrant. If the there are fewer than three noisy pixels in the level2.evt file, extra rows are filled as -1
| Pixel properties | Quadrant properties | ||||||
|---|---|---|---|---|---|---|---|
| Quadrant | DetID | PixID | Counts | Sigma | Mean | Median | Sigma |
| A | 13 | 254 | 7193 | 40.75 | 791 | 775 | 157.5 |
| A | 0 | 226 | 6731 | 37.82 | 791 | 775 | 157.5 |
| A | 12 | 194 | 5799 | 31.9 | 791 | 775 | 157.5 |
| B | 3 | 64 | 40388 | 273.55 | 780 | 761 | 144.9 |
| B | 7 | 220 | 19214 | 127.38 | 780 | 761 | 144.9 |
| B | 12 | 111 | 16279 | 107.12 | 780 | 761 | 144.9 |
| C | 14 | 238 | 120302 | 685.73 | 755 | 762 | 174.3 |
| C | 3 | 233 | 16028 | 87.57 | 755 | 762 | 174.3 |
| C | 9 | 160 | 5897 | 29.46 | 755 | 762 | 174.3 |
| D | 10 | 66 | 3181242 | 18487.9 | 716 | 698 | 172.0 |
| D | 7 | 238 | 1396430 | 8113.12 | 716 | 698 | 172.0 |
| D | 1 | 52 | 915137 | 5315.46 | 716 | 698 | 172.0 |
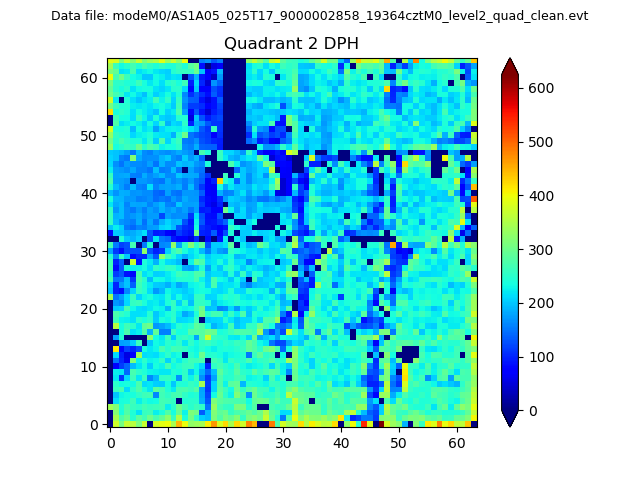
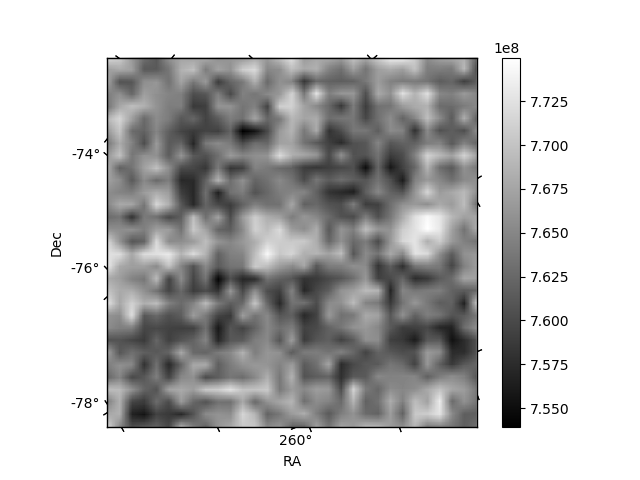
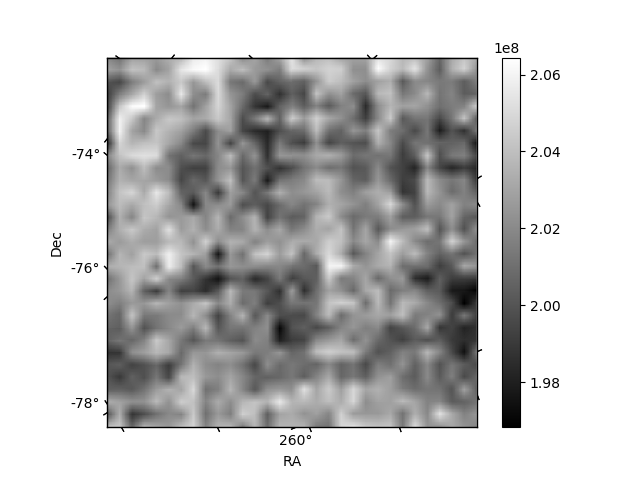
Histogram calculated using DETX and DETY for each event in the final _common_clean file
| Quadrant A | 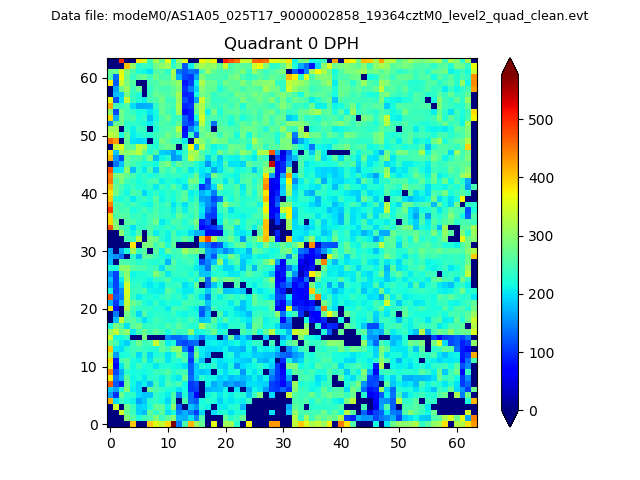 |
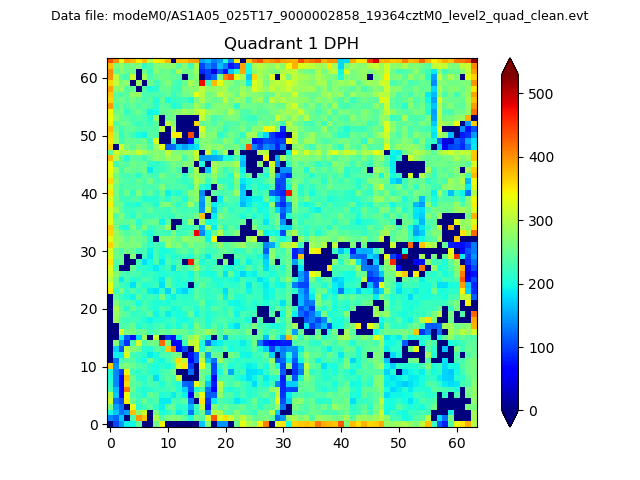 |
Quadrant B |
|---|---|---|---|
| Quadrant D | 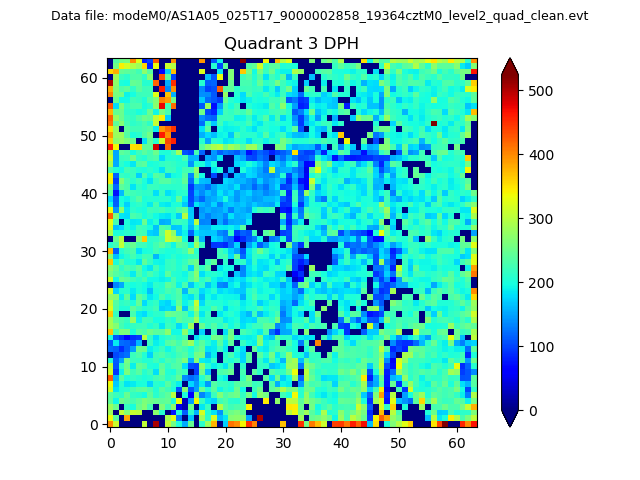 |
 |
Quadrant C |
| Plot type | Count rate plots | Images |
|---|---|---|
| Comparison with Poisson distribution Blue bars denote a histogram of data divided into 1 sec bins. Red curve is a Poisson curve with rate = median count rate of data. |
 |
 |
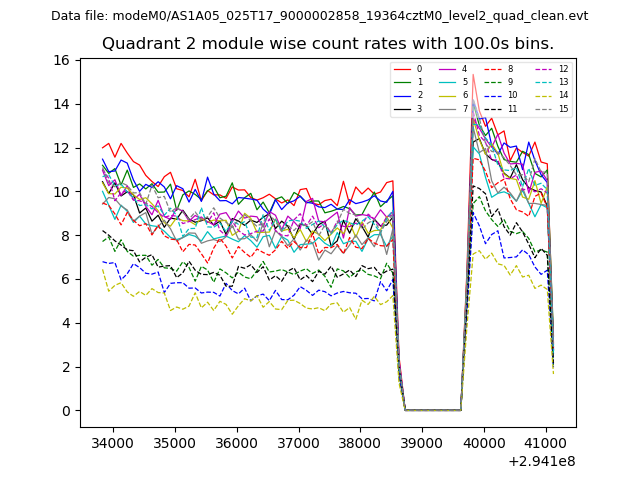
| Quadrant-wise count rates Data is divided into 100 sec bins |
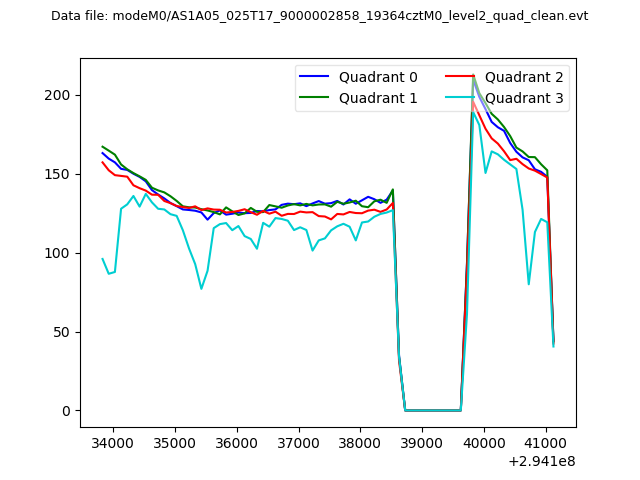 |
|
| Module-wise count rates for Quadrant A Data is divided into 100 sec bins |
 |
 |
| Module-wise count rates for Quadrant B Data is divided into 100 sec bins |
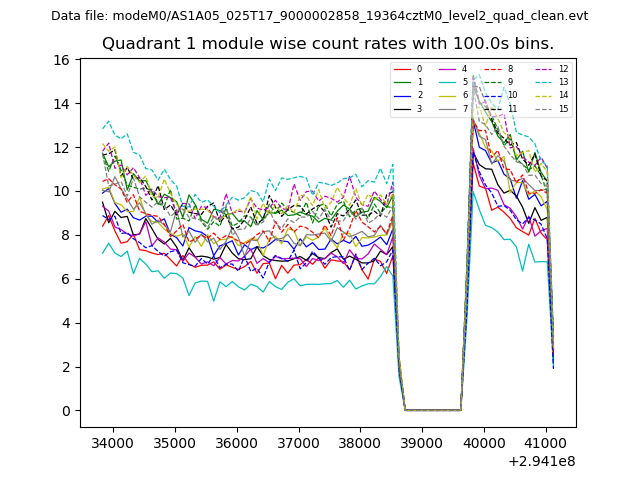 |
 |
| Module-wise count rates for Quadrant C Data is divided into 100 sec bins |
 |
 |
| Module-wise count rates for Quadrant D Data is divided into 100 sec bins |
 |
 |
| Parameter | Plot |
|---|---|
| CZT HV Monitor | 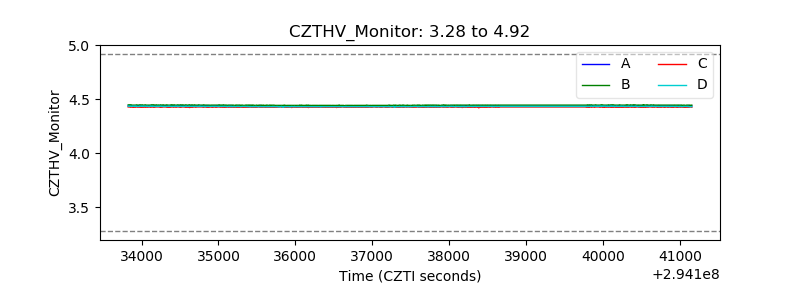 |
| D_VDD | 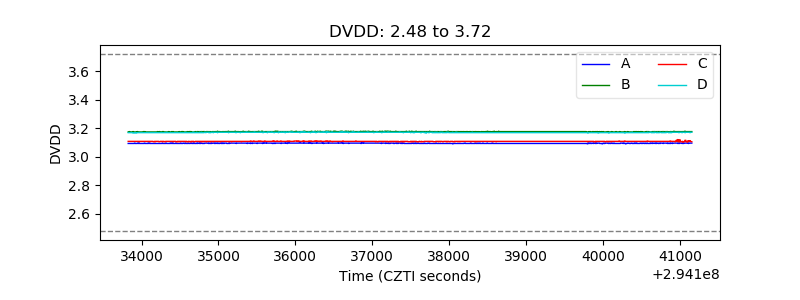 |
| Temperature 1 | 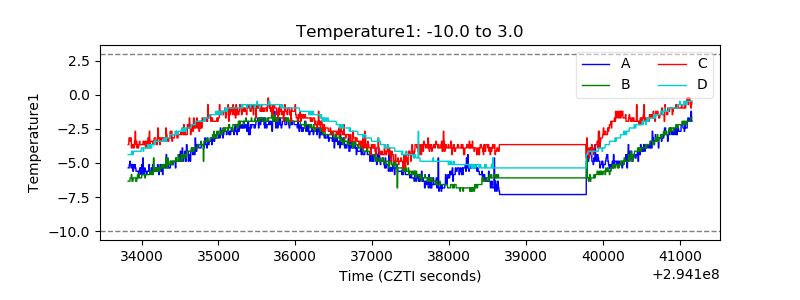 |
| Veto HV Monitor | 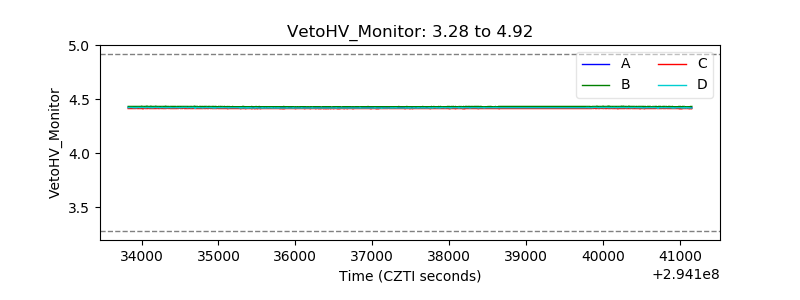 |
| Veto LLD | 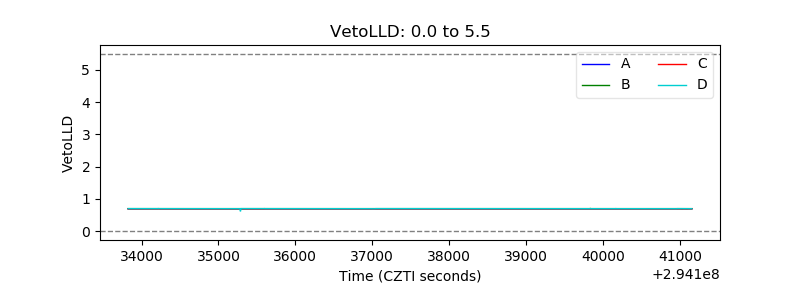 |
| Alpha Counter | 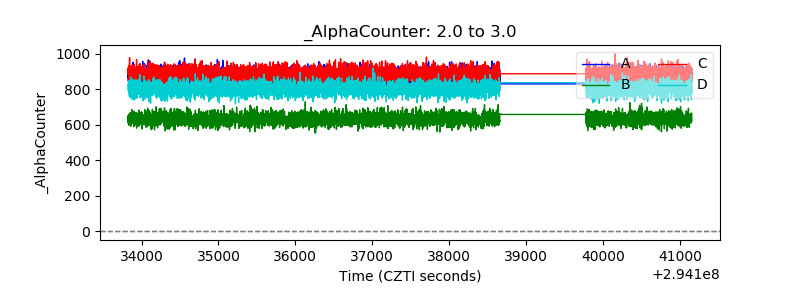 |
| _CPM_Rate | 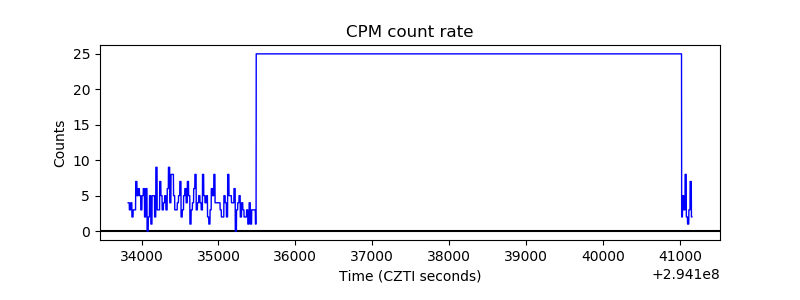 |
| CZT Counter | 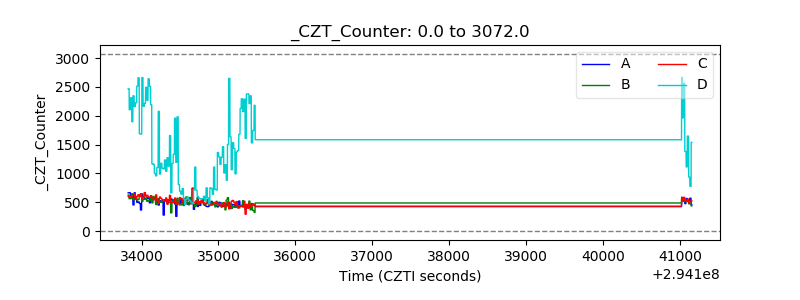 |
| +2.5 Volts monitor |  |
| +5 Volts monitor |  |
| _ROLL_ROT | 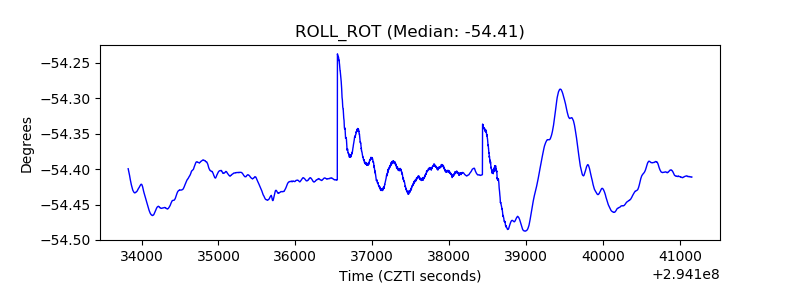 |
| _Roll_DEC | 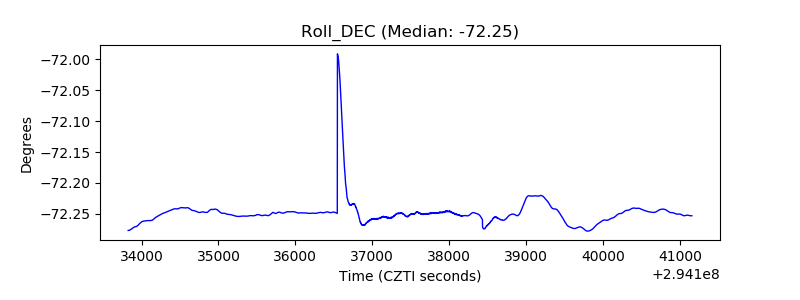 |
| _Roll_RA | 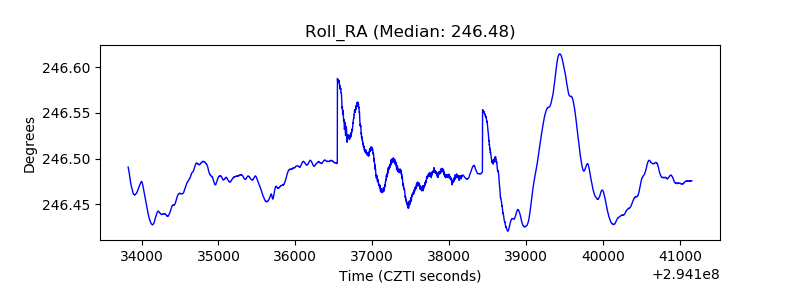 |
| Veto Counter | 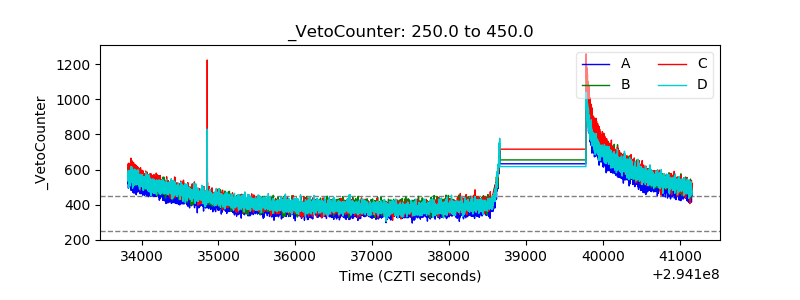 |