| Param | Original file | Final file |
|---|---|---|
| Filename | modeM0/AS1A05_025T17_9000002858_19366cztM0_level2.evt | modeM0/AS1A05_025T17_9000002858_19366cztM0_level2_quad_clean.evt |
| Size (bytes) | 353,537,280 | 77,281,920 |
| Size | 337.2 MB | 73.7 MB |
| Events in quadrant A | 1,791,891 | 544,387 |
| Events in quadrant B | 1,856,710 | 546,506 |
| Events in quadrant C | 1,729,096 | 517,832 |
| Events in quadrant D | 5,086,936 | 479,325 |
| Mode M0 | |||
|---|---|---|---|
| Quadrant | BADHDUFLAG | Total packets | Discarded packets |
| A | 0 | 7496 | 2 |
| B | 0 | 7649 | 2 |
| C | 0 | 7350 | 6 |
| D | 0 | 17620 | 20 |
| Mode SS | |||
|---|---|---|---|
| Quadrant | BADHDUFLAG | Total packets | Discarded packets |
| A | 0 | 72 | 0 |
| B | 0 | 72 | 0 |
| C | 0 | 72 | 0 |
| D | 0 | 72 | 0 |
| Quadrant | Total seconds | Saturated seconds | Saturation percentage |
|---|---|---|---|
| A | 3559 | 2 | 0.056196% |
| B | 3560 | 7 | 0.196629% |
| C | 3558 | 4 | 0.112423% |
| D | 3556 | 488 | 13.723285% |
Noise dominated data is calculated using 1-second bins in cleaned event files. If a bin has >2000 counts, and if more than 50% of those come from <1% of pixels, then it is considered to be noise-dominated and hence unusable.
| Quadrant | # 1 sec bins | Bins with >0 counts | Bins with >2000 counts | High rate bins dominated by noise | Noise dominated (total time) | Noise dominated (detector-on time) | Marked lightcurve |
|---|---|---|---|---|---|---|---|
| A | 3560 | 3560 | 0 | 0 | 0.00% | 0.00% | 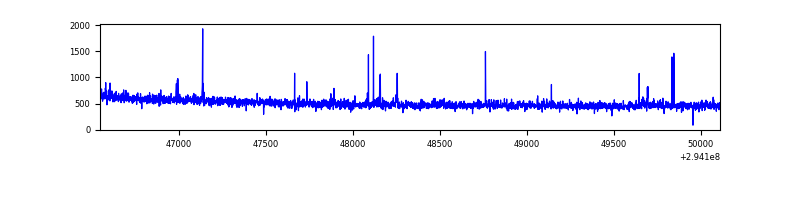 |
| B | 3561 | 3561 | 1 | 1 | 0.03% | 0.03% | 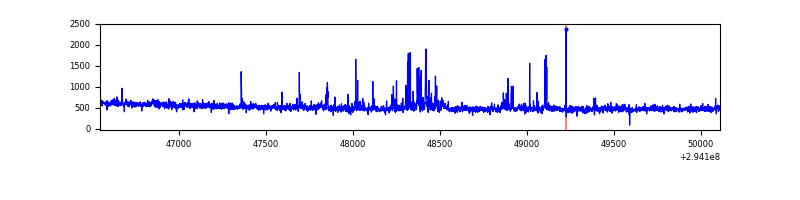 |
| C | 3561 | 3561 | 0 | 0 | 0.00% | 0.00% | 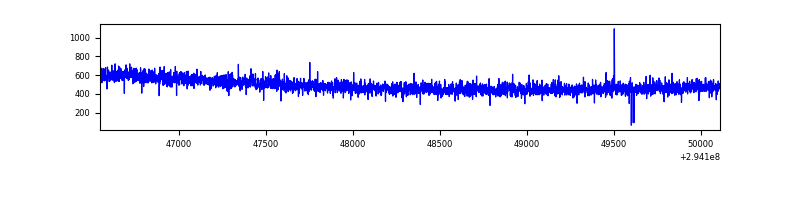 |
| D | 3561 | 3561 | 526 | 526 | 14.77% | 14.77% | 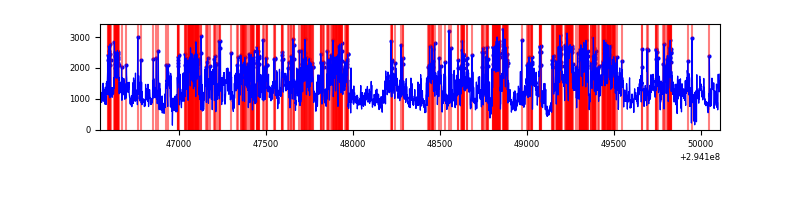 |
Top three noisy pixels from each quadrant. If the there are fewer than three noisy pixels in the level2.evt file, extra rows are filled as -1
| Pixel properties | Quadrant properties | ||||||
|---|---|---|---|---|---|---|---|
| Quadrant | DetID | PixID | Counts | Sigma | Mean | Median | Sigma |
| A | 4 | 2 | 33038 | 355.57 | 455 | 448 | 91.7 |
| A | 3 | 1 | 4988 | 49.53 | 455 | 448 | 91.7 |
| A | 13 | 254 | 4245 | 41.43 | 455 | 448 | 91.7 |
| B | 6 | 36 | 28581 | 338.23 | 449 | 441 | 83.2 |
| B | 15 | 32 | 25948 | 306.58 | 449 | 441 | 83.2 |
| B | 4 | 216 | 20947 | 246.47 | 449 | 441 | 83.2 |
| C | 14 | 238 | 68725 | 709.23 | 423 | 426 | 96.3 |
| C | 3 | 233 | 7690 | 75.43 | 423 | 426 | 96.3 |
| C | 13 | 61 | 3116 | 27.93 | 423 | 426 | 96.3 |
| D | 10 | 66 | 2712636 | 26588.94 | 421 | 409 | 102.0 |
| D | 7 | 238 | 388450 | 3804.11 | 421 | 409 | 102.0 |
| D | 1 | 52 | 99447 | 970.91 | 421 | 409 | 102.0 |
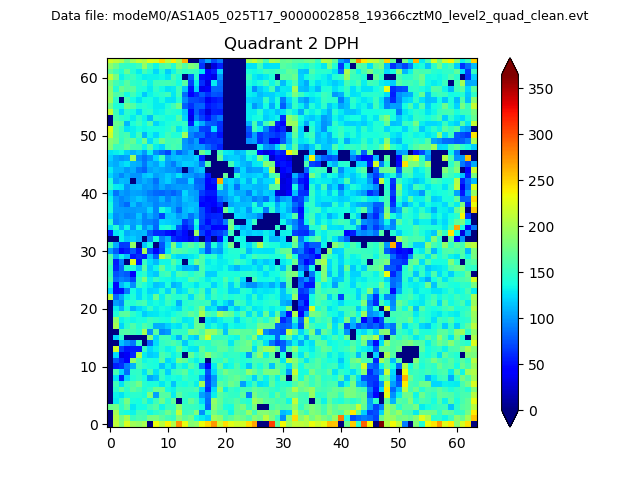
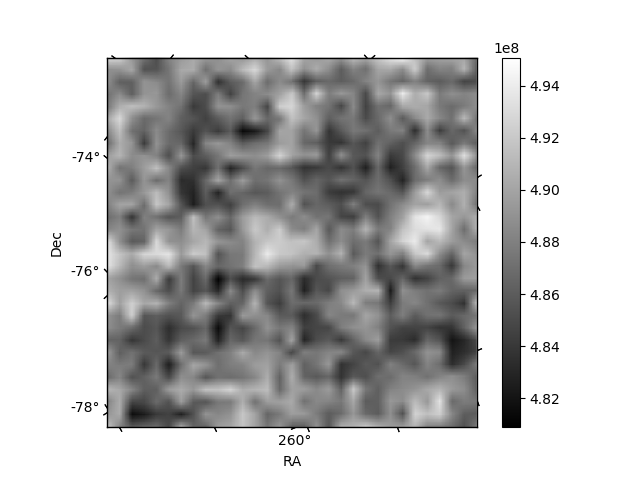
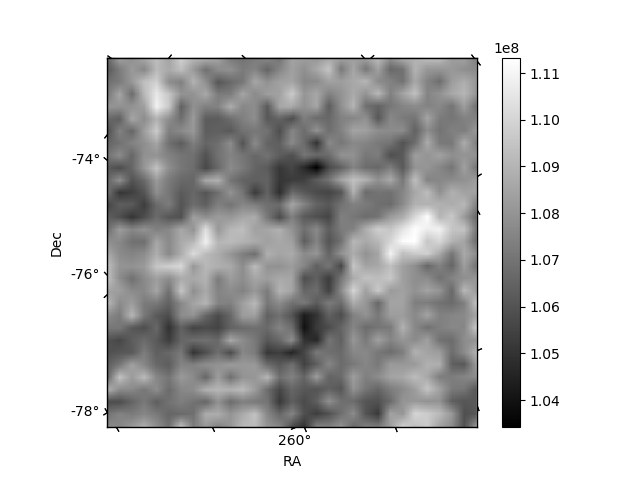
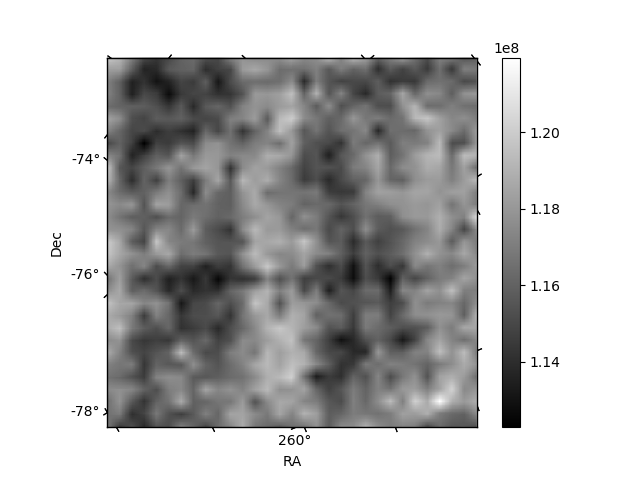
Histogram calculated using DETX and DETY for each event in the final _common_clean file
| Quadrant A | 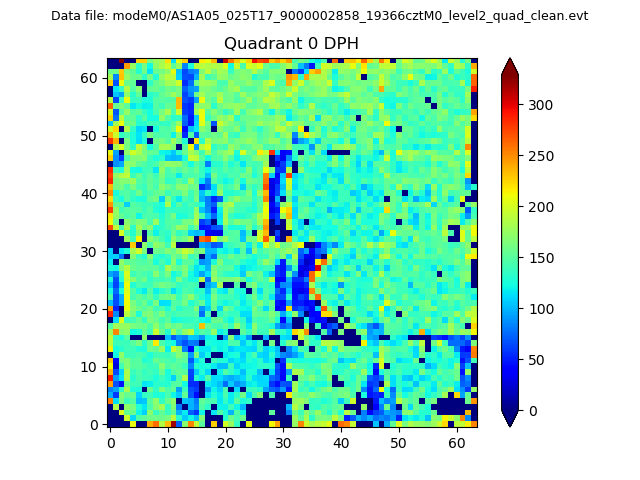 |
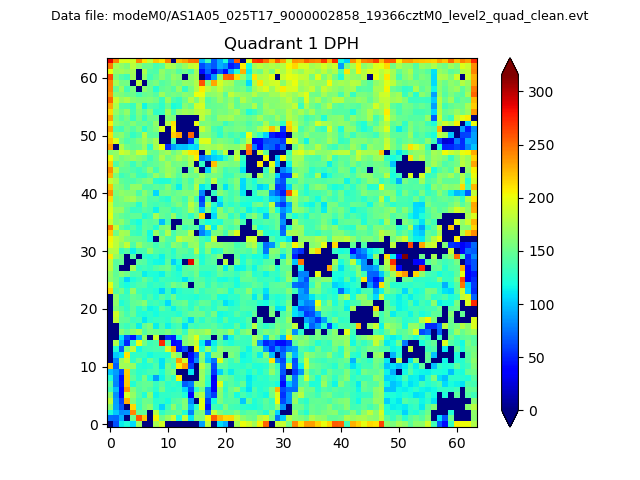 |
Quadrant B |
|---|---|---|---|
| Quadrant D | 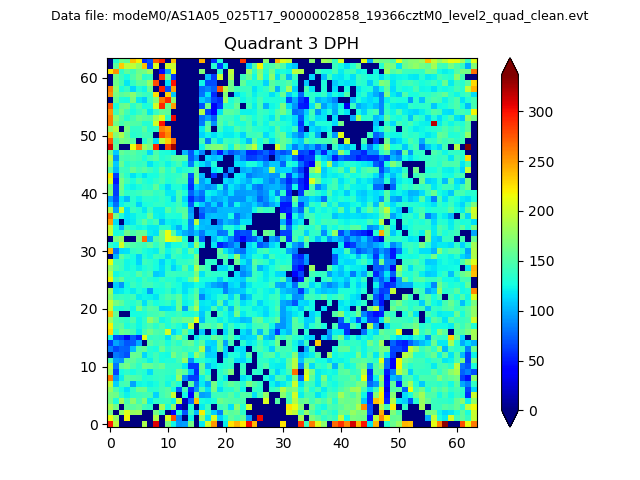 |
 |
Quadrant C |
| Plot type | Count rate plots | Images |
|---|---|---|
| Comparison with Poisson distribution Blue bars denote a histogram of data divided into 1 sec bins. Red curve is a Poisson curve with rate = median count rate of data. |
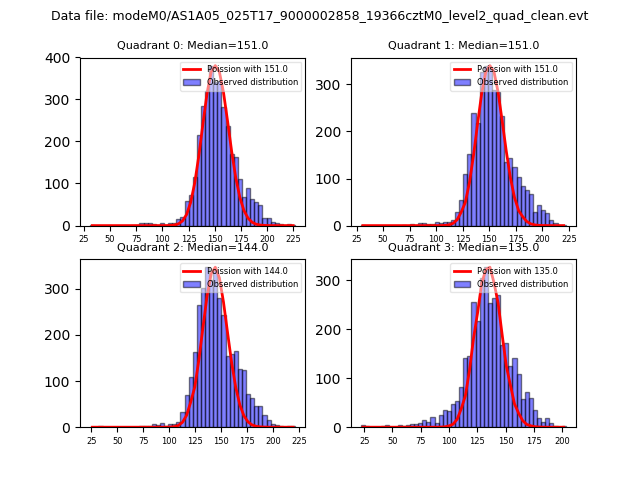 |
 |
| Quadrant-wise count rates Data is divided into 100 sec bins |
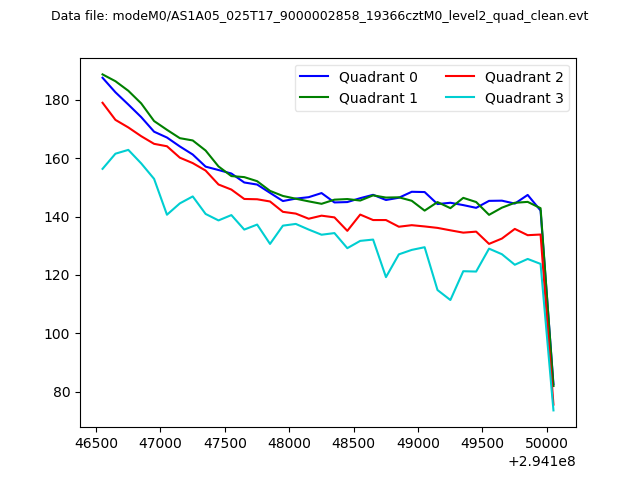 |
|
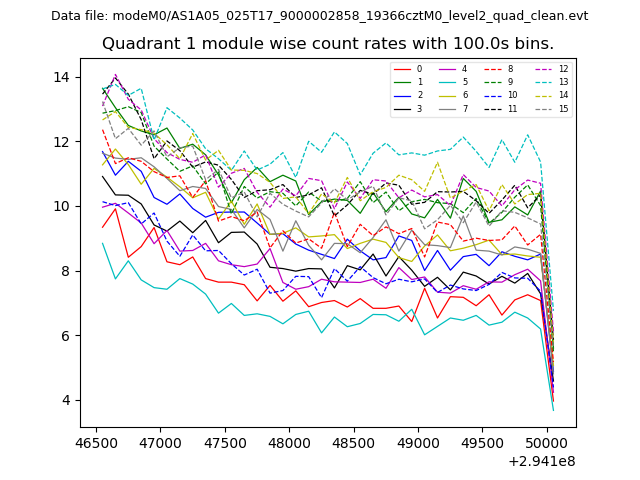
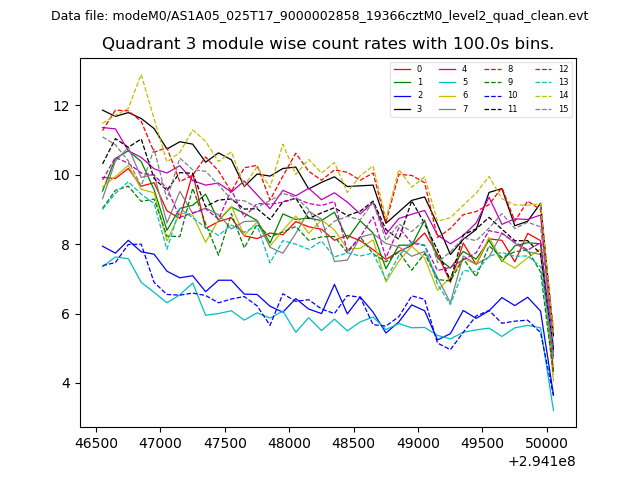
| Module-wise count rates for Quadrant A Data is divided into 100 sec bins |
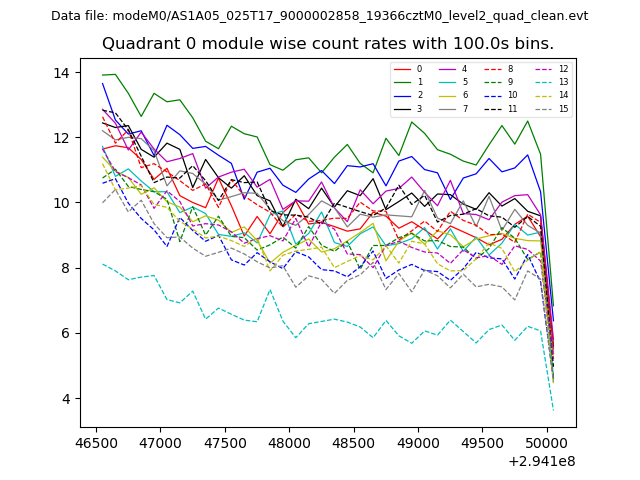 |
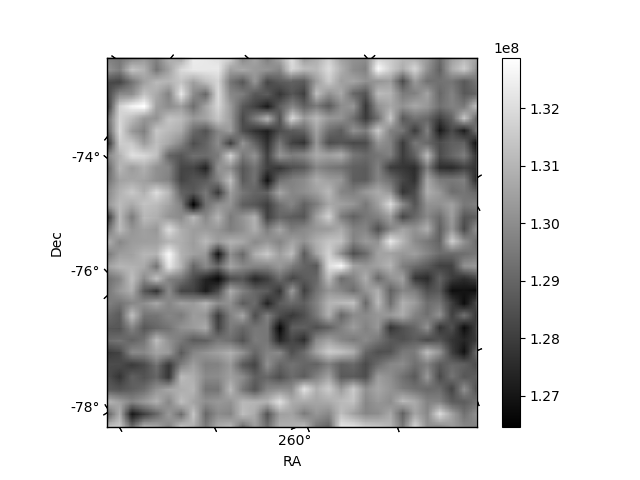 |
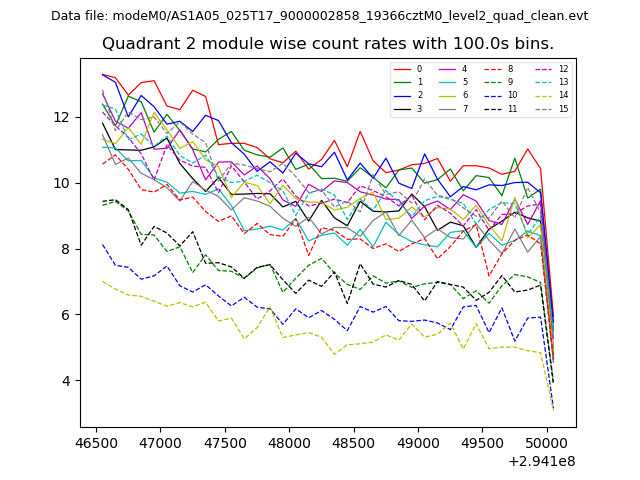
| Module-wise count rates for Quadrant B Data is divided into 100 sec bins |
 |
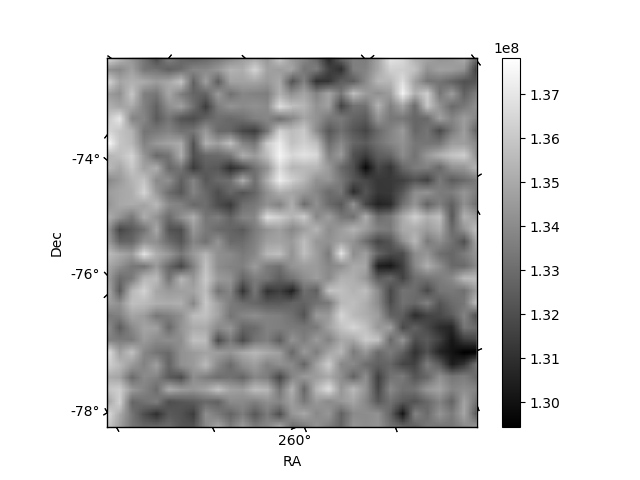 |
| Module-wise count rates for Quadrant C Data is divided into 100 sec bins |
 |
 |
| Module-wise count rates for Quadrant D Data is divided into 100 sec bins |
 |
 |
| Parameter | Plot |
|---|---|
| CZT HV Monitor | 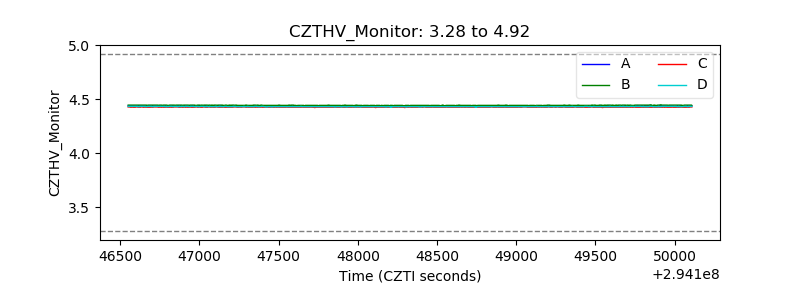 |
| D_VDD | 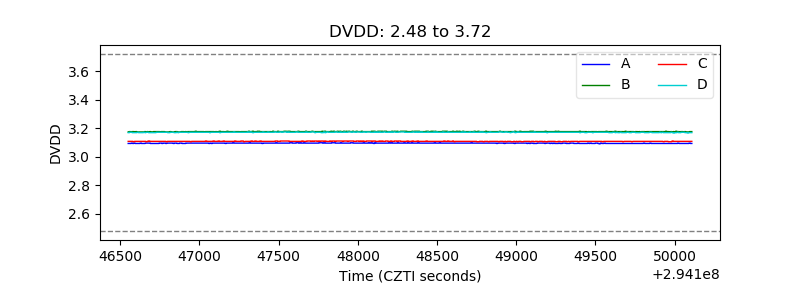 |
| Temperature 1 | 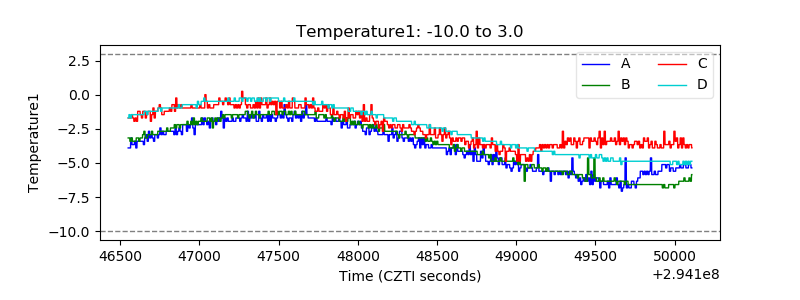 |
| Veto HV Monitor | 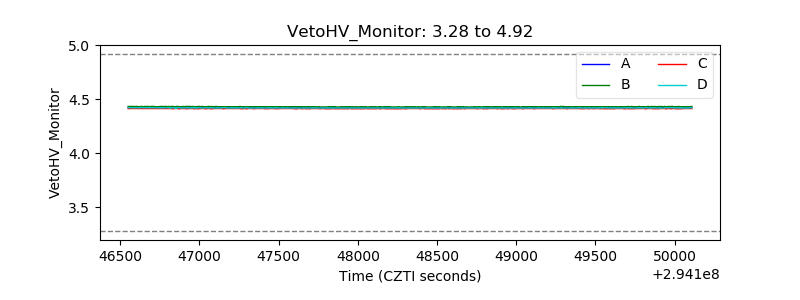 |
| Veto LLD | 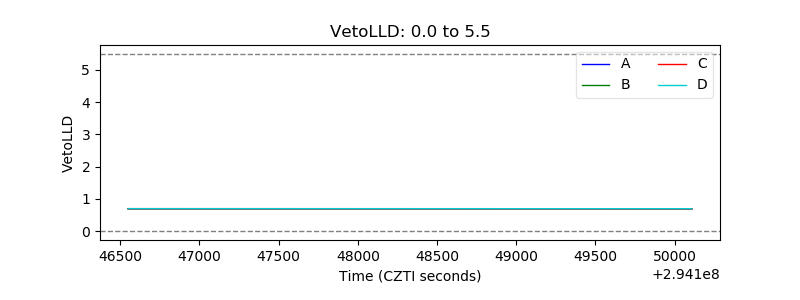 |
| Alpha Counter | 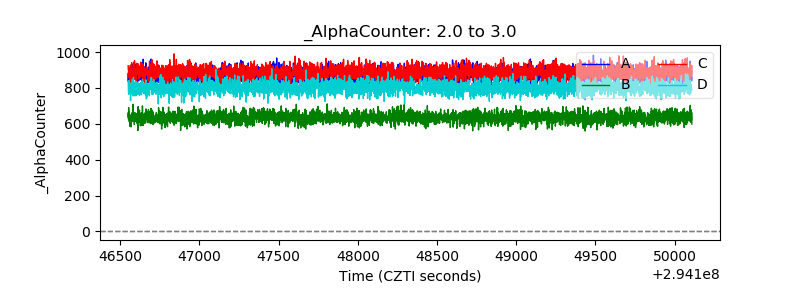 |
| _CPM_Rate | 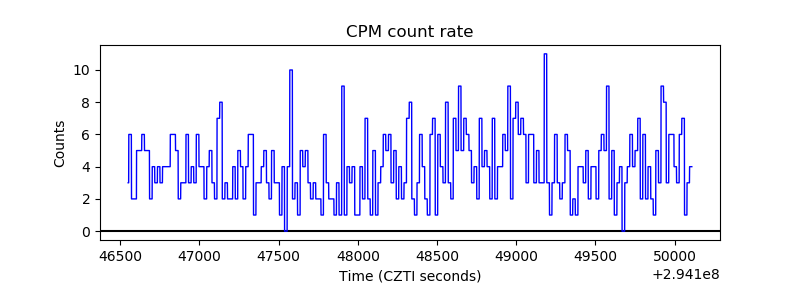 |
| CZT Counter | 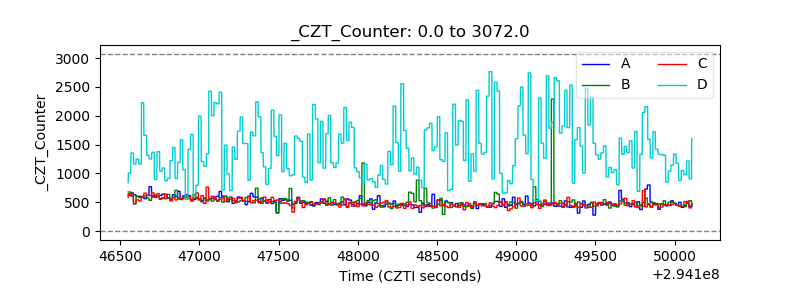 |
| +2.5 Volts monitor |  |
| +5 Volts monitor |  |
| _ROLL_ROT | 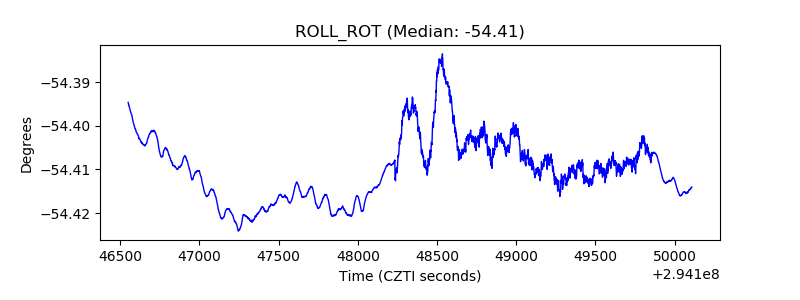 |
| _Roll_DEC | 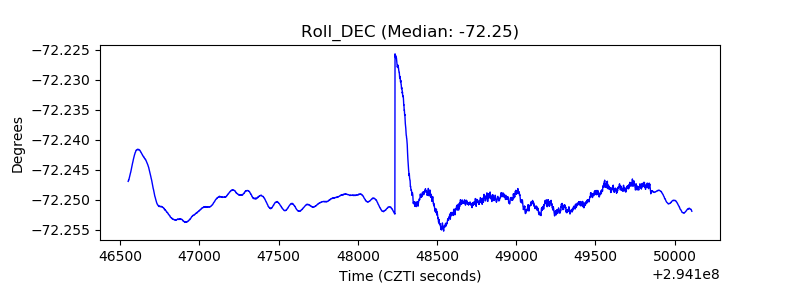 |
| _Roll_RA | 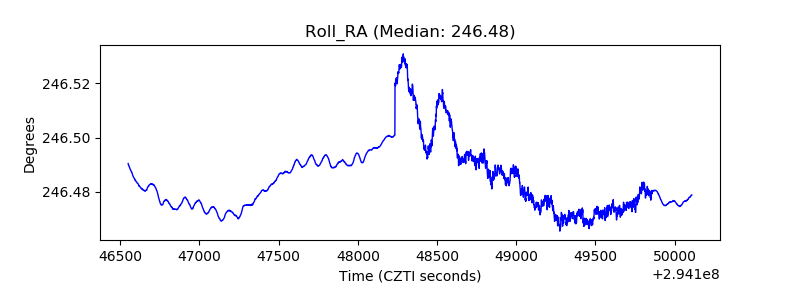 |
| Veto Counter | 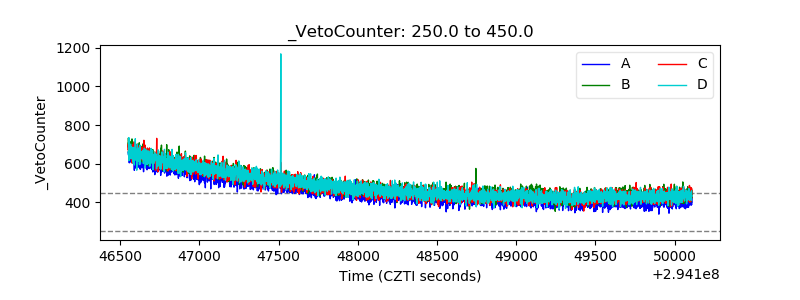 |