| Param | Original file | Final file |
|---|---|---|
| Filename | modeM0/AS1A05_104T05_9000002860cztM0_level2.fits | modeM0/AS1A05_104T05_9000002860cztM0_level2_quad_clean.evt |
| Size (bytes) | 137,174,400 | 56,139,840 |
| Size | 130.8 MB | 53.5 MB |
| Events in quadrant A | 889,896 | 221,721 |
| Events in quadrant B | 859,334 | 223,161 |
| Events in quadrant C | 882,288 | 218,178 |
| Events in quadrant D | 669,186 | 182,627 |
| Mode SS | |||
|---|---|---|---|
| Quadrant | BADHDUFLAG | Total packets | Discarded packets |
| A | 0 | 254 | 0 |
| B | 0 | 254 | 0 |
| C | 0 | 252 | 0 |
| D | 0 | 252 | 0 |
| Mode M0 | |||
|---|---|---|---|
| Quadrant | BADHDUFLAG | Total packets | Discarded packets |
| A | 0 | 27231 | 0 |
| B | 0 | 27188 | 0 |
| C | 0 | 27333 | 0 |
| D | 0 | 64664 | 0 |
| Mode M9 | |||
|---|---|---|---|
| Quadrant | BADHDUFLAG | Total packets | Discarded packets |
| A | 0 | 36 | 0 |
| B | 0 | 36 | 0 |
| C | 0 | 36 | 0 |
| D | 0 | 36 | 0 |
| Quadrant | Total seconds | Saturated seconds | Saturation percentage |
|---|---|---|---|
| A | 12342 | 173 | 1.401718% |
| B | 12336 | 195 | 1.580739% |
| C | 12339 | 222 | 1.799173% |
| D | 12303 | 3512 | 28.545883% |
Noise dominated data is calculated using 1-second bins in cleaned event files. If a bin has >2000 counts, and if more than 50% of those come from <1% of pixels, then it is considered to be noise-dominated and hence unusable.
| Quadrant | # 1 sec bins | Bins with >0 counts | Bins with >2000 counts | High rate bins dominated by noise | Noise dominated (total time) | Noise dominated (detector-on time) | Marked lightcurve |
|---|---|---|---|---|---|---|---|
| A | 15079 | 12363 | 0 | 0 | 0.00% | 0.00% |  |
| B | 15079 | 12355 | 0 | 0 | 0.00% | 0.00% |  |
| C | 15079 | 12361 | 0 | 0 | 0.00% | 0.00% |  |
| D | 15079 | 12300 | 0 | 0 | 0.00% | 0.00% |  |
Top three noisy pixels from each quadrant. If the there are fewer than three noisy pixels in the level2.evt file, extra rows are filled as -1
| Pixel properties | Quadrant properties | ||||||
|---|---|---|---|---|---|---|---|
| Quadrant | DetID | PixID | Counts | Sigma | Mean | Median | Sigma |
| A | 0 | 29 | 800 | 10.14 | 231 | 219 | 57.3 |
| A | 7 | 110 | 719 | 8.72 | 231 | 219 | 57.3 |
| A | 0 | 30 | 638 | 7.31 | 231 | 219 | 57.3 |
| B | 2 | 9 | 682 | 10.0 | 226 | 217 | 46.5 |
| B | 2 | 8 | 578 | 7.76 | 226 | 217 | 46.5 |
| B | 5 | 255 | 564 | 7.46 | 226 | 217 | 46.5 |
| C | 3 | 202 | 670 | 7.41 | 232 | 220 | 60.7 |
| C | 1 | 80 | 641 | 6.93 | 232 | 220 | 60.7 |
| C | 1 | 81 | 631 | 6.77 | 232 | 220 | 60.7 |
| D | 3 | 14 | 497 | 6.23 | 190 | 175 | 51.7 |
| D | 7 | 3 | 490 | 6.1 | 190 | 175 | 51.7 |
| D | 6 | 231 | 487 | 6.04 | 190 | 175 | 51.7 |
Histogram calculated using DETX and DETY for each event in the final _common_clean file
| Quadrant A |  |
 |
Quadrant B |
|---|---|---|---|
| Quadrant D |  |
 |
Quadrant C |
| Plot type | Count rate plots | Images |
|---|---|---|
| Comparison with Poisson distribution Blue bars denote a histogram of data divided into 1 sec bins. Red curve is a Poisson curve with rate = median count rate of data. |
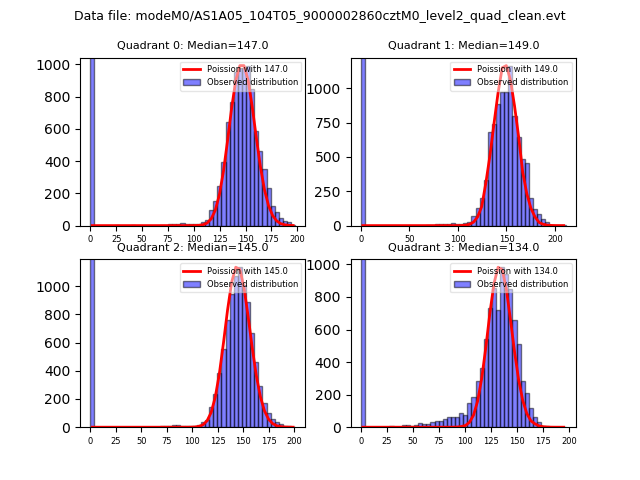 |
 |
| Quadrant-wise count rates Data is divided into 100 sec bins |
 |
|
| Module-wise count rates for Quadrant A Data is divided into 100 sec bins |
 |
 |
| Module-wise count rates for Quadrant B Data is divided into 100 sec bins |
 |
 |
| Module-wise count rates for Quadrant C Data is divided into 100 sec bins |
 |
 |
| Module-wise count rates for Quadrant D Data is divided into 100 sec bins |
 |
 |
| Parameter | Plot |
|---|---|
| CZT HV Monitor | 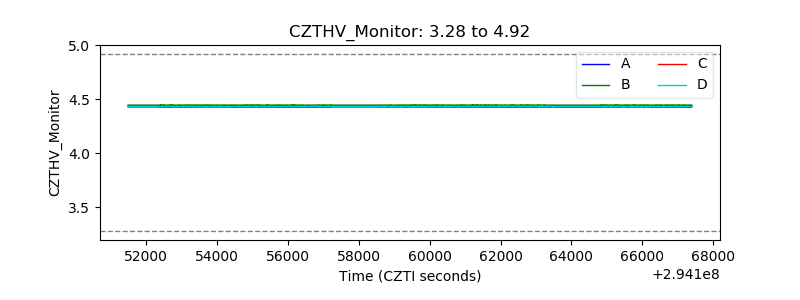 |
| D_VDD |  |
| Temperature 1 |  |
| Veto HV Monitor |  |
| Veto LLD | 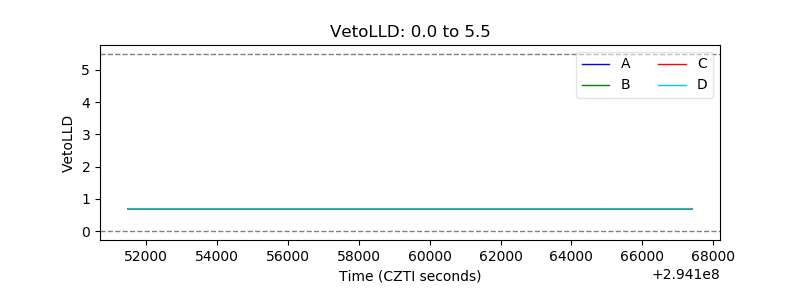 |
| Alpha Counter |  |
| _CPM_Rate |  |
| CZT Counter |  |
| +2.5 Volts monitor |  |
| +5 Volts monitor |  |
| _ROLL_ROT |  |
| _Roll_DEC |  |
| _Roll_RA | 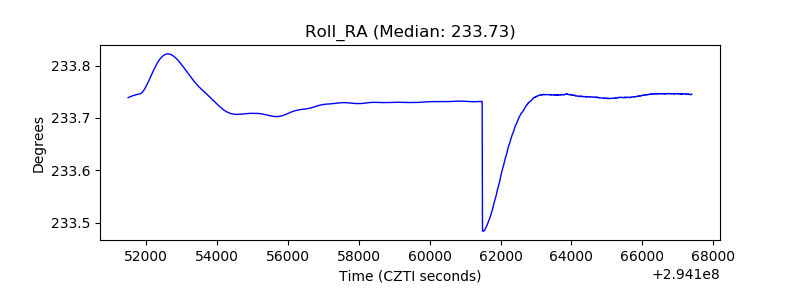 |
| Veto Counter |  |