| Param | Original file | Final file |
|---|---|---|
| Filename | modeM0/AS1A05_104T05_9000002860_19369cztM0_level2.evt | modeM0/AS1A05_104T05_9000002860_19369cztM0_level2_quad_clean.evt |
| Size (bytes) | 257,109,120 | 42,825,600 |
| Size | 245.2 MB | 40.8 MB |
| Events in quadrant A | 1,215,366 | 288,226 |
| Events in quadrant B | 1,241,137 | 293,926 |
| Events in quadrant C | 1,275,513 | 283,946 |
| Events in quadrant D | 3,884,998 | 252,529 |
| Mode SS | |||
|---|---|---|---|
| Quadrant | BADHDUFLAG | Total packets | Discarded packets |
| A | 0 | 50 | 0 |
| B | 0 | 50 | 0 |
| C | 0 | 50 | 0 |
| D | 0 | 50 | 0 |
| Mode M0 | |||
|---|---|---|---|
| Quadrant | BADHDUFLAG | Total packets | Discarded packets |
| A | 0 | 5121 | 0 |
| B | 0 | 5168 | 0 |
| C | 0 | 5219 | 0 |
| D | 0 | 13263 | 0 |
| Quadrant | Total seconds | Saturated seconds | Saturation percentage |
|---|---|---|---|
| A | 2471 | 2 | 0.080939% |
| B | 2472 | 4 | 0.161812% |
| C | 2472 | 13 | 0.525890% |
| D | 2472 | 518 | 20.954693% |
Noise dominated data is calculated using 1-second bins in cleaned event files. If a bin has >2000 counts, and if more than 50% of those come from <1% of pixels, then it is considered to be noise-dominated and hence unusable.
| Quadrant | # 1 sec bins | Bins with >0 counts | Bins with >2000 counts | High rate bins dominated by noise | Noise dominated (total time) | Noise dominated (detector-on time) | Marked lightcurve |
|---|---|---|---|---|---|---|---|
| A | 2471 | 2471 | 0 | 0 | 0.00% | 0.00% | 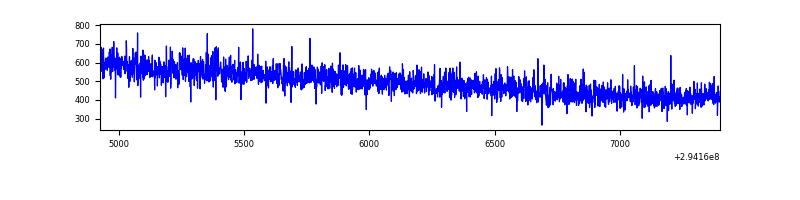 |
| B | 2472 | 2472 | 0 | 0 | 0.00% | 0.00% | 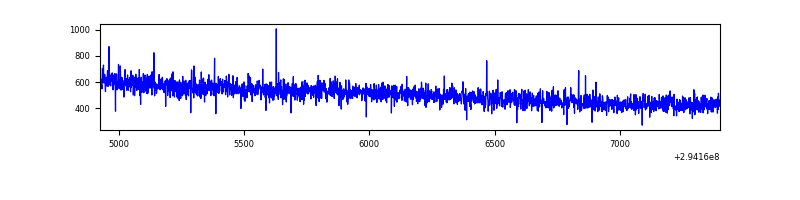 |
| C | 2472 | 2472 | 0 | 0 | 0.00% | 0.00% | 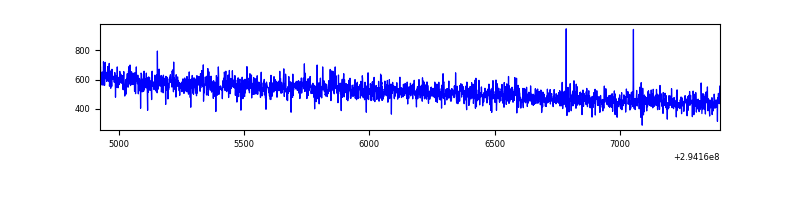 |
| D | 2472 | 2472 | 374 | 374 | 15.13% | 15.13% | 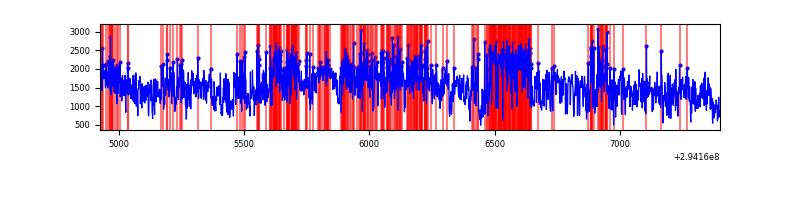 |
Top three noisy pixels from each quadrant. If the there are fewer than three noisy pixels in the level2.evt file, extra rows are filled as -1
| Pixel properties | Quadrant properties | ||||||
|---|---|---|---|---|---|---|---|
| Quadrant | DetID | PixID | Counts | Sigma | Mean | Median | Sigma |
| A | 0 | 226 | 2664 | 36.67 | 314 | 309 | 64.2 |
| A | 13 | 254 | 2523 | 34.47 | 314 | 309 | 64.2 |
| A | 4 | 2 | 2467 | 33.6 | 314 | 309 | 64.2 |
| B | 12 | 111 | 7029 | 109.55 | 316 | 307 | 61.4 |
| B | 11 | 111 | 6211 | 96.22 | 316 | 307 | 61.4 |
| B | 14 | 111 | 5644 | 86.98 | 316 | 307 | 61.4 |
| C | 14 | 238 | 48533 | 650.0 | 313 | 315 | 74.2 |
| C | 3 | 233 | 5705 | 72.66 | 313 | 315 | 74.2 |
| C | 13 | 61 | 2142 | 24.63 | 313 | 315 | 74.2 |
| D | 10 | 66 | 2468760 | 33375.16 | 299 | 290 | 74.0 |
| D | 1 | 52 | 142927 | 1928.54 | 299 | 290 | 74.0 |
| D | 11 | 176 | 102682 | 1384.4 | 299 | 290 | 74.0 |
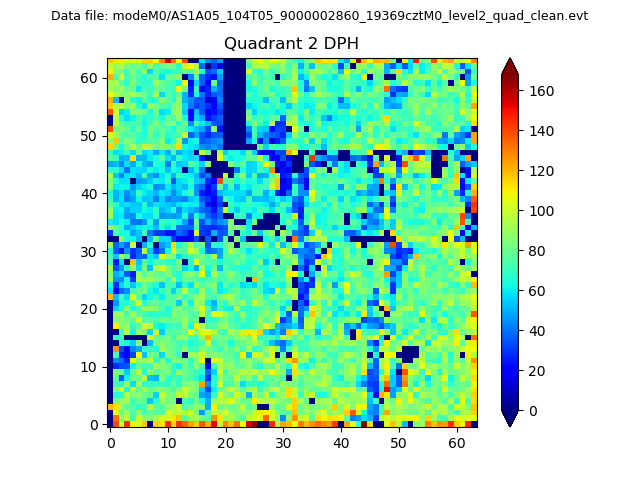
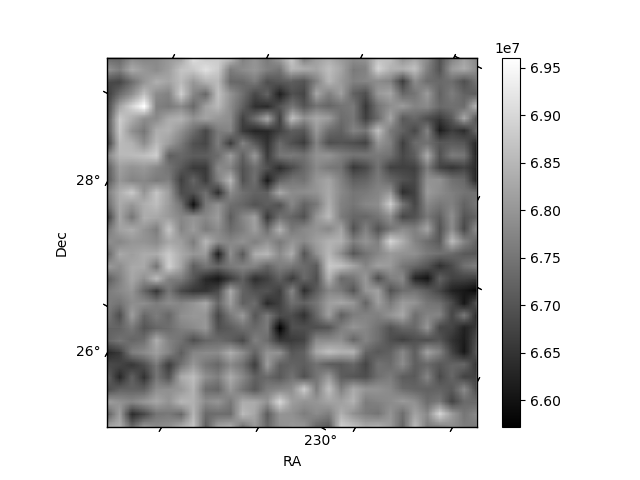
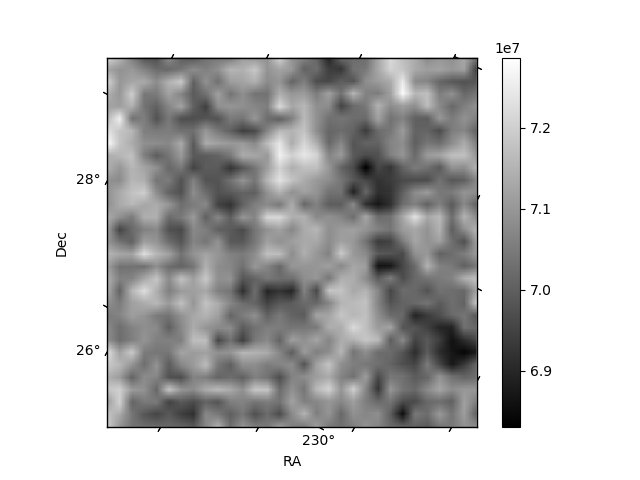
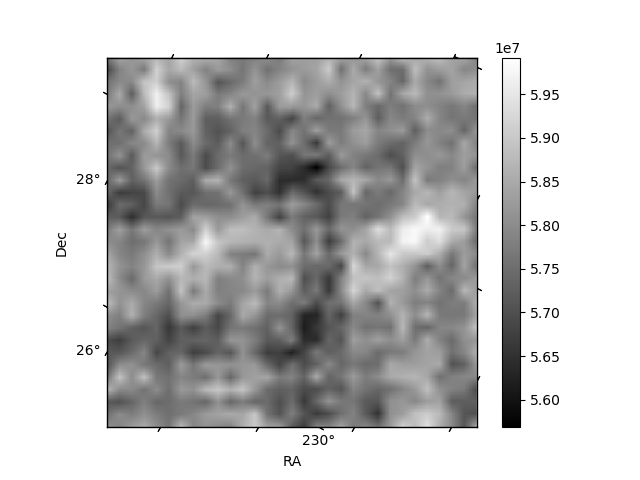
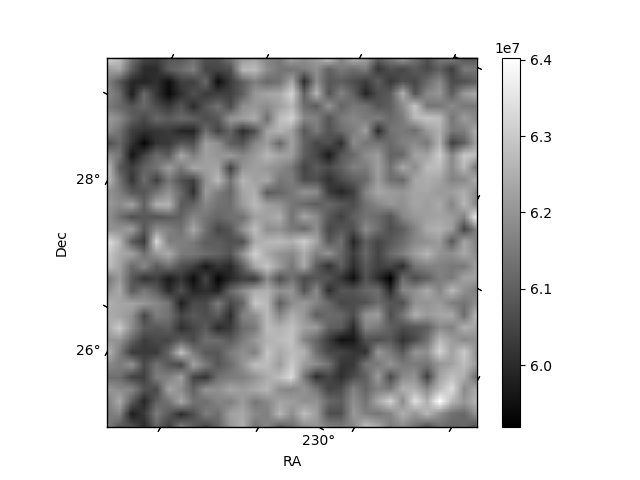
Histogram calculated using DETX and DETY for each event in the final _common_clean file
| Quadrant A | 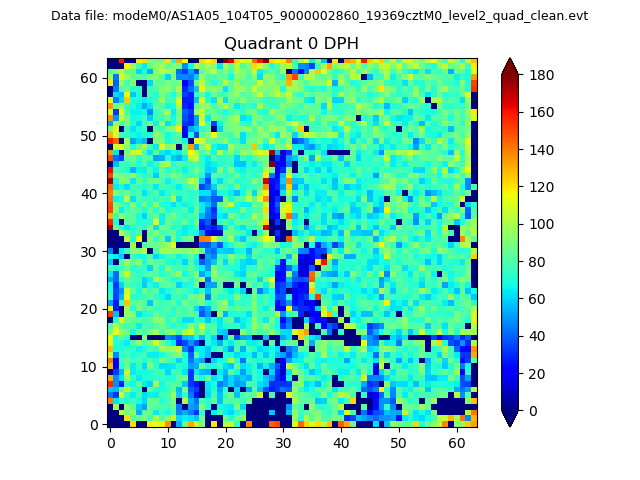 |
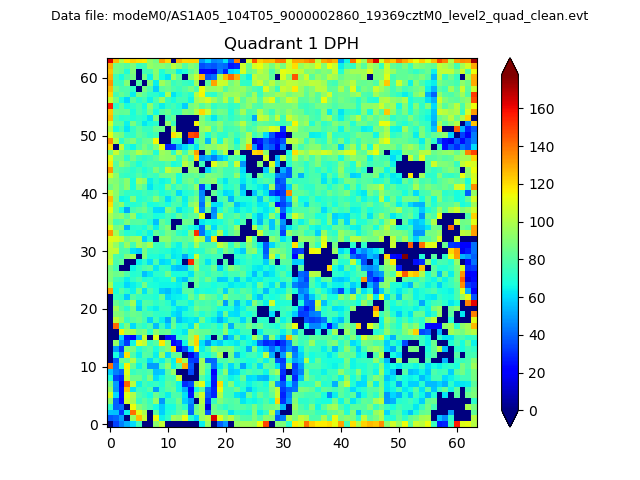 |
Quadrant B |
|---|---|---|---|
| Quadrant D | 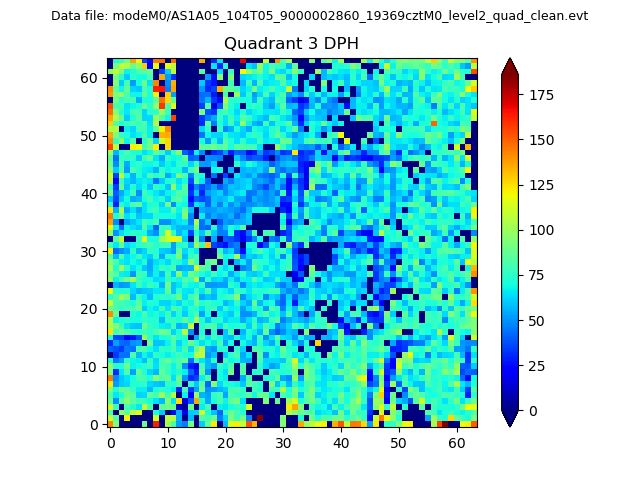 |
 |
Quadrant C |
| Plot type | Count rate plots | Images |
|---|---|---|
| Comparison with Poisson distribution Blue bars denote a histogram of data divided into 1 sec bins. Red curve is a Poisson curve with rate = median count rate of data. |
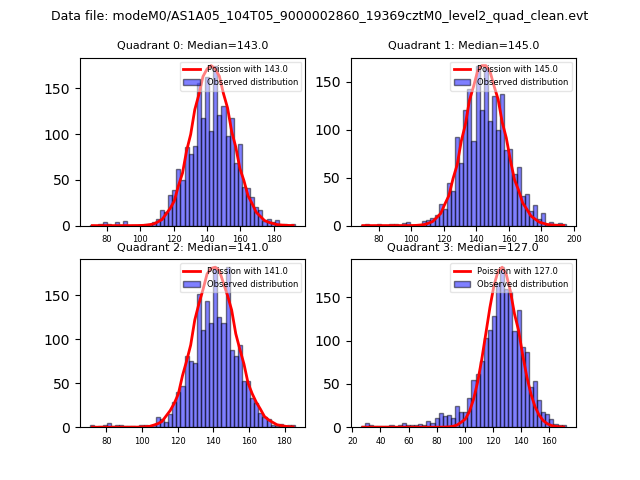 |
 |
| Quadrant-wise count rates Data is divided into 100 sec bins |
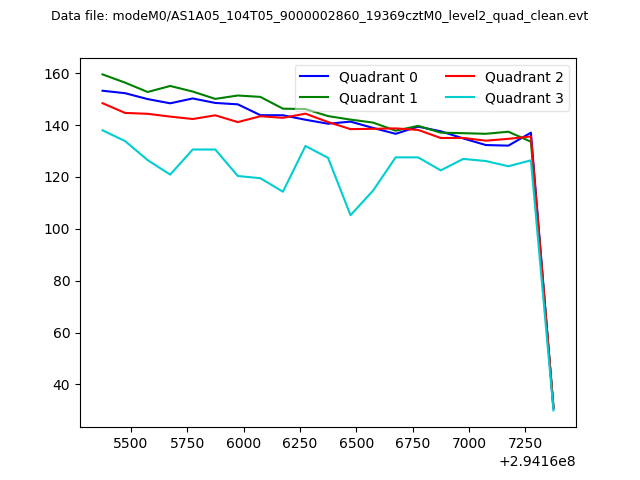 |
|
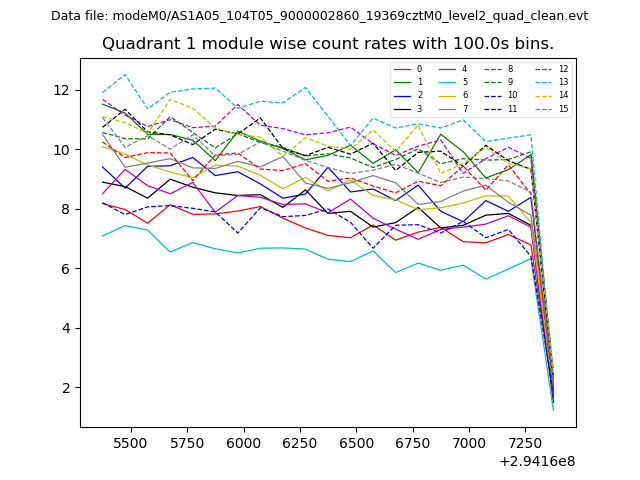
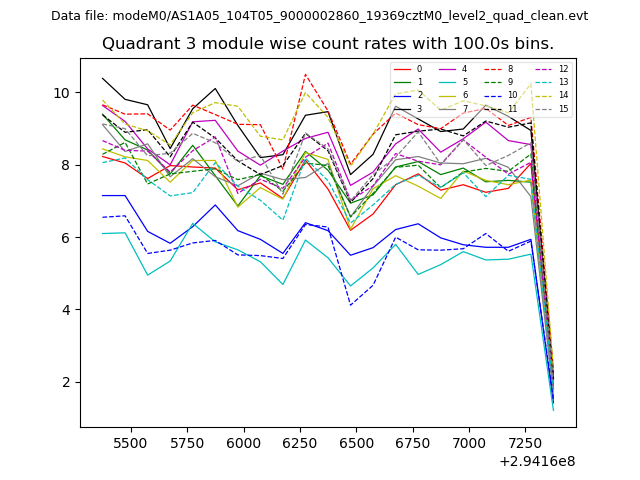
| Module-wise count rates for Quadrant A Data is divided into 100 sec bins |
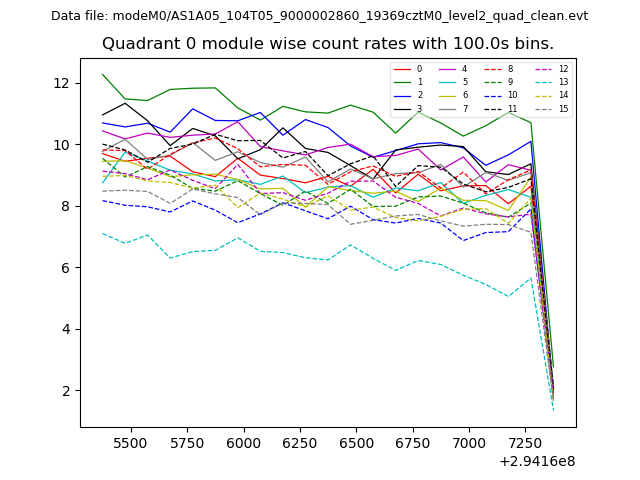 |
 |
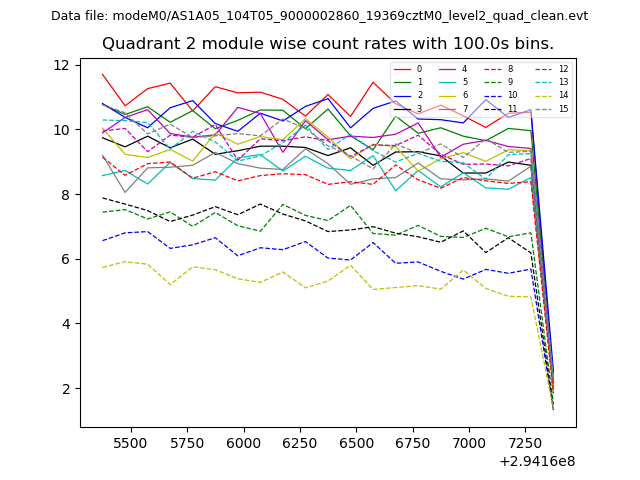
| Module-wise count rates for Quadrant B Data is divided into 100 sec bins |
 |
 |
| Module-wise count rates for Quadrant C Data is divided into 100 sec bins |
 |
 |
| Module-wise count rates for Quadrant D Data is divided into 100 sec bins |
 |
 |
| Parameter | Plot |
|---|---|
| CZT HV Monitor | 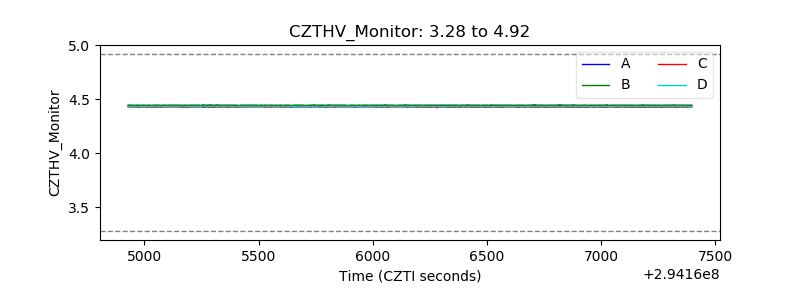 |
| D_VDD | 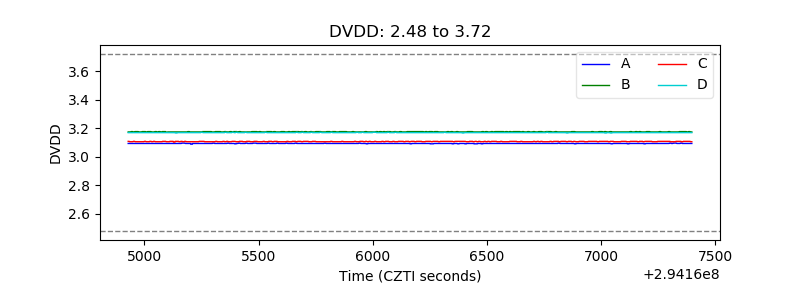 |
| Temperature 1 | 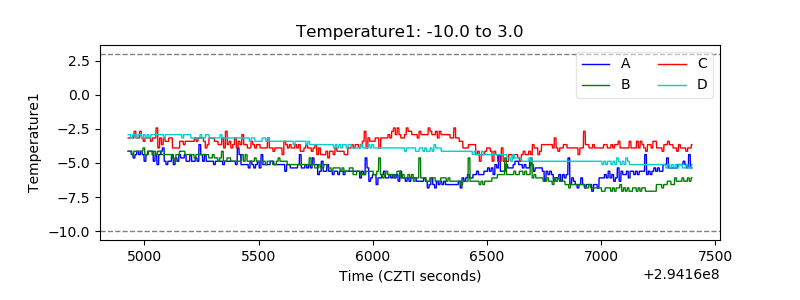 |
| Veto HV Monitor | 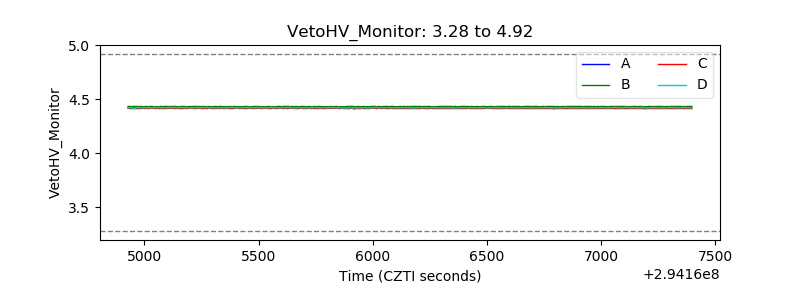 |
| Veto LLD | 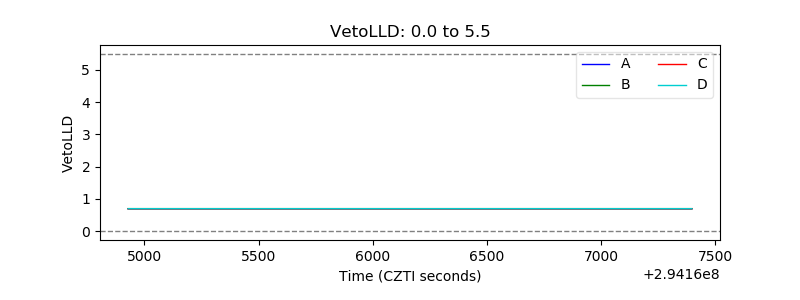 |
| Alpha Counter |  |
| _CPM_Rate | 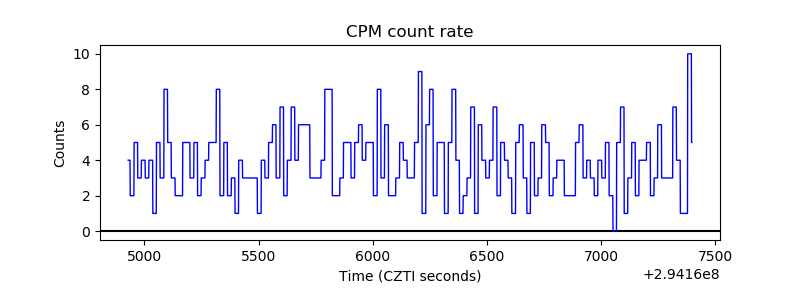 |
| CZT Counter | 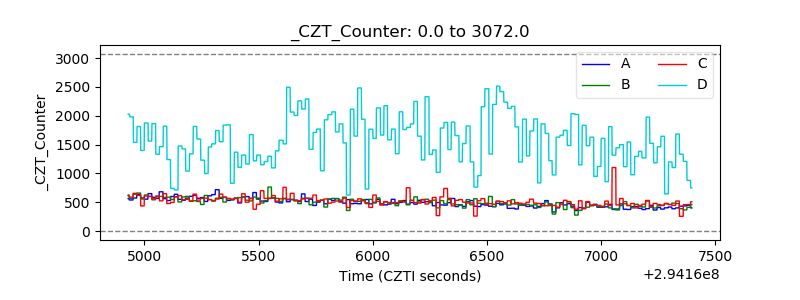 |
| +2.5 Volts monitor | 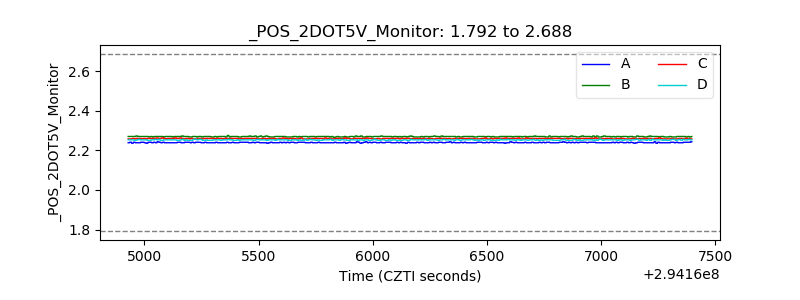 |
| +5 Volts monitor | 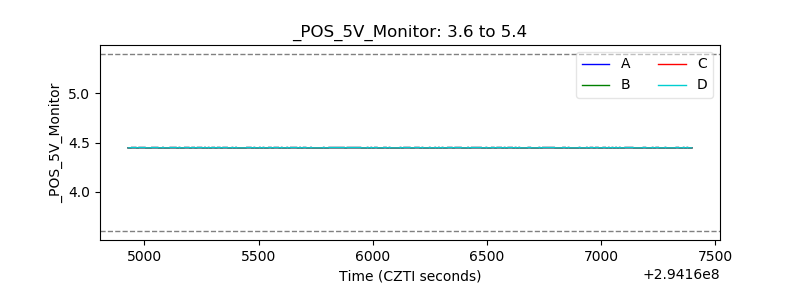 |
| _ROLL_ROT | 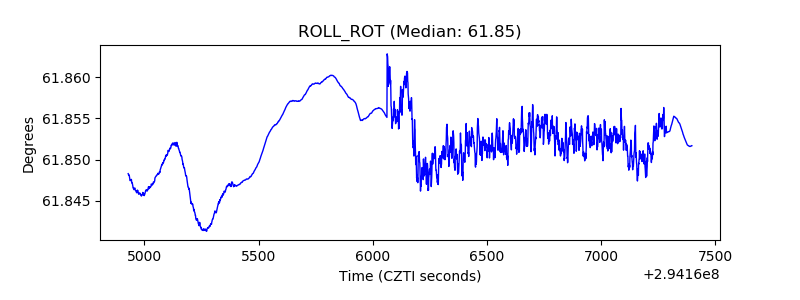 |
| _Roll_DEC |  |
| _Roll_RA | 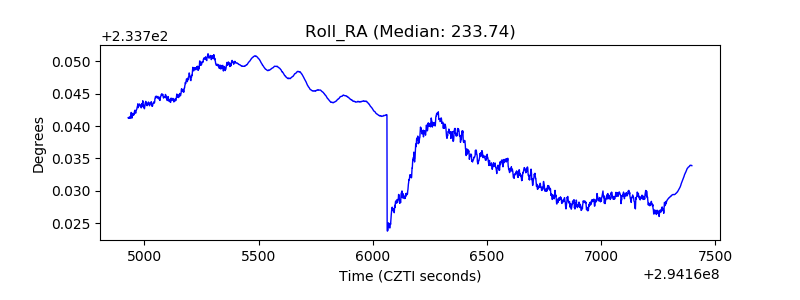 |
| Veto Counter |  |