| Param | Original file | Final file |
|---|---|---|
| Filename | modeM0/AS1A05_226T06_9000002864cztM0_level2.fits | modeM0/AS1A05_226T06_9000002864cztM0_level2_quad_clean.evt |
| Size (bytes) | 360,774,720 | 357,865,920 |
| Size | 344.1 MB | 341.3 MB |
| Events in quadrant A | 2,247,778 | 2,336,734 |
| Events in quadrant B | 2,154,648 | 2,330,499 |
| Events in quadrant C | 2,183,614 | 2,193,502 |
| Events in quadrant D | 1,649,470 | 1,291,017 |
| Mode M0 | |||
|---|---|---|---|
| Quadrant | BADHDUFLAG | Total packets | Discarded packets |
| A | 0 | 80147 | 0 |
| B | 0 | 82967 | 0 |
| C | 0 | 81126 | 0 |
| D | 0 | 196311 | 0 |
| Mode M9 | |||
|---|---|---|---|
| Quadrant | BADHDUFLAG | Total packets | Discarded packets |
| A | 0 | 40 | 0 |
| B | 0 | 40 | 0 |
| C | 0 | 40 | 0 |
| D | 0 | 40 | 0 |
| Mode SS | |||
|---|---|---|---|
| Quadrant | BADHDUFLAG | Total packets | Discarded packets |
| A | 0 | 796 | 0 |
| B | 0 | 796 | 0 |
| C | 0 | 796 | 0 |
| D | 0 | 796 | 0 |
| Quadrant | Total seconds | Saturated seconds | Saturation percentage |
|---|---|---|---|
| A | 39104 | 239 | 0.611191% |
| B | 39104 | 435 | 1.112418% |
| C | 39104 | 414 | 1.058715% |
| D | 39104 | 11996 | 30.677169% |
Noise dominated data is calculated using 1-second bins in cleaned event files. If a bin has >2000 counts, and if more than 50% of those come from <1% of pixels, then it is considered to be noise-dominated and hence unusable.
| Quadrant | # 1 sec bins | Bins with >0 counts | Bins with >2000 counts | High rate bins dominated by noise | Noise dominated (total time) | Noise dominated (detector-on time) | Marked lightcurve |
|---|---|---|---|---|---|---|---|
| A | 43044 | 39101 | 0 | 0 | 0.00% | 0.00% |  |
| B | 43044 | 39100 | 0 | 0 | 0.00% | 0.00% |  |
| C | 43044 | 39101 | 0 | 0 | 0.00% | 0.00% |  |
| D | 43043 | 39050 | 0 | 0 | 0.00% | 0.00% |  |
Top three noisy pixels from each quadrant. If the there are fewer than three noisy pixels in the level2.evt file, extra rows are filled as -1
| Pixel properties | Quadrant properties | ||||||
|---|---|---|---|---|---|---|---|
| Quadrant | DetID | PixID | Counts | Sigma | Mean | Median | Sigma |
| A | 0 | 29 | 2114 | 10.82 | 585 | 549 | 144.7 |
| A | 7 | 110 | 1808 | 8.7 | 585 | 549 | 144.7 |
| A | 15 | 236 | 1727 | 8.14 | 585 | 549 | 144.7 |
| B | 2 | 9 | 1689 | 10.13 | 568 | 541 | 113.3 |
| B | 3 | 17 | 1498 | 8.45 | 568 | 541 | 113.3 |
| B | 2 | 8 | 1454 | 8.06 | 568 | 541 | 113.3 |
| C | 12 | 241 | 1595 | 7.09 | 577 | 535 | 149.4 |
| C | 3 | 126 | 1516 | 6.57 | 577 | 535 | 149.4 |
| C | 9 | 209 | 1471 | 6.26 | 577 | 535 | 149.4 |
| D | 10 | 190 | 1193 | 5.97 | 471 | 429 | 127.9 |
| D | 3 | 14 | 1185 | 5.91 | 471 | 429 | 127.9 |
| D | 6 | 67 | 1172 | 5.81 | 471 | 429 | 127.9 |
Histogram calculated using DETX and DETY for each event in the final _common_clean file
| Quadrant A |  |
 |
Quadrant B |
|---|---|---|---|
| Quadrant D |  |
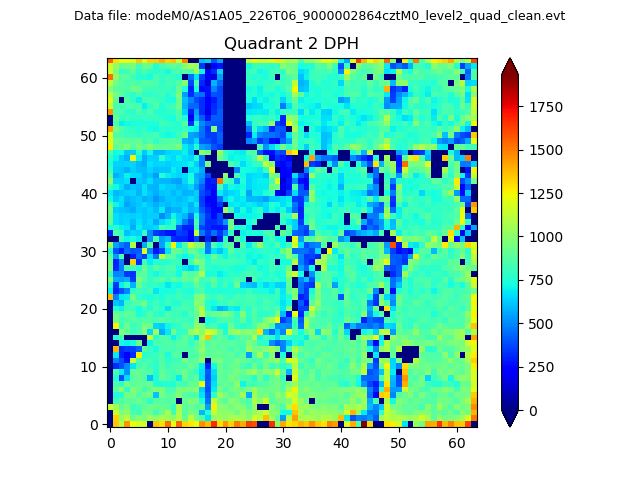 |
Quadrant C |
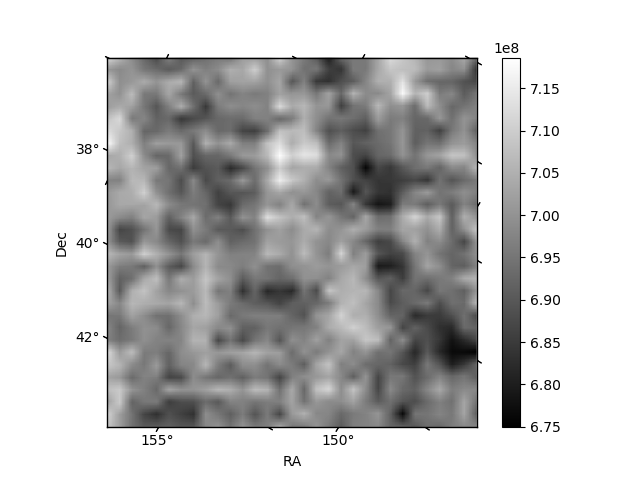
| Plot type | Count rate plots | Images |
|---|---|---|
| Comparison with Poisson distribution Blue bars denote a histogram of data divided into 1 sec bins. Red curve is a Poisson curve with rate = median count rate of data. |
 |
 |
| Quadrant-wise count rates Data is divided into 100 sec bins |
 |
|
| Module-wise count rates for Quadrant A Data is divided into 100 sec bins |
 |
 |
| Module-wise count rates for Quadrant B Data is divided into 100 sec bins |
 |
 |
| Module-wise count rates for Quadrant C Data is divided into 100 sec bins |
 |
 |
| Module-wise count rates for Quadrant D Data is divided into 100 sec bins |
 |
 |
| Parameter | Plot |
|---|---|
| CZT HV Monitor |  |
| D_VDD | 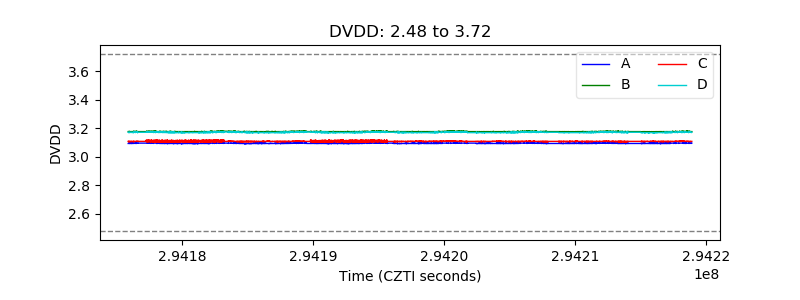 |
| Temperature 1 | 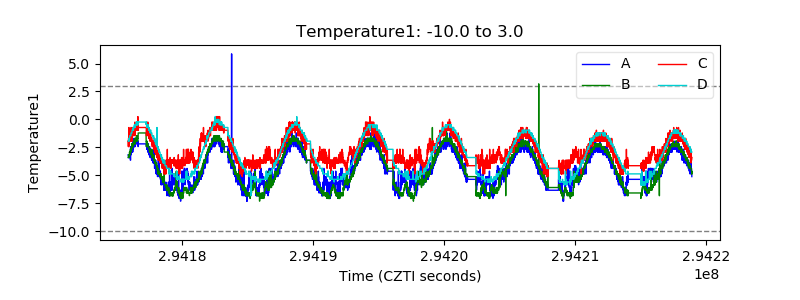 |
| Veto HV Monitor |  |
| Veto LLD | 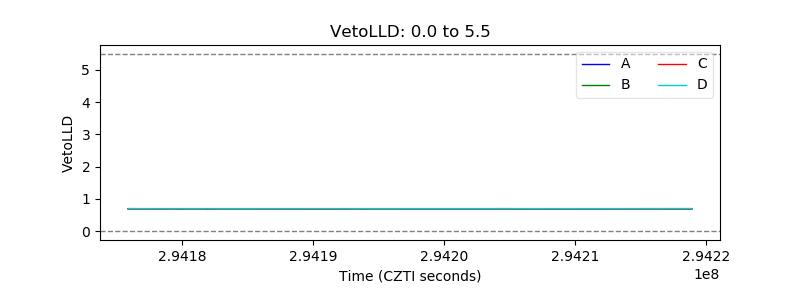 |
| Alpha Counter |  |
| _CPM_Rate |  |
| CZT Counter |  |
| +2.5 Volts monitor |  |
| +5 Volts monitor | 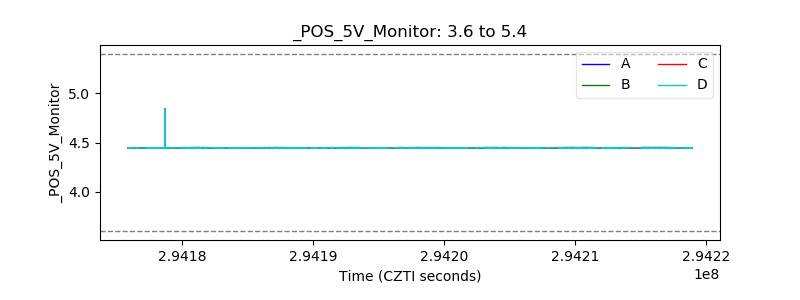 |
| _ROLL_ROT |  |
| _Roll_DEC |  |
| _Roll_RA |  |
| Veto Counter | 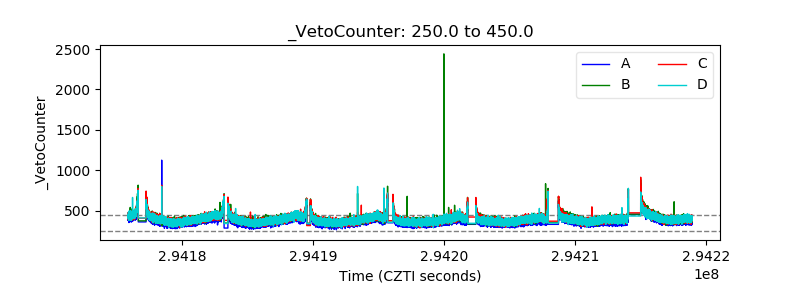 |