| Param | Original file | Final file |
|---|---|---|
| Filename | modeM0/AS1A05_226T06_9000002864_19370cztM0_level2.evt | modeM0/AS1A05_226T06_9000002864_19370cztM0_level2_quad_clean.evt |
| Size (bytes) | 232,859,520 | 43,994,880 |
| Size | 222.1 MB | 42.0 MB |
| Events in quadrant A | 1,174,967 | 307,351 |
| Events in quadrant B | 1,358,779 | 309,549 |
| Events in quadrant C | 1,438,111 | 292,454 |
| Events in quadrant D | 2,923,715 | 257,975 |
| Mode M0 | |||
|---|---|---|---|
| Quadrant | BADHDUFLAG | Total packets | Discarded packets |
| A | 0 | 4926 | 1 |
| B | 0 | 5509 | 1 |
| C | 0 | 5741 | 1 |
| D | 0 | 10273 | 5 |
| Mode M9 | |||
|---|---|---|---|
| Quadrant | BADHDUFLAG | Total packets | Discarded packets |
| A | 0 | 6 | 0 |
| B | 0 | 6 | 0 |
| C | 0 | 6 | 0 |
| D | 0 | 6 | 0 |
| Mode SS | |||
|---|---|---|---|
| Quadrant | BADHDUFLAG | Total packets | Discarded packets |
| A | 0 | 48 | 0 |
| B | 0 | 48 | 0 |
| C | 0 | 48 | 0 |
| D | 0 | 48 | 0 |
| Quadrant | Total seconds | Saturated seconds | Saturation percentage |
|---|---|---|---|
| A | 2278 | 42 | 1.843723% |
| B | 2278 | 70 | 3.072871% |
| C | 2278 | 87 | 3.819140% |
| D | 2277 | 574 | 25.208608% |
Noise dominated data is calculated using 1-second bins in cleaned event files. If a bin has >2000 counts, and if more than 50% of those come from <1% of pixels, then it is considered to be noise-dominated and hence unusable.
| Quadrant | # 1 sec bins | Bins with >0 counts | Bins with >2000 counts | High rate bins dominated by noise | Noise dominated (total time) | Noise dominated (detector-on time) | Marked lightcurve |
|---|---|---|---|---|---|---|---|
| A | 2878 | 2279 | 0 | 0 | 0.00% | 0.00% |  |
| B | 2878 | 2279 | 5 | 5 | 0.17% | 0.22% |  |
| C | 2878 | 2279 | 15 | 15 | 0.52% | 0.66% |  |
| D | 2876 | 2276 | 359 | 359 | 12.48% | 15.77% |  |
Top three noisy pixels from each quadrant. If the there are fewer than three noisy pixels in the level2.evt file, extra rows are filled as -1
| Pixel properties | Quadrant properties | ||||||
|---|---|---|---|---|---|---|---|
| Quadrant | DetID | PixID | Counts | Sigma | Mean | Median | Sigma |
| A | 3 | 1 | 3685 | 52.64 | 303 | 296 | 64.4 |
| A | 0 | 226 | 2692 | 37.22 | 303 | 296 | 64.4 |
| A | 13 | 254 | 2590 | 35.64 | 303 | 296 | 64.4 |
| B | 6 | 36 | 98951 | 1626.83 | 300 | 292 | 60.6 |
| B | 4 | 216 | 39244 | 642.3 | 300 | 292 | 60.6 |
| B | 15 | 32 | 20645 | 335.61 | 300 | 292 | 60.6 |
| C | 9 | 54 | 247467 | 3541.08 | 289 | 290 | 69.8 |
| C | 14 | 238 | 45001 | 640.53 | 289 | 290 | 69.8 |
| C | 3 | 233 | 8719 | 120.75 | 289 | 290 | 69.8 |
| D | 10 | 66 | 1031165 | 15078.91 | 270 | 261 | 68.4 |
| D | 1 | 52 | 463553 | 6776.52 | 270 | 261 | 68.4 |
| D | 7 | 238 | 185289 | 2706.38 | 270 | 261 | 68.4 |
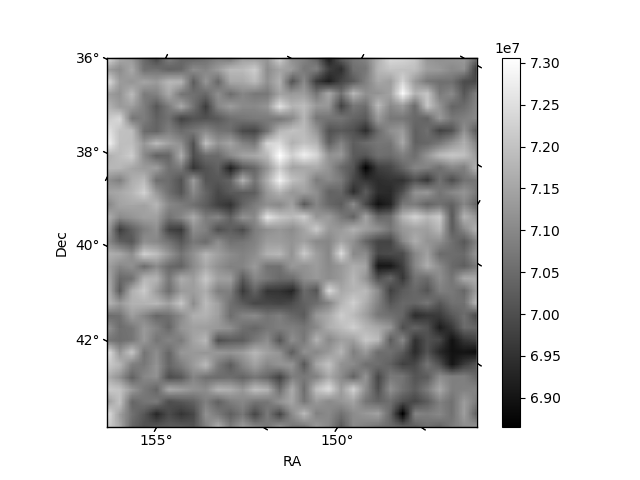
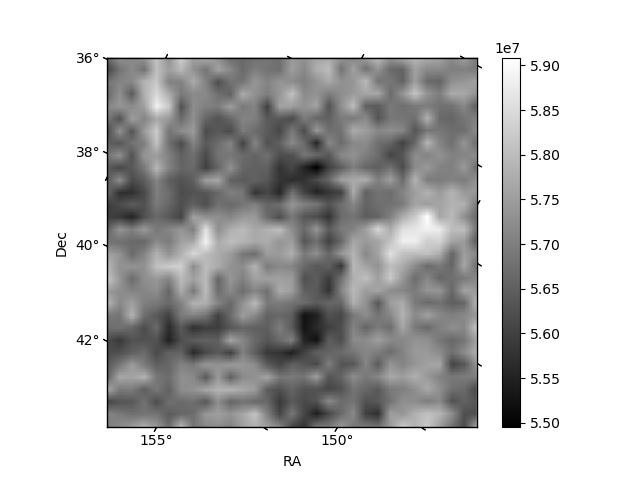
Histogram calculated using DETX and DETY for each event in the final _common_clean file
| Quadrant A | 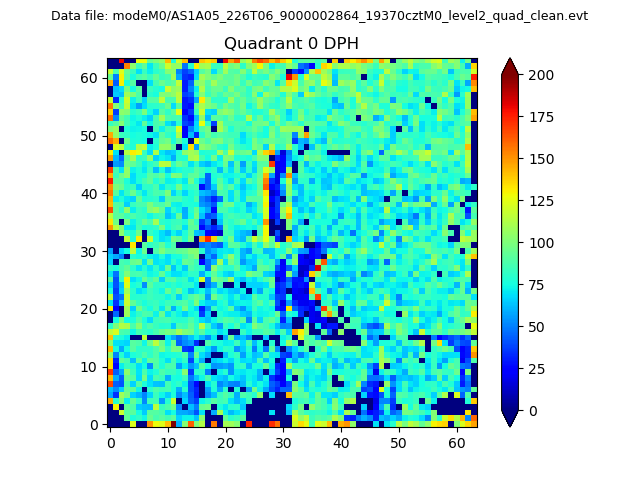 |
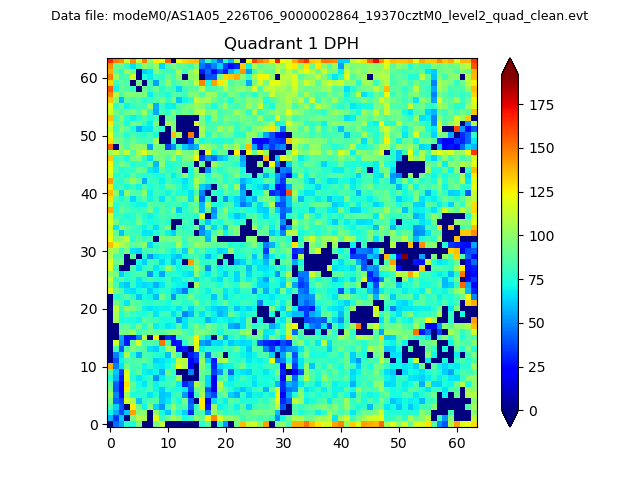 |
Quadrant B |
|---|---|---|---|
| Quadrant D | 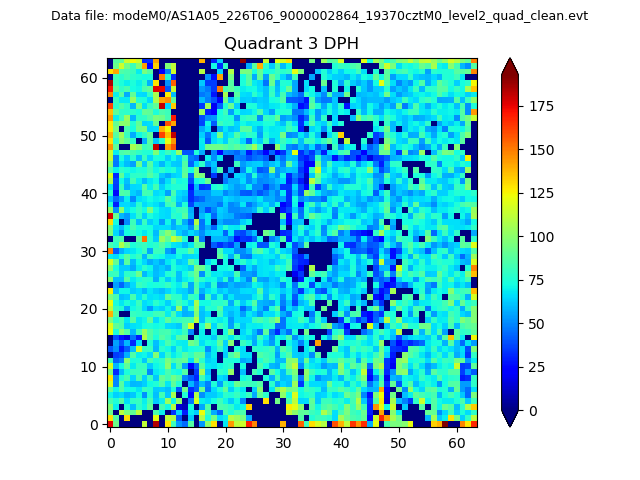 |
 |
Quadrant C |
| Plot type | Count rate plots | Images |
|---|---|---|
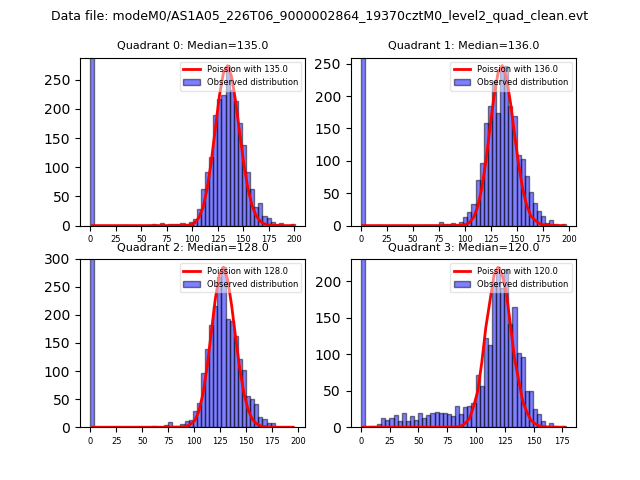
| Comparison with Poisson distribution Blue bars denote a histogram of data divided into 1 sec bins. Red curve is a Poisson curve with rate = median count rate of data. |
 |
 |
| Quadrant-wise count rates Data is divided into 100 sec bins |
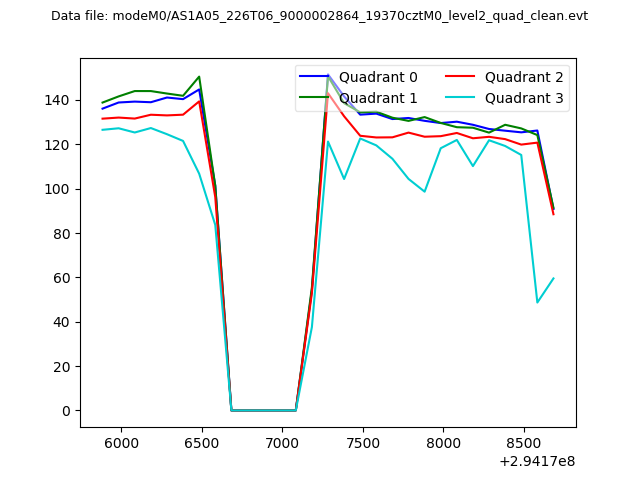 |
|
| Module-wise count rates for Quadrant A Data is divided into 100 sec bins |
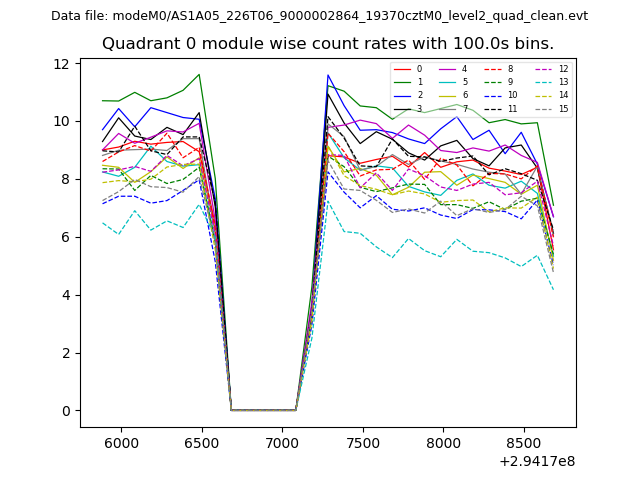 |
 |
| Module-wise count rates for Quadrant B Data is divided into 100 sec bins |
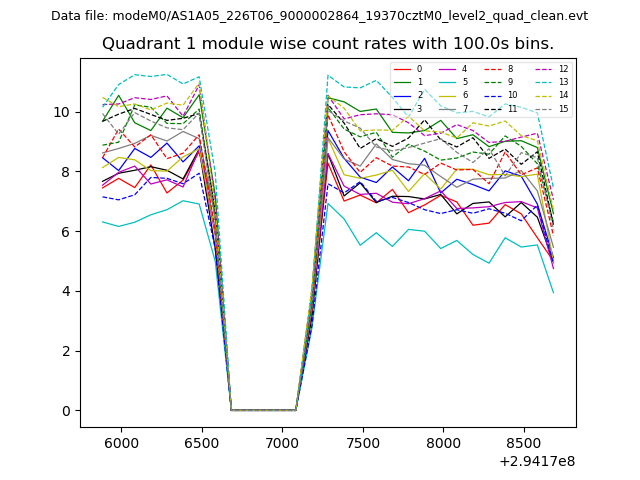 |
 |
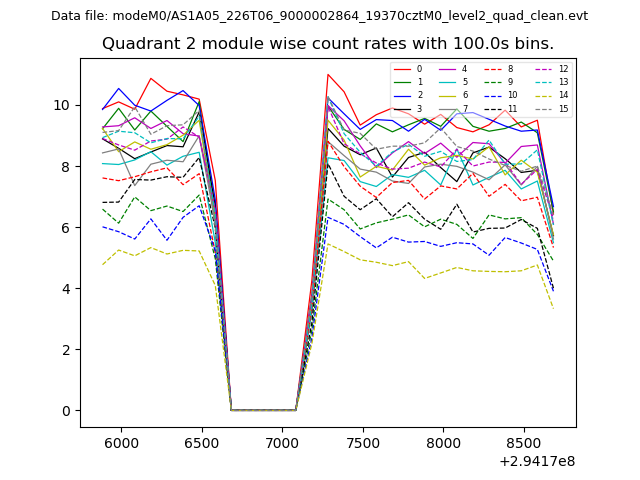
| Module-wise count rates for Quadrant C Data is divided into 100 sec bins |
 |
 |
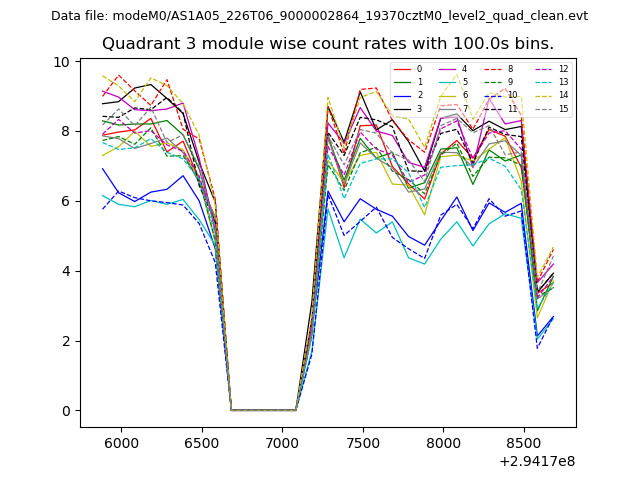
| Module-wise count rates for Quadrant D Data is divided into 100 sec bins |
 |
 |
| Parameter | Plot |
|---|---|
| CZT HV Monitor | 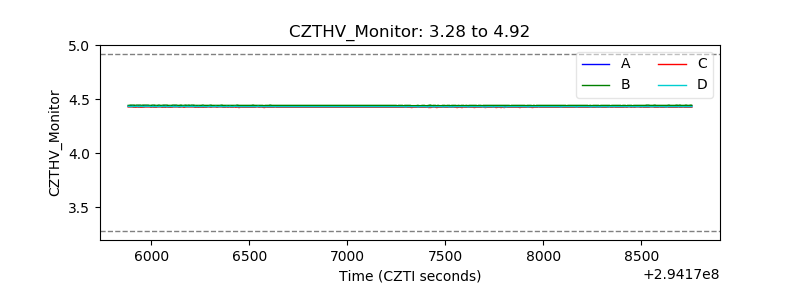 |
| D_VDD | 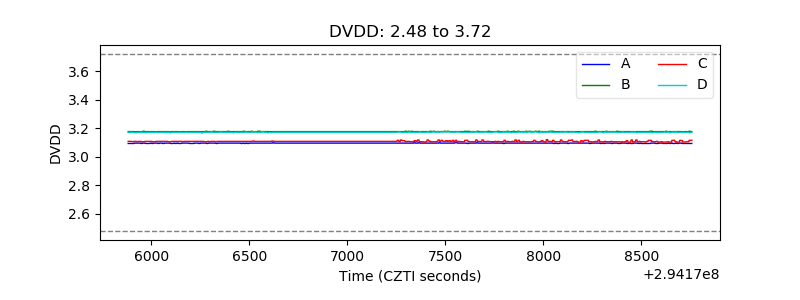 |
| Temperature 1 | 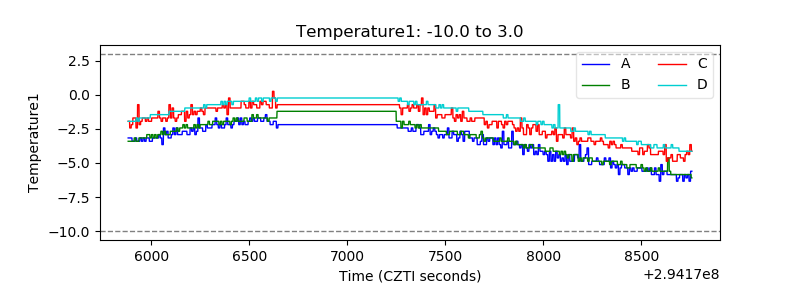 |
| Veto HV Monitor | 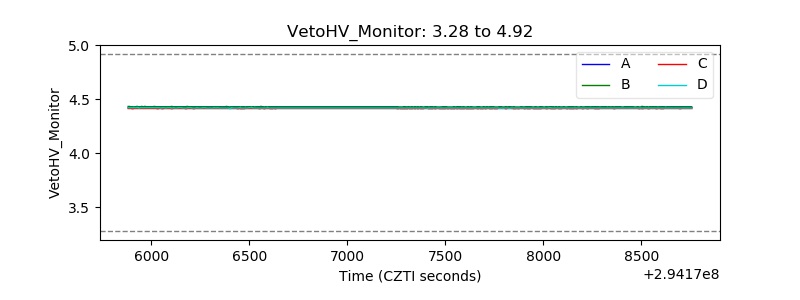 |
| Veto LLD | 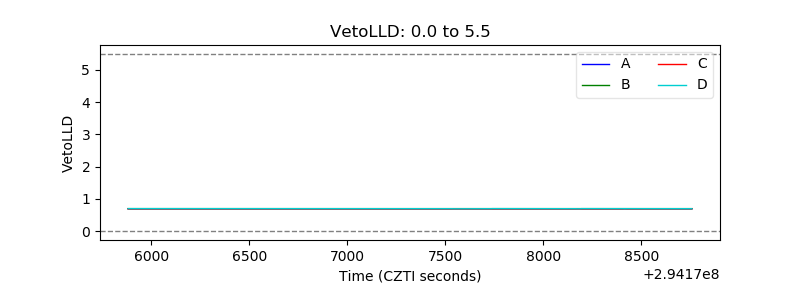 |
| Alpha Counter | 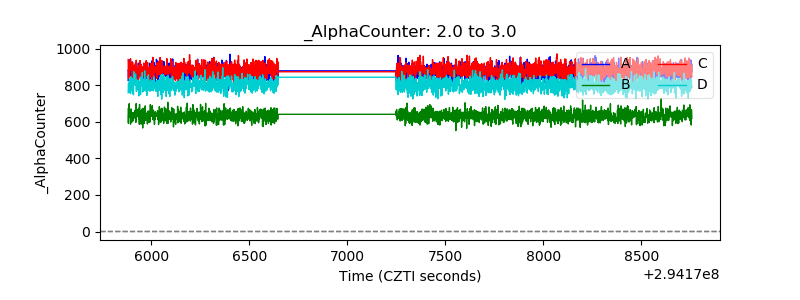 |
| _CPM_Rate | 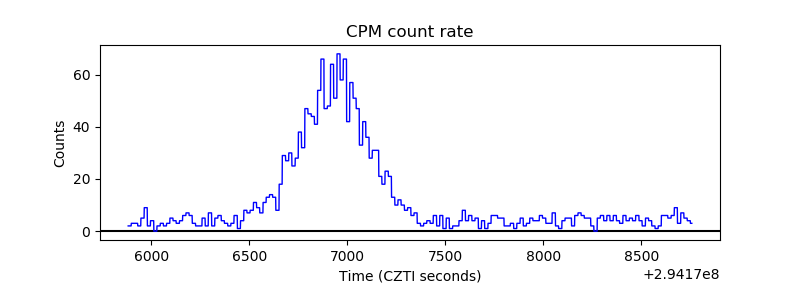 |
| CZT Counter |  |
| +2.5 Volts monitor |  |
| +5 Volts monitor |  |
| _ROLL_ROT |  |
| _Roll_DEC | 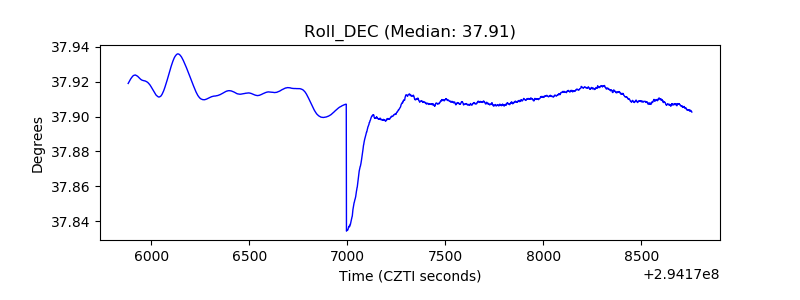 |
| _Roll_RA |  |
| Veto Counter | 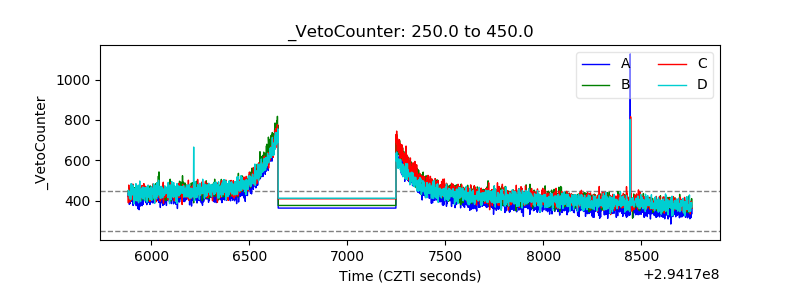 |