| Param | Original file | Final file |
|---|---|---|
| Filename | modeM0/AS1A05_226T06_9000002864_19372cztM0_level2.evt | modeM0/AS1A05_226T06_9000002864_19372cztM0_level2_quad_clean.evt |
| Size (bytes) | 777,559,680 | 110,856,960 |
| Size | 741.5 MB | 105.7 MB |
| Events in quadrant A | 3,764,835 | 746,124 |
| Events in quadrant B | 4,013,952 | 750,115 |
| Events in quadrant C | 3,882,988 | 722,277 |
| Events in quadrant D | 11,342,122 | 578,114 |
| Mode M0 | |||
|---|---|---|---|
| Quadrant | BADHDUFLAG | Total packets | Discarded packets |
| A | 0 | 16635 | 2 |
| B | 0 | 17200 | 2 |
| C | 0 | 16773 | 2 |
| D | 0 | 39383 | 2 |
| Mode M9 | |||
|---|---|---|---|
| Quadrant | BADHDUFLAG | Total packets | Discarded packets |
| A | 0 | 6 | 0 |
| B | 0 | 6 | 0 |
| C | 0 | 6 | 0 |
| D | 0 | 6 | 0 |
| Mode SS | |||
|---|---|---|---|
| Quadrant | BADHDUFLAG | Total packets | Discarded packets |
| A | 0 | 164 | 0 |
| B | 0 | 164 | 0 |
| C | 0 | 164 | 0 |
| D | 0 | 164 | 0 |
| Quadrant | Total seconds | Saturated seconds | Saturation percentage |
|---|---|---|---|
| A | 8053 | 41 | 0.509127% |
| B | 8054 | 114 | 1.415446% |
| C | 8054 | 99 | 1.229203% |
| D | 8054 | 2549 | 31.648870% |
Noise dominated data is calculated using 1-second bins in cleaned event files. If a bin has >2000 counts, and if more than 50% of those come from <1% of pixels, then it is considered to be noise-dominated and hence unusable.
| Quadrant | # 1 sec bins | Bins with >0 counts | Bins with >2000 counts | High rate bins dominated by noise | Noise dominated (total time) | Noise dominated (detector-on time) | Marked lightcurve |
|---|---|---|---|---|---|---|---|
| A | 8628 | 8055 | 0 | 0 | 0.00% | 0.00% | 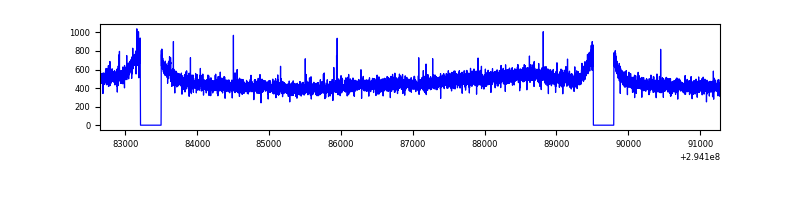 |
| B | 8629 | 8055 | 17 | 17 | 0.20% | 0.21% | 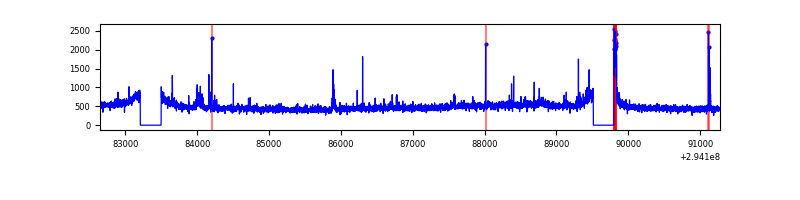 |
| C | 8629 | 8056 | 0 | 0 | 0.00% | 0.00% | 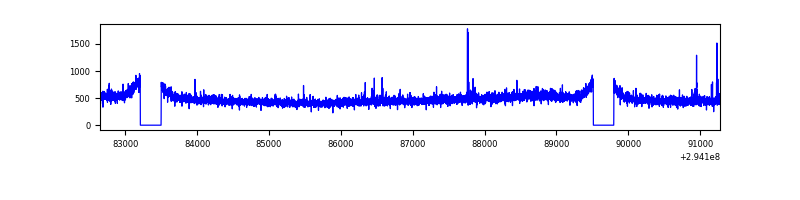 |
| D | 8629 | 8054 | 2009 | 2009 | 23.28% | 24.94% | 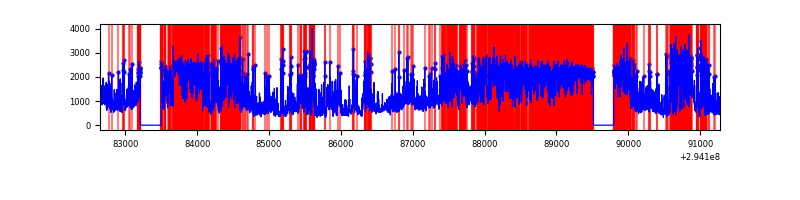 |
Top three noisy pixels from each quadrant. If the there are fewer than three noisy pixels in the level2.evt file, extra rows are filled as -1
| Pixel properties | Quadrant properties | ||||||
|---|---|---|---|---|---|---|---|
| Quadrant | DetID | PixID | Counts | Sigma | Mean | Median | Sigma |
| A | 0 | 226 | 8479 | 37.83 | 975 | 952 | 199.0 |
| A | 13 | 254 | 8183 | 36.35 | 975 | 952 | 199.0 |
| A | 3 | 137 | 7738 | 34.11 | 975 | 952 | 199.0 |
| B | 7 | 220 | 66525 | 355.05 | 971 | 944 | 184.7 |
| B | 0 | 230 | 42156 | 223.12 | 971 | 944 | 184.7 |
| B | 4 | 216 | 23234 | 120.68 | 971 | 944 | 184.7 |
| C | 14 | 238 | 145116 | 646.44 | 944 | 949 | 223.0 |
| C | 5 | 112 | 32279 | 140.48 | 944 | 949 | 223.0 |
| C | 3 | 233 | 6954 | 26.93 | 944 | 949 | 223.0 |
| D | 10 | 66 | 4757319 | 22946.99 | 839 | 813 | 207.3 |
| D | 7 | 238 | 1536346 | 7407.93 | 839 | 813 | 207.3 |
| D | 1 | 52 | 1431746 | 6903.3 | 839 | 813 | 207.3 |
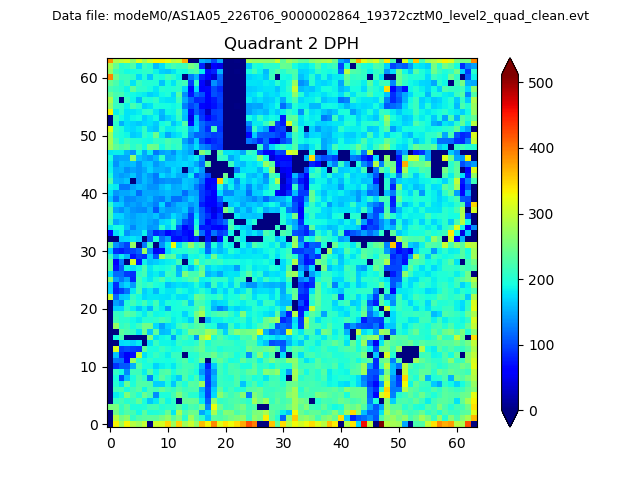
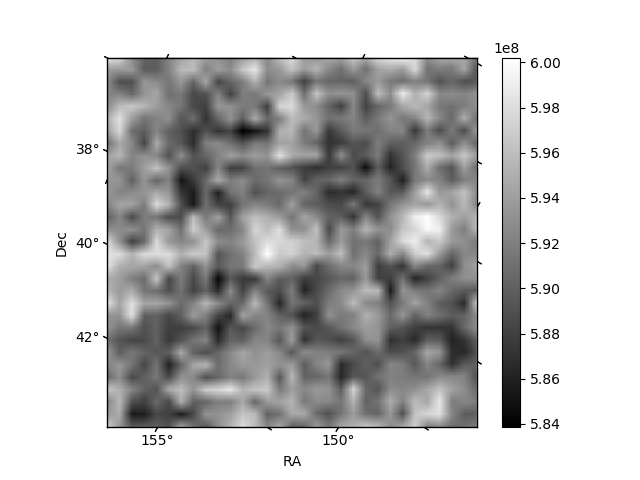
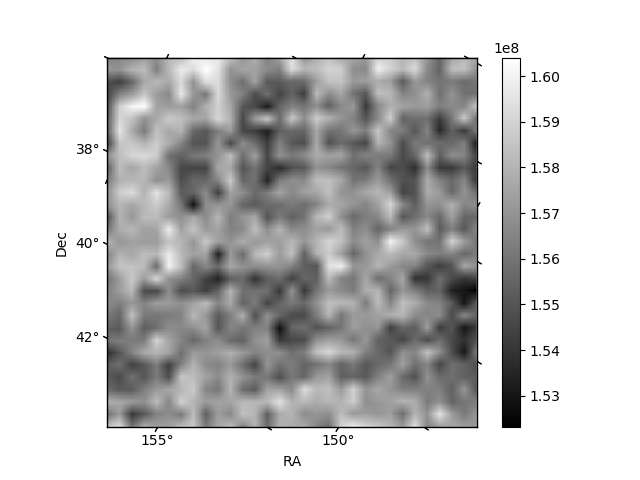
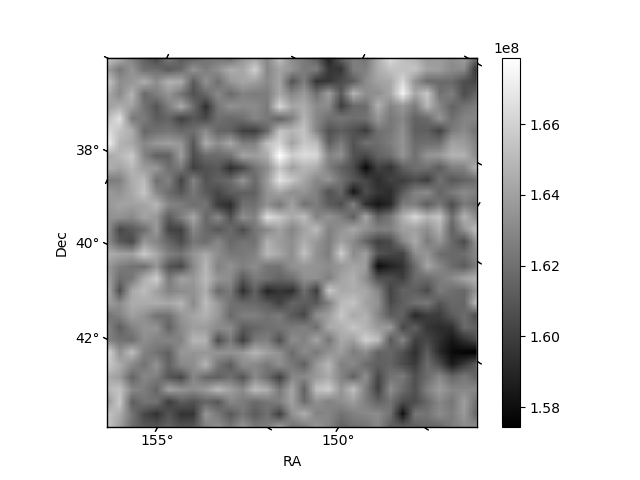
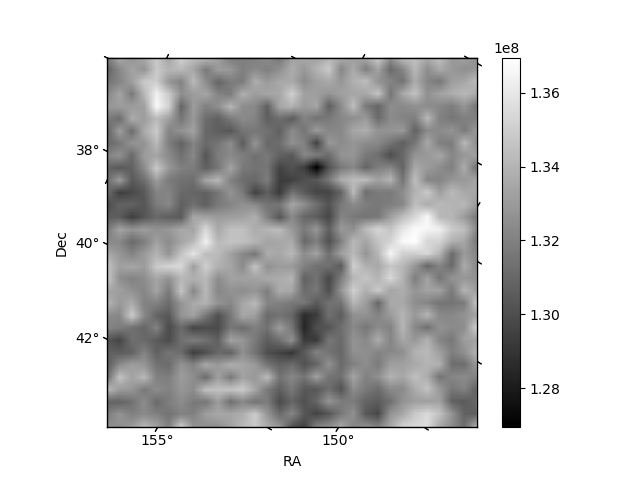
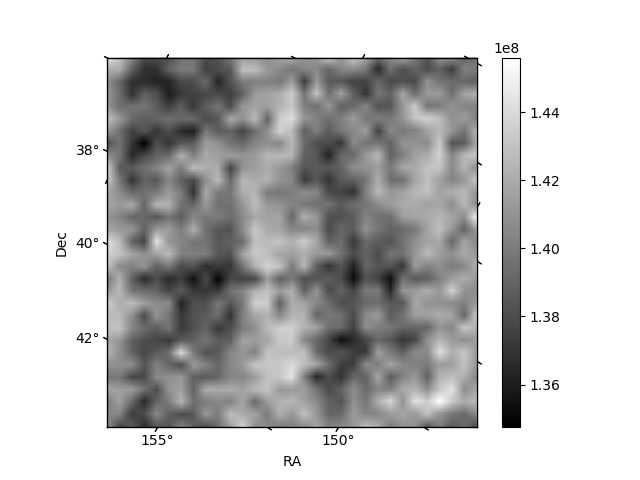
Histogram calculated using DETX and DETY for each event in the final _common_clean file
| Quadrant A | 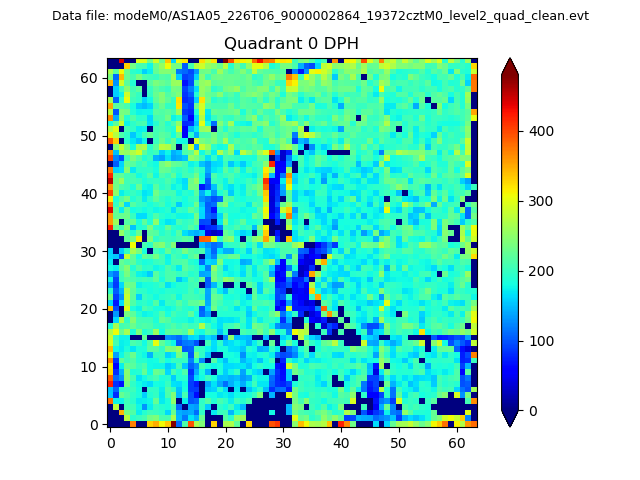 |
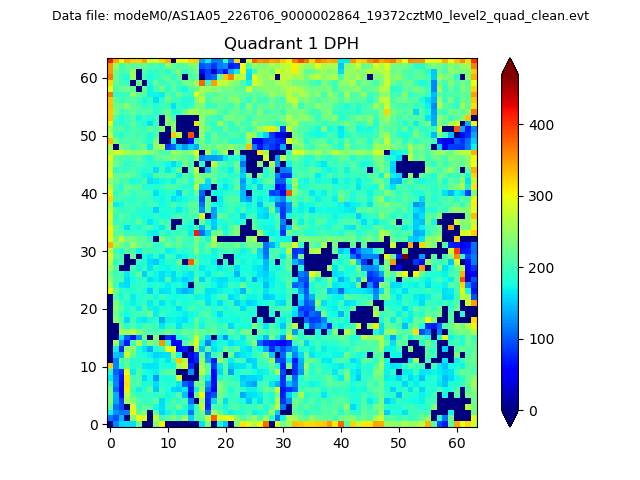 |
Quadrant B |
|---|---|---|---|
| Quadrant D | 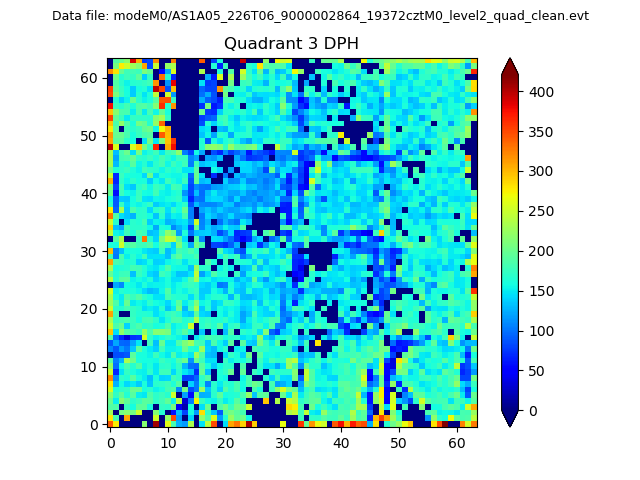 |
 |
Quadrant C |
| Plot type | Count rate plots | Images |
|---|---|---|
| Comparison with Poisson distribution Blue bars denote a histogram of data divided into 1 sec bins. Red curve is a Poisson curve with rate = median count rate of data. |
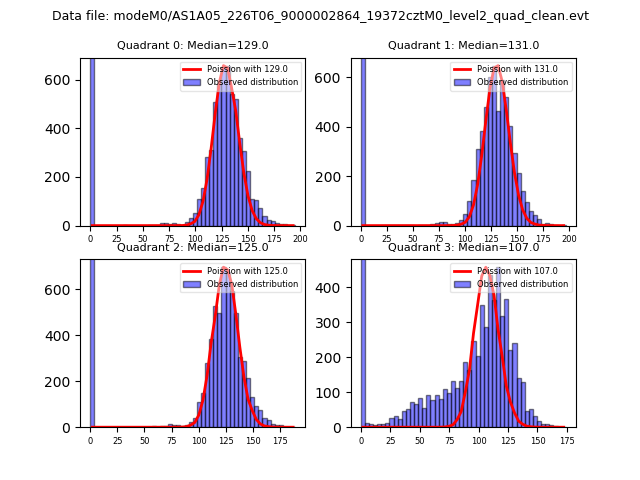 |
 |
| Quadrant-wise count rates Data is divided into 100 sec bins |
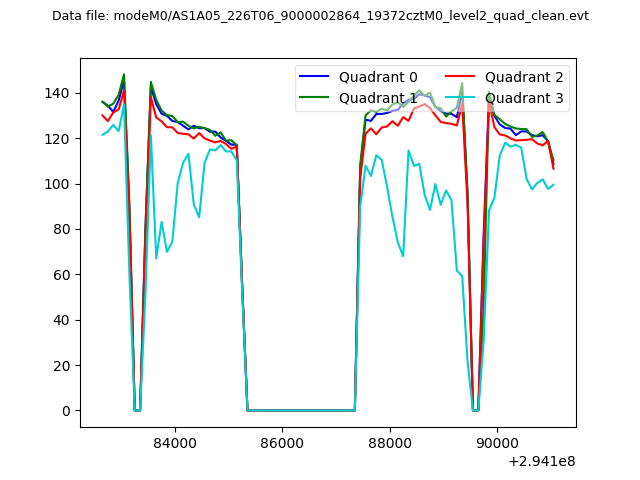 |
|
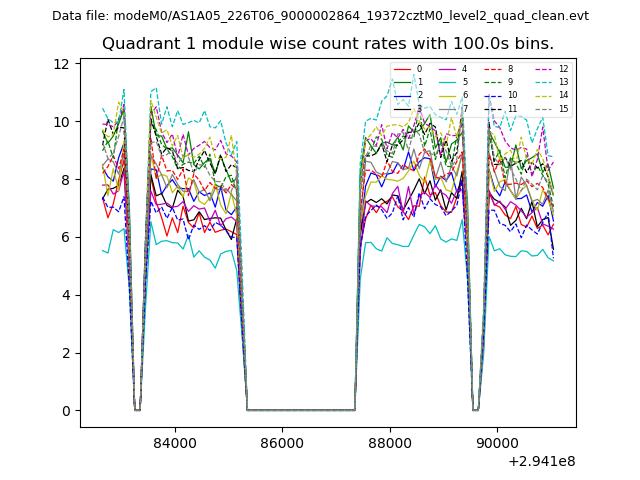
| Module-wise count rates for Quadrant A Data is divided into 100 sec bins |
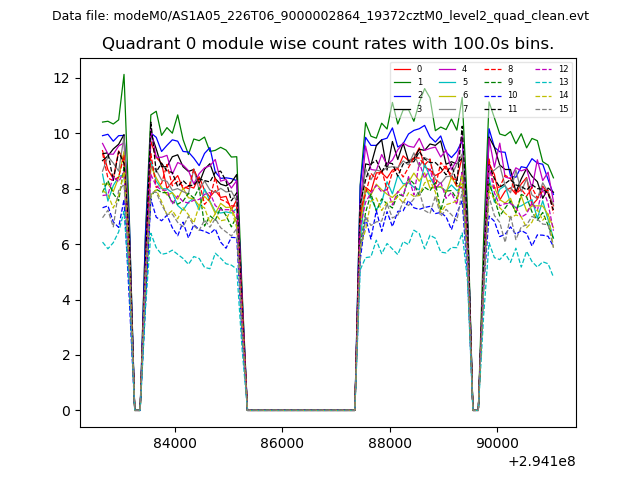 |
 |
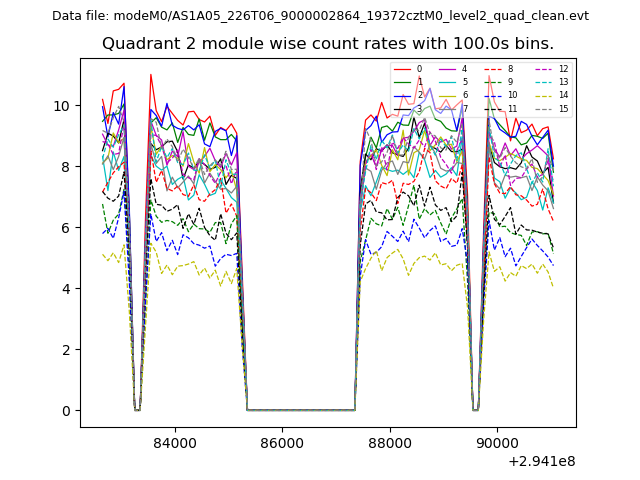
| Module-wise count rates for Quadrant B Data is divided into 100 sec bins |
 |
 |
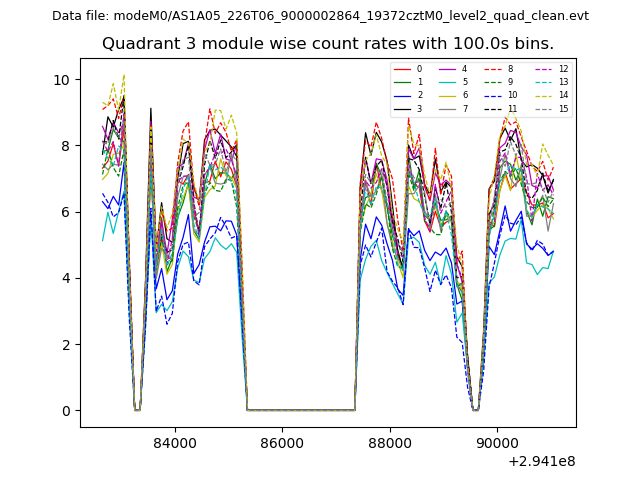
| Module-wise count rates for Quadrant C Data is divided into 100 sec bins |
 |
 |
| Module-wise count rates for Quadrant D Data is divided into 100 sec bins |
 |
 |
| Parameter | Plot |
|---|---|
| CZT HV Monitor | 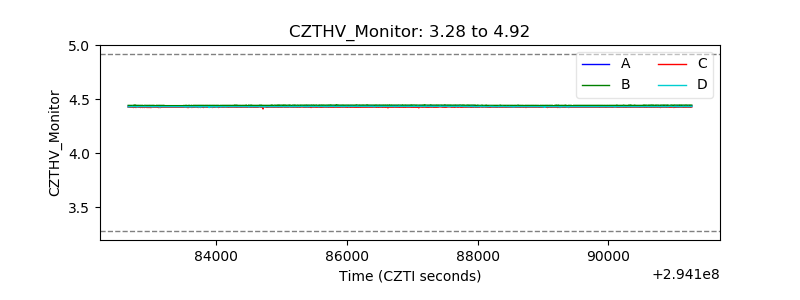 |
| D_VDD | 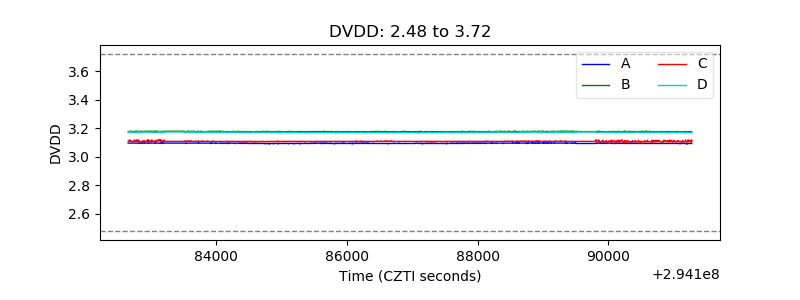 |
| Temperature 1 | 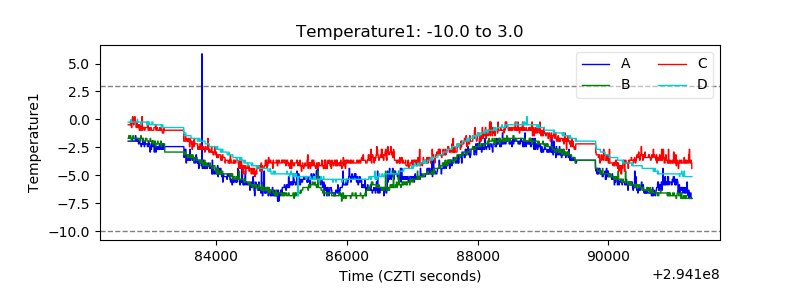 |
| Veto HV Monitor | 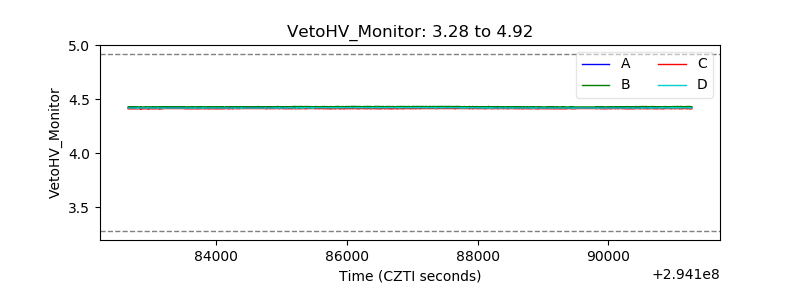 |
| Veto LLD | 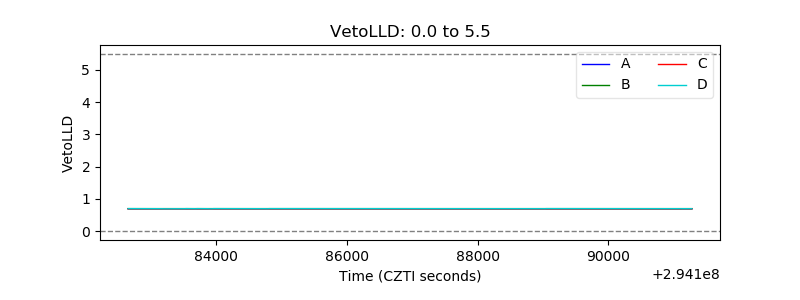 |
| Alpha Counter | 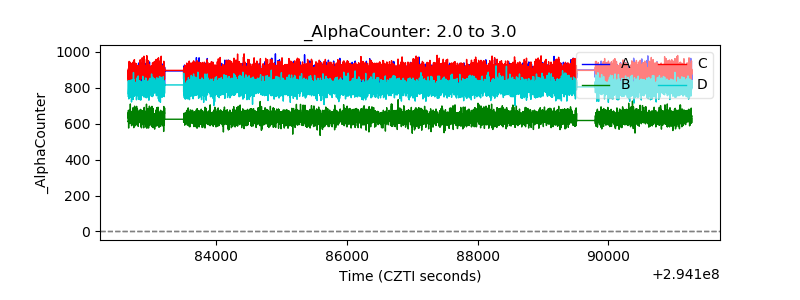 |
| _CPM_Rate | 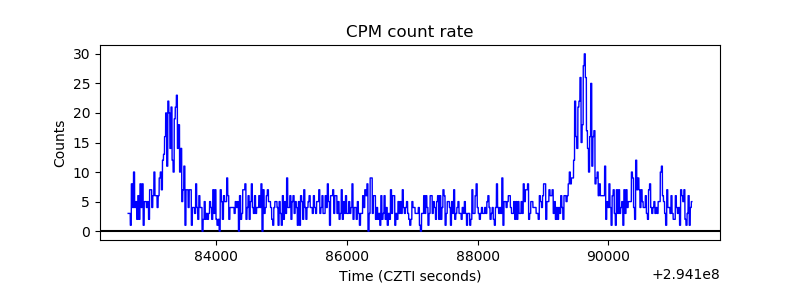 |
| CZT Counter | 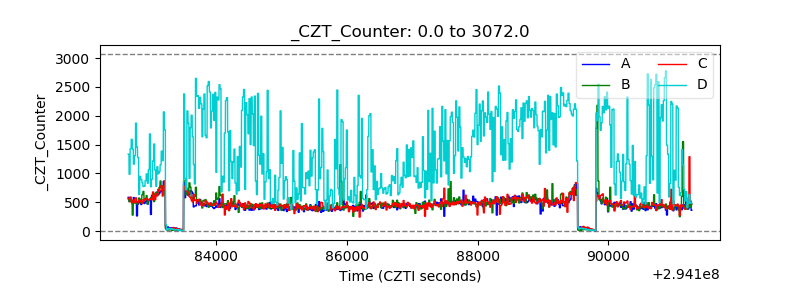 |
| +2.5 Volts monitor |  |
| +5 Volts monitor |  |
| _ROLL_ROT | 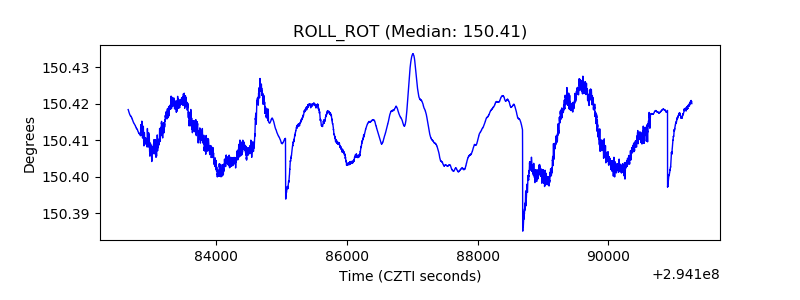 |
| _Roll_DEC | 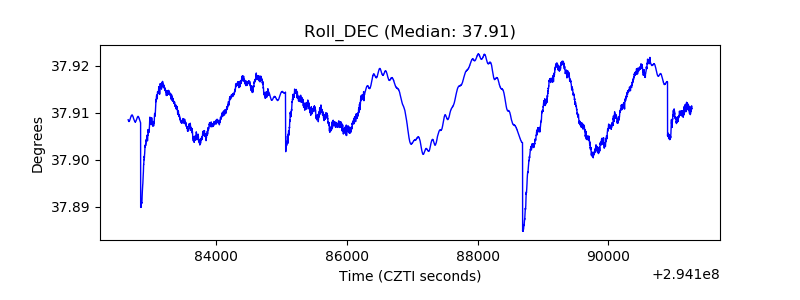 |
| _Roll_RA | 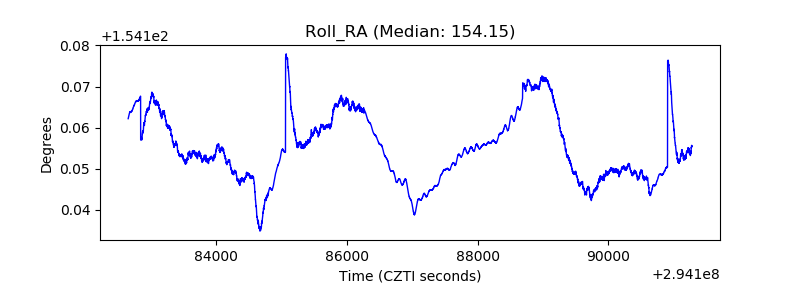 |
| Veto Counter | 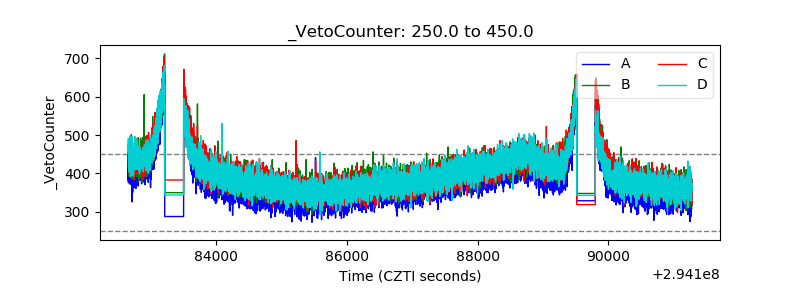 |