| Param | Original file | Final file |
|---|---|---|
| Filename | modeM0/AS1A05_226T06_9000002864_19375cztM0_level2.evt | modeM0/AS1A05_226T06_9000002864_19375cztM0_level2_quad_clean.evt |
| Size (bytes) | 1,846,941,120 | 212,065,920 |
| Size | 1.7 GB | 202.2 MB |
| Events in quadrant A | 8,788,046 | 1,379,656 |
| Events in quadrant B | 9,227,327 | 1,388,227 |
| Events in quadrant C | 8,880,970 | 1,329,420 |
| Events in quadrant D | 27,771,379 | 1,027,142 |
| Mode M0 | |||
|---|---|---|---|
| Quadrant | BADHDUFLAG | Total packets | Discarded packets |
| A | 0 | 38504 | 4 |
| B | 0 | 39475 | 4 |
| C | 0 | 38492 | 4 |
| D | 0 | 95548 | 7 |
| Mode M9 | |||
|---|---|---|---|
| Quadrant | BADHDUFLAG | Total packets | Discarded packets |
| A | 0 | 21 | 0 |
| B | 0 | 21 | 0 |
| C | 0 | 21 | 0 |
| D | 0 | 21 | 0 |
| Mode SS | |||
|---|---|---|---|
| Quadrant | BADHDUFLAG | Total packets | Discarded packets |
| A | 0 | 384 | 0 |
| B | 0 | 384 | 0 |
| C | 0 | 384 | 0 |
| D | 0 | 384 | 0 |
| Quadrant | Total seconds | Saturated seconds | Saturation percentage |
|---|---|---|---|
| A | 18806 | 126 | 0.669999% |
| B | 18806 | 235 | 1.249601% |
| C | 18806 | 200 | 1.063490% |
| D | 18806 | 6119 | 32.537488% |
Noise dominated data is calculated using 1-second bins in cleaned event files. If a bin has >2000 counts, and if more than 50% of those come from <1% of pixels, then it is considered to be noise-dominated and hence unusable.
| Quadrant | # 1 sec bins | Bins with >0 counts | Bins with >2000 counts | High rate bins dominated by noise | Noise dominated (total time) | Noise dominated (detector-on time) | Marked lightcurve |
|---|---|---|---|---|---|---|---|
| A | 20916 | 18808 | 4 | 4 | 0.02% | 0.02% | 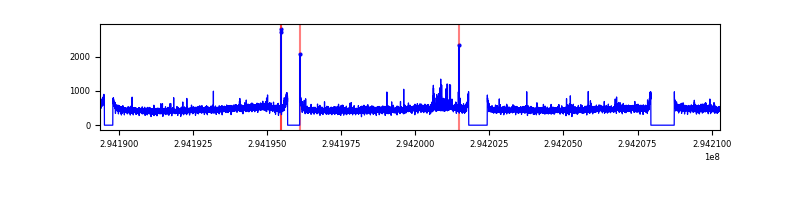 |
| B | 20916 | 18807 | 42 | 42 | 0.20% | 0.22% | 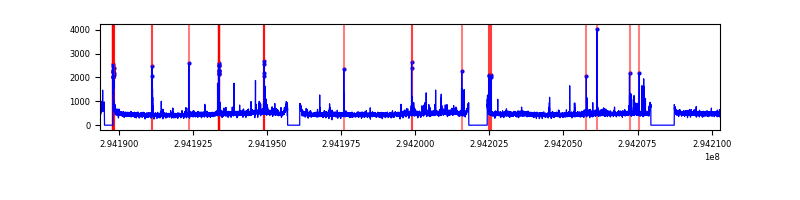 |
| C | 20916 | 18808 | 1 | 1 | 0.00% | 0.01% | 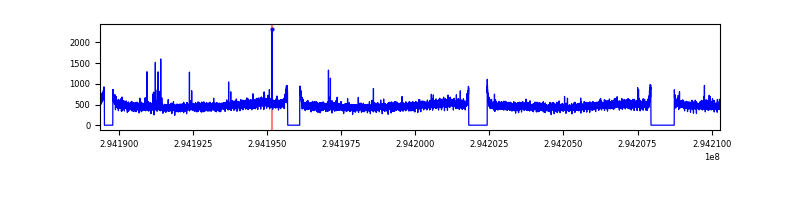 |
| D | 20916 | 18807 | 4886 | 4886 | 23.36% | 25.98% | 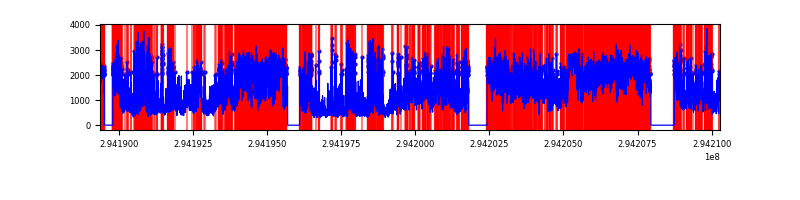 |
Top three noisy pixels from each quadrant. If the there are fewer than three noisy pixels in the level2.evt file, extra rows are filled as -1
| Pixel properties | Quadrant properties | ||||||
|---|---|---|---|---|---|---|---|
| Quadrant | DetID | PixID | Counts | Sigma | Mean | Median | Sigma |
| A | 4 | 2 | 66706 | 141.32 | 2256 | 2207 | 456.4 |
| A | 0 | 226 | 19854 | 38.66 | 2256 | 2207 | 456.4 |
| A | 13 | 254 | 18397 | 35.47 | 2256 | 2207 | 456.4 |
| B | 7 | 220 | 87853 | 198.36 | 2244 | 2177 | 431.9 |
| B | 3 | 64 | 74762 | 168.05 | 2244 | 2177 | 431.9 |
| B | 0 | 230 | 63250 | 141.4 | 2244 | 2177 | 431.9 |
| C | 14 | 238 | 334572 | 657.91 | 2163 | 2178 | 505.2 |
| C | 3 | 233 | 34597 | 64.17 | 2163 | 2178 | 505.2 |
| C | 5 | 112 | 24607 | 44.39 | 2163 | 2178 | 505.2 |
| D | 10 | 66 | 12974047 | 27754.73 | 1922 | 1868 | 467.4 |
| D | 11 | 176 | 2458475 | 5256.05 | 1922 | 1868 | 467.4 |
| D | 1 | 52 | 2297356 | 4911.33 | 1922 | 1868 | 467.4 |
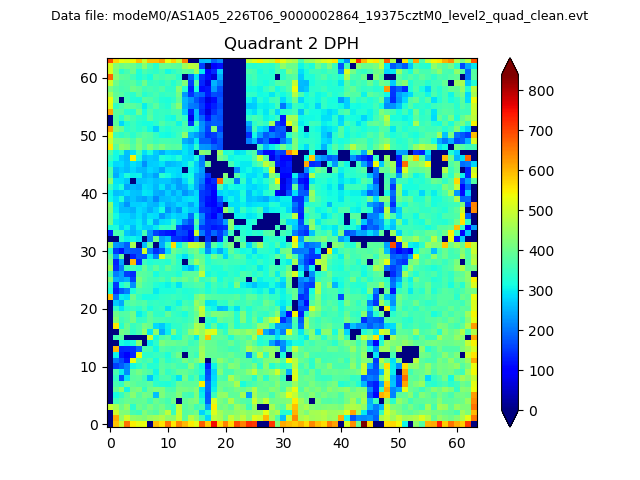
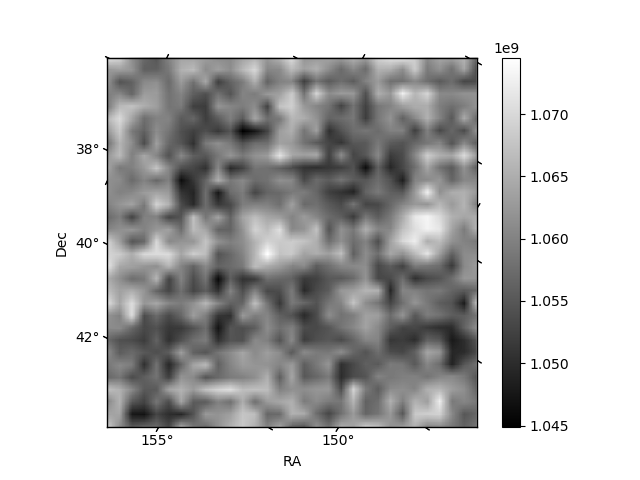
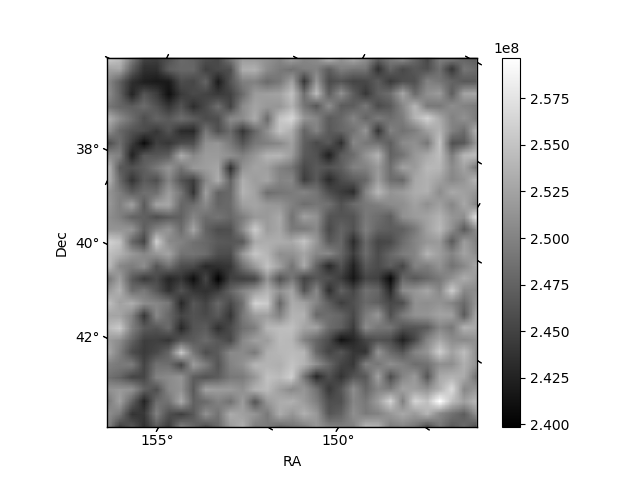
Histogram calculated using DETX and DETY for each event in the final _common_clean file
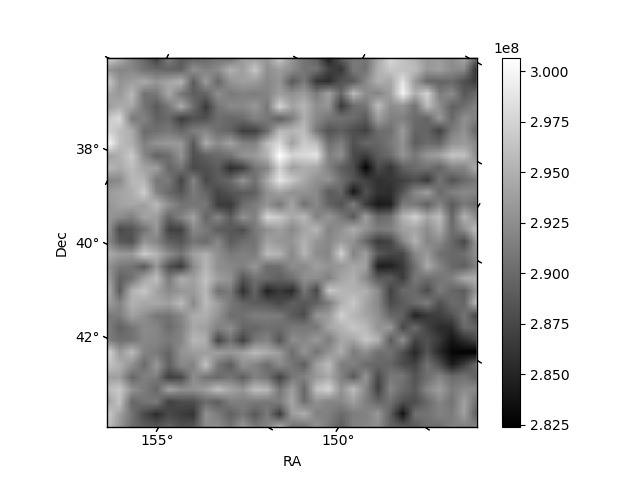
| Quadrant A | 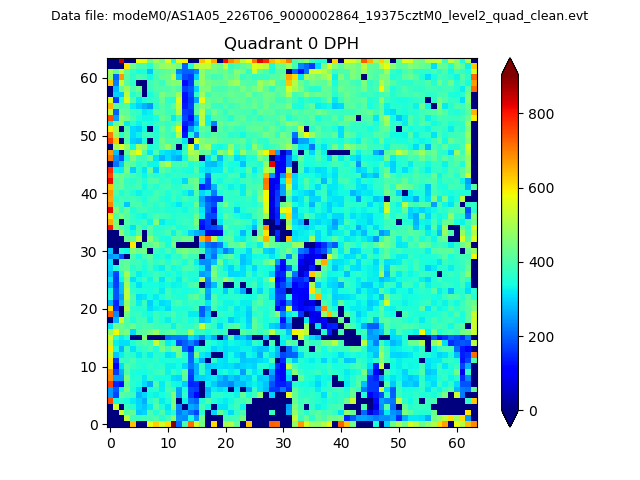 |
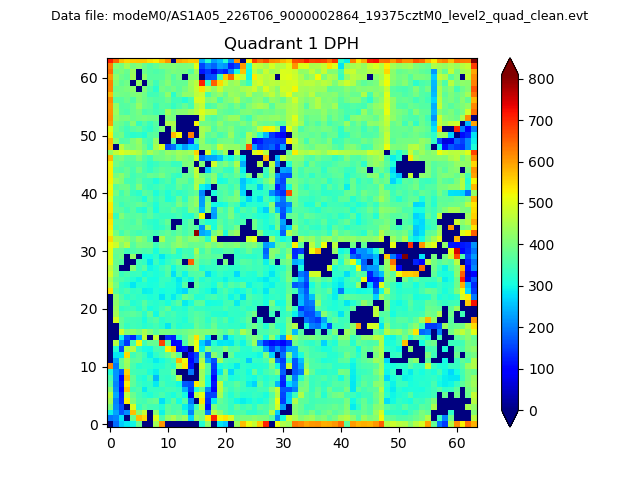 |
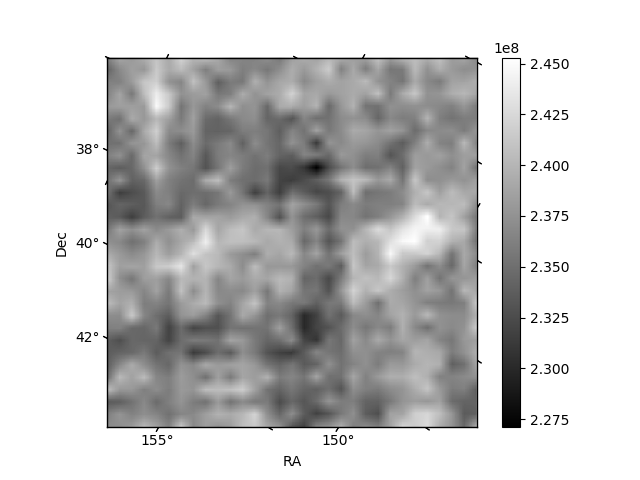
Quadrant B |
|---|---|---|---|
| Quadrant D | 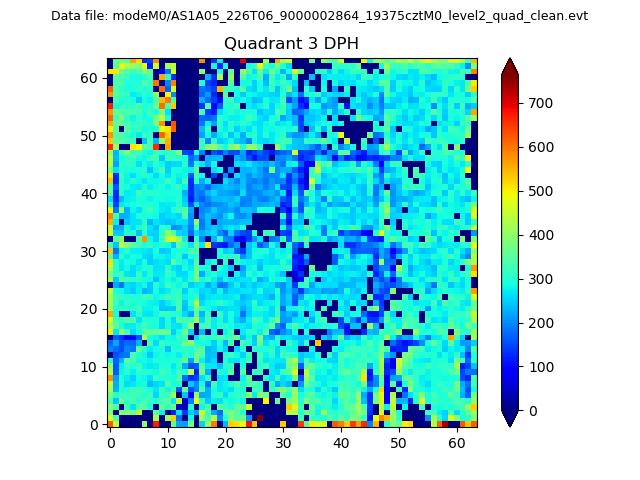 |
 |
Quadrant C |
| Plot type | Count rate plots | Images |
|---|---|---|
| Comparison with Poisson distribution Blue bars denote a histogram of data divided into 1 sec bins. Red curve is a Poisson curve with rate = median count rate of data. |
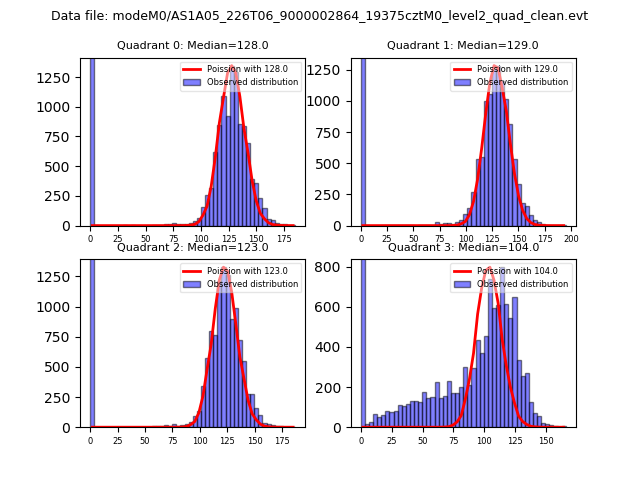 |
 |
| Quadrant-wise count rates Data is divided into 100 sec bins |
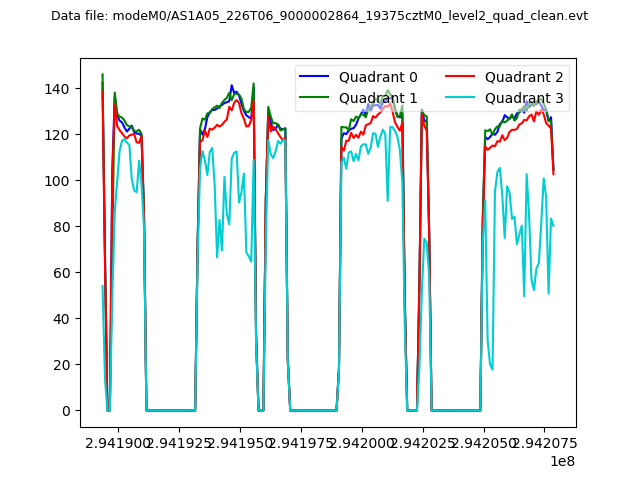 |
|
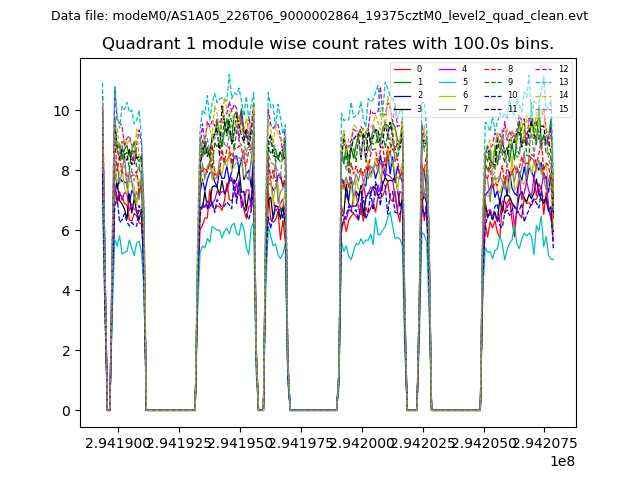
| Module-wise count rates for Quadrant A Data is divided into 100 sec bins |
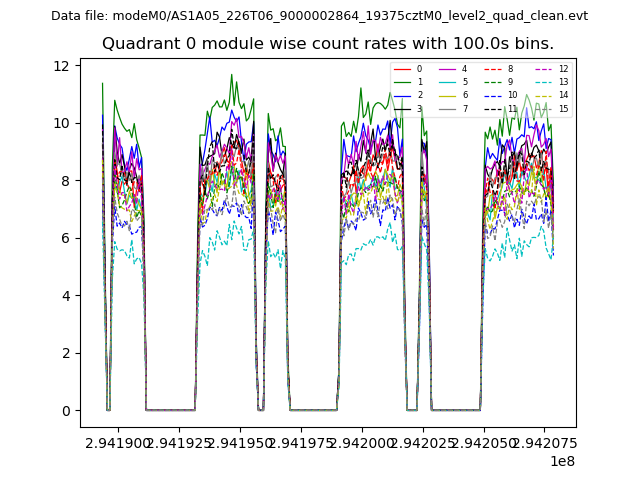 |
 |
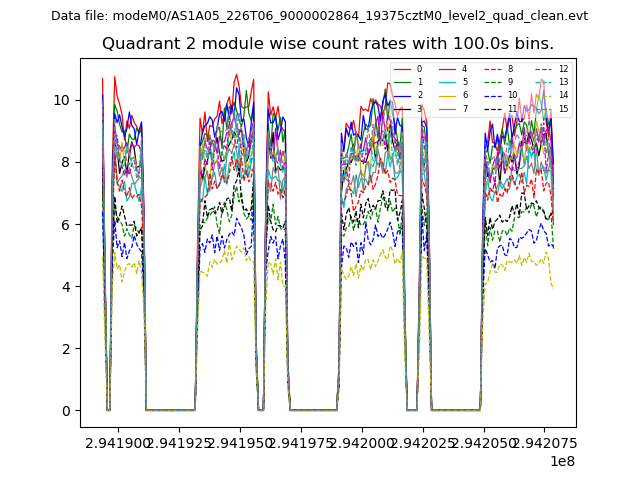
| Module-wise count rates for Quadrant B Data is divided into 100 sec bins |
 |
 |
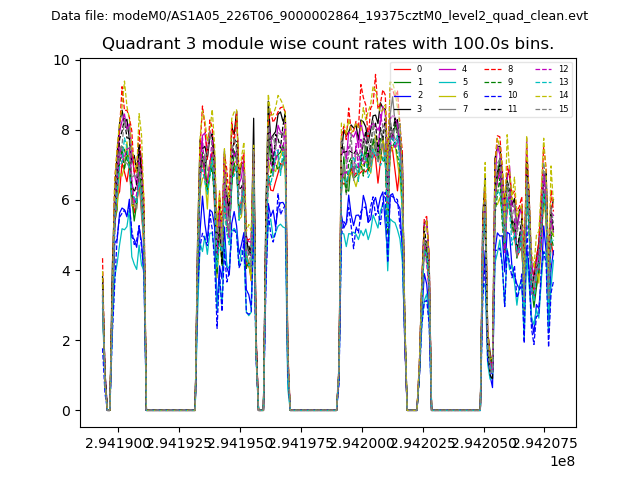
| Module-wise count rates for Quadrant C Data is divided into 100 sec bins |
 |
 |
| Module-wise count rates for Quadrant D Data is divided into 100 sec bins |
 |
 |
| Parameter | Plot |
|---|---|
| CZT HV Monitor | 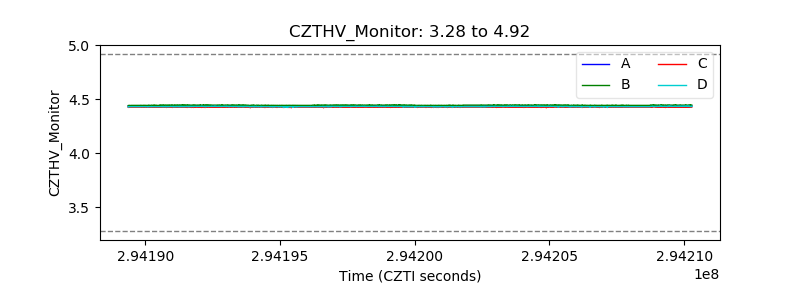 |
| D_VDD | 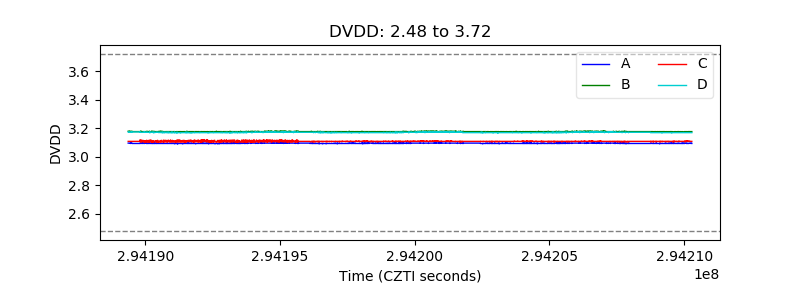 |
| Temperature 1 | 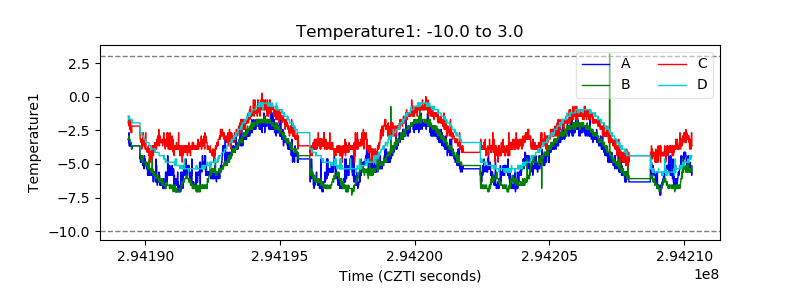 |
| Veto HV Monitor | 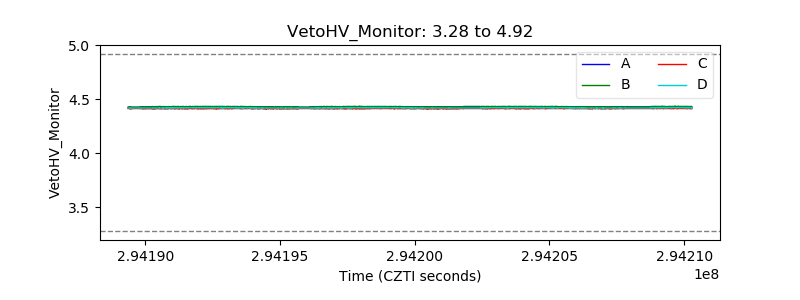 |
| Veto LLD | 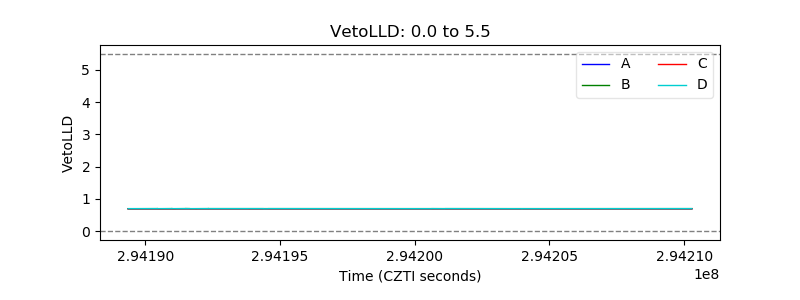 |
| Alpha Counter | 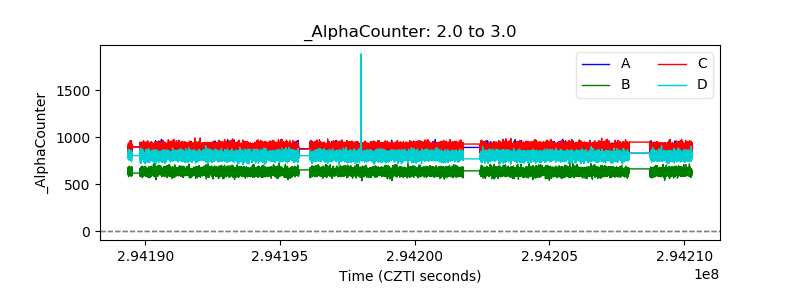 |
| _CPM_Rate | 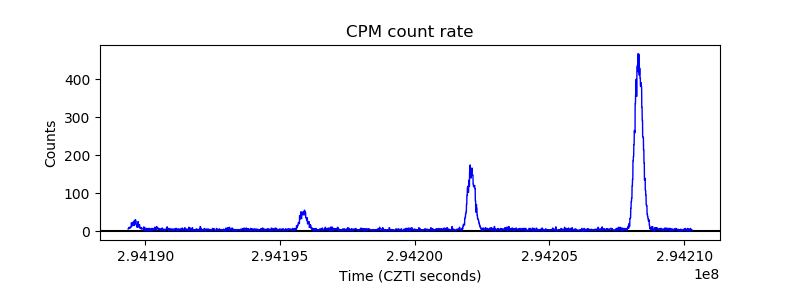 |
| CZT Counter | 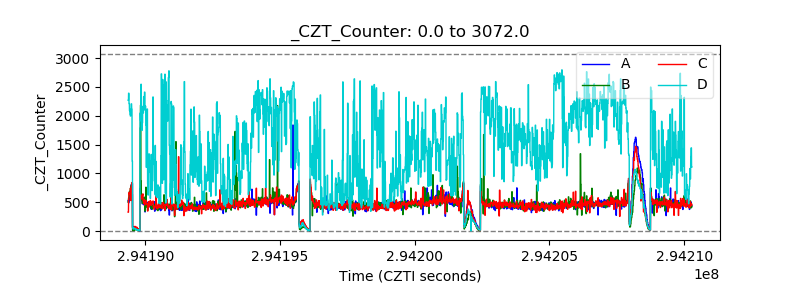 |
| +2.5 Volts monitor |  |
| +5 Volts monitor |  |
| _ROLL_ROT | 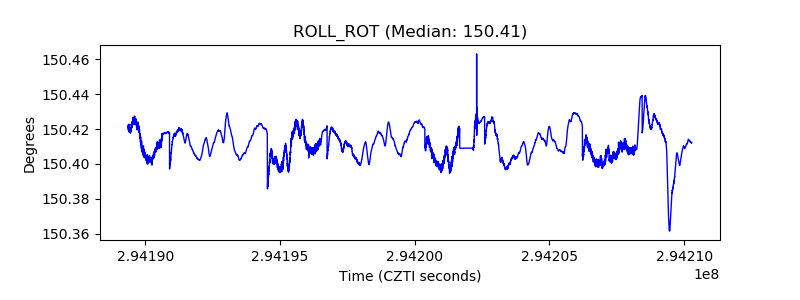 |
| _Roll_DEC | 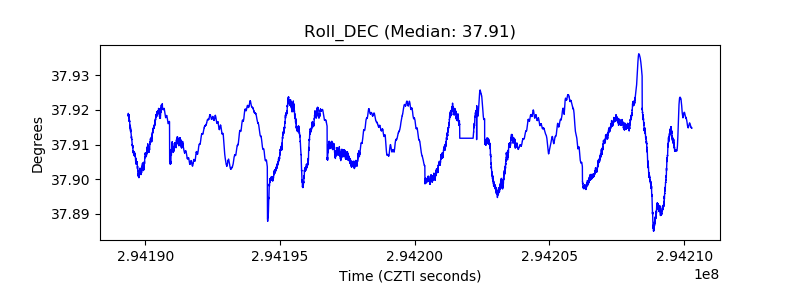 |
| _Roll_RA | 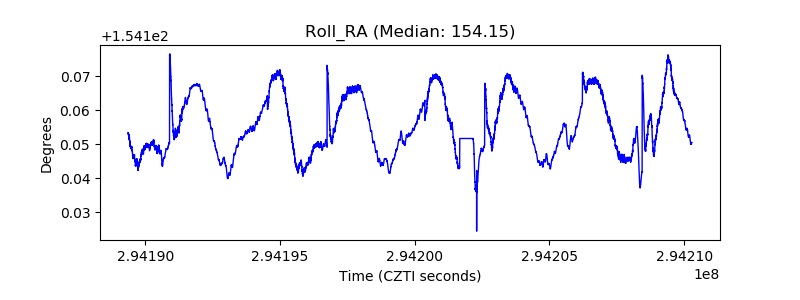 |
| Veto Counter | 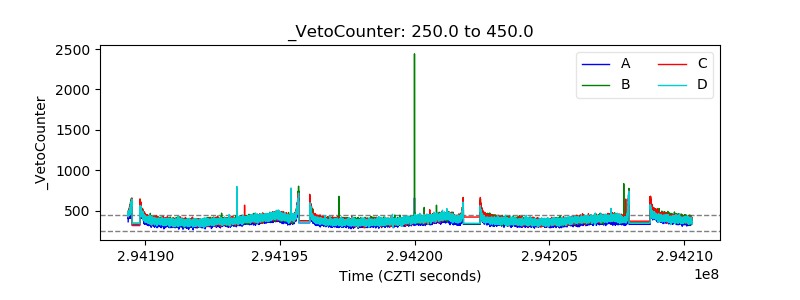 |