| Param | Original file | Final file |
|---|---|---|
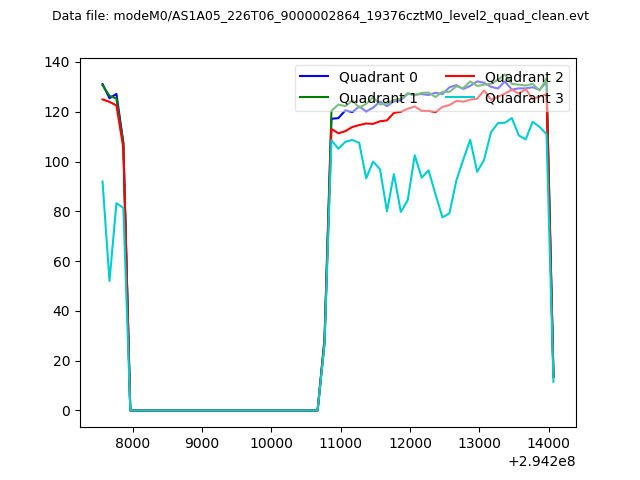
| Filename | modeM0/AS1A05_226T06_9000002864_19376cztM0_level2.evt | modeM0/AS1A05_226T06_9000002864_19376cztM0_level2_quad_clean.evt |
| Size (bytes) | 764,159,040 | 73,296,000 |
| Size | 728.8 MB | 69.9 MB |
| Events in quadrant A | 3,450,808 | 458,312 |
| Events in quadrant B | 3,652,016 | 461,805 |
| Events in quadrant C | 3,499,122 | 440,332 |
| Events in quadrant D | 12,054,182 | 356,865 |
| Mode M0 | |||
|---|---|---|---|
| Quadrant | BADHDUFLAG | Total packets | Discarded packets |
| A | 0 | 14741 | 2 |
| B | 0 | 15211 | 2 |
| C | 0 | 14737 | 2 |
| D | 0 | 40827 | 3 |
| Mode M9 | |||
|---|---|---|---|
| Quadrant | BADHDUFLAG | Total packets | Discarded packets |
| A | 0 | 18 | 0 |
| B | 0 | 18 | 0 |
| C | 0 | 18 | 0 |
| D | 0 | 18 | 0 |
| Mode SS | |||
|---|---|---|---|
| Quadrant | BADHDUFLAG | Total packets | Discarded packets |
| A | 0 | 148 | 0 |
| B | 0 | 148 | 0 |
| C | 0 | 148 | 0 |
| D | 0 | 148 | 0 |
| Quadrant | Total seconds | Saturated seconds | Saturation percentage |
|---|---|---|---|
| A | 7196 | 69 | 0.958866% |
| B | 7197 | 92 | 1.278310% |
| C | 7197 | 91 | 1.264416% |
| D | 7196 | 2703 | 37.562535% |
Noise dominated data is calculated using 1-second bins in cleaned event files. If a bin has >2000 counts, and if more than 50% of those come from <1% of pixels, then it is considered to be noise-dominated and hence unusable.
| Quadrant | # 1 sec bins | Bins with >0 counts | Bins with >2000 counts | High rate bins dominated by noise | Noise dominated (total time) | Noise dominated (detector-on time) | Marked lightcurve |
|---|---|---|---|---|---|---|---|
| A | 8926 | 7196 | 0 | 0 | 0.00% | 0.00% | 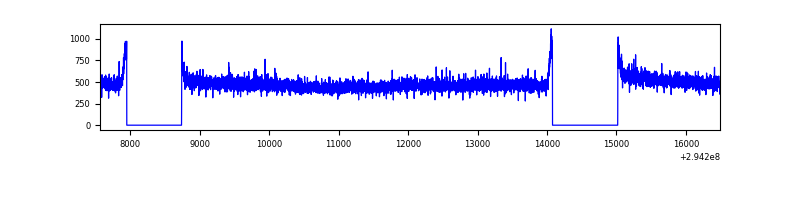 |
| B | 8927 | 7197 | 9 | 9 | 0.10% | 0.13% | 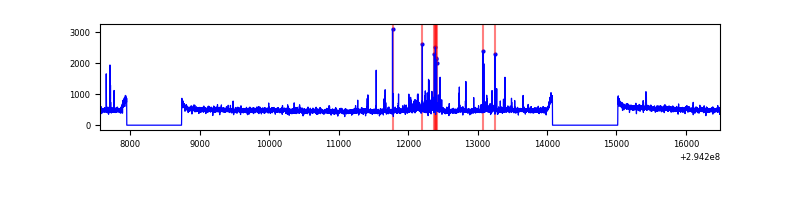 |
| C | 8927 | 7197 | 0 | 0 | 0.00% | 0.00% | 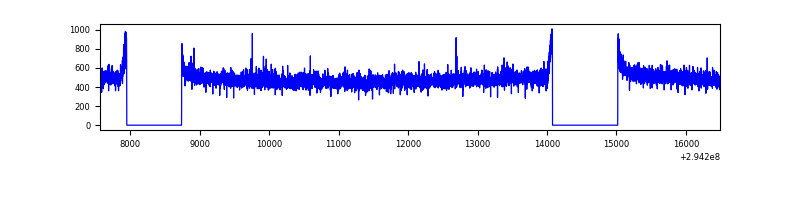 |
| D | 8926 | 7196 | 2351 | 2351 | 26.34% | 32.67% | 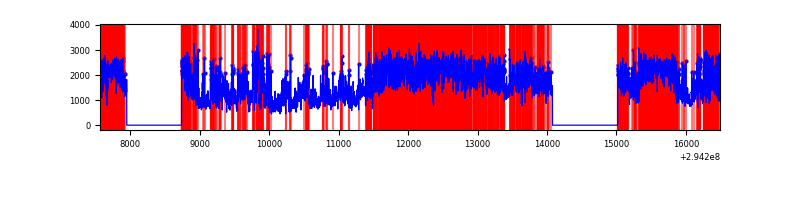 |
Top three noisy pixels from each quadrant. If the there are fewer than three noisy pixels in the level2.evt file, extra rows are filled as -1
| Pixel properties | Quadrant properties | ||||||
|---|---|---|---|---|---|---|---|
| Quadrant | DetID | PixID | Counts | Sigma | Mean | Median | Sigma |
| A | 13 | 254 | 7952 | 39.28 | 893 | 874 | 180.2 |
| A | 0 | 226 | 7628 | 37.48 | 893 | 874 | 180.2 |
| A | 3 | 137 | 7212 | 35.17 | 893 | 874 | 180.2 |
| B | 7 | 220 | 85467 | 493.69 | 889 | 864 | 171.4 |
| B | 0 | 198 | 30082 | 170.5 | 889 | 864 | 171.4 |
| B | 12 | 111 | 20961 | 117.27 | 889 | 864 | 171.4 |
| C | 14 | 238 | 132789 | 657.29 | 850 | 854 | 200.7 |
| C | 7 | 220 | 33710 | 163.69 | 850 | 854 | 200.7 |
| C | 3 | 233 | 17625 | 83.55 | 850 | 854 | 200.7 |
| D | 10 | 66 | 7674207 | 40894.3 | 766 | 744 | 187.6 |
| D | 11 | 176 | 627066 | 3337.87 | 766 | 744 | 187.6 |
| D | 7 | 238 | 599956 | 3193.39 | 766 | 744 | 187.6 |
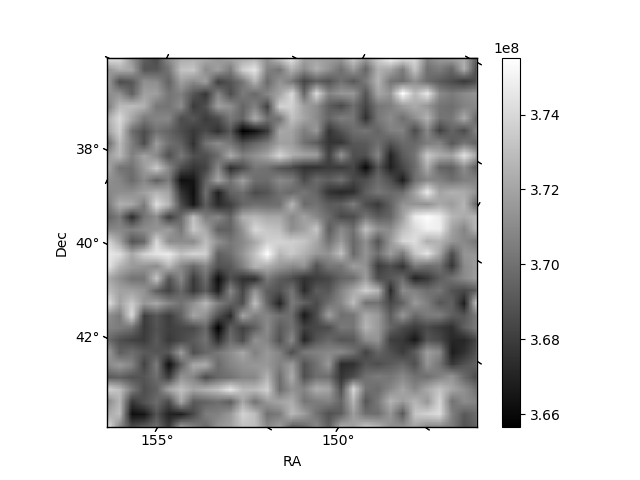
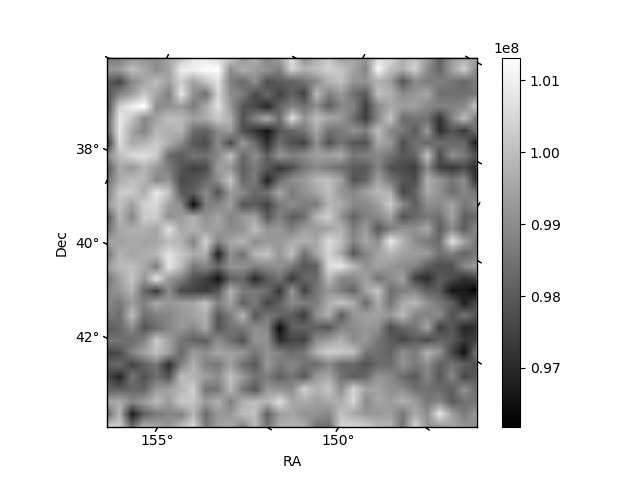
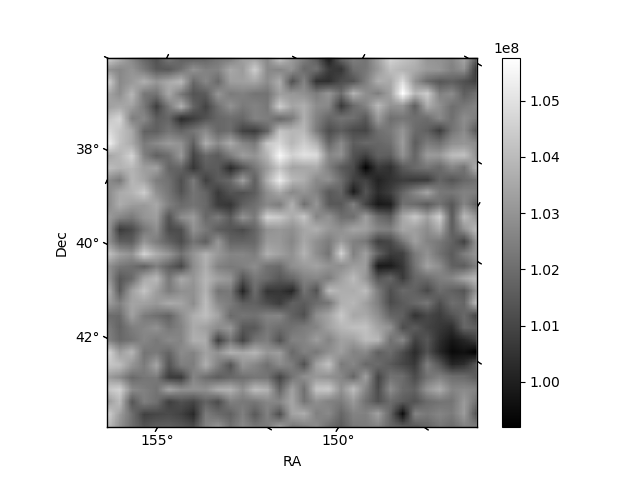
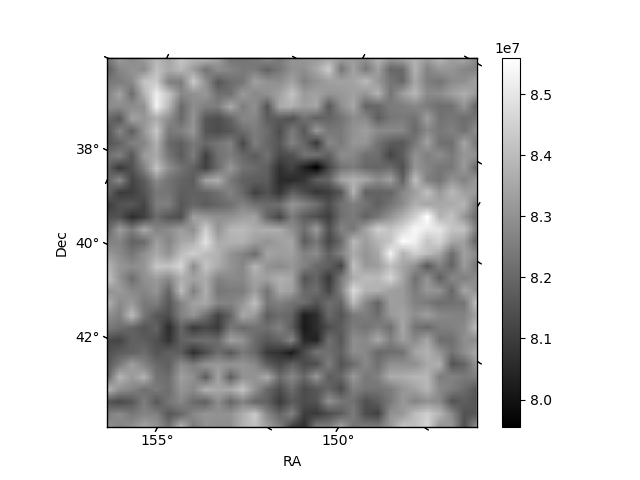
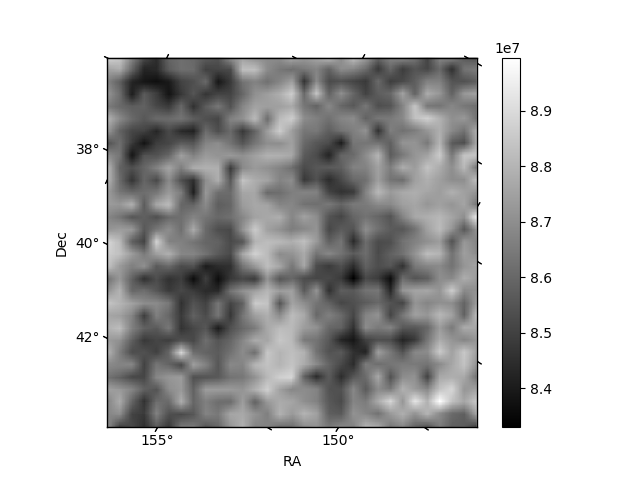
Histogram calculated using DETX and DETY for each event in the final _common_clean file
| Quadrant A | 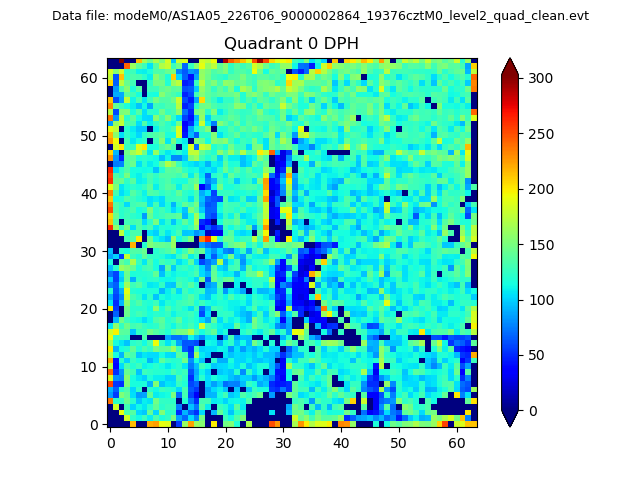 |
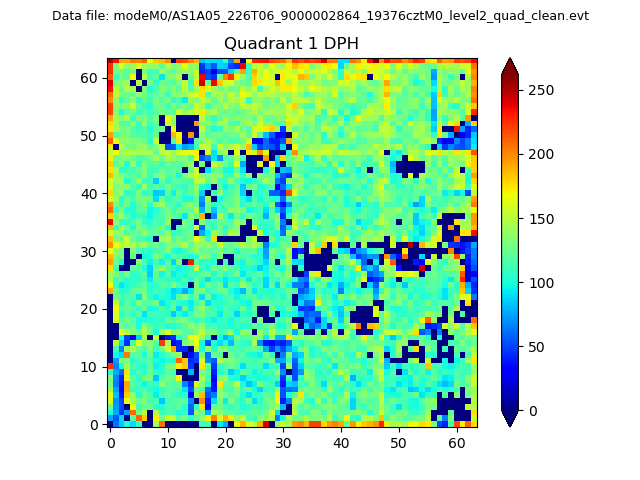 |
Quadrant B |
|---|---|---|---|
| Quadrant D | 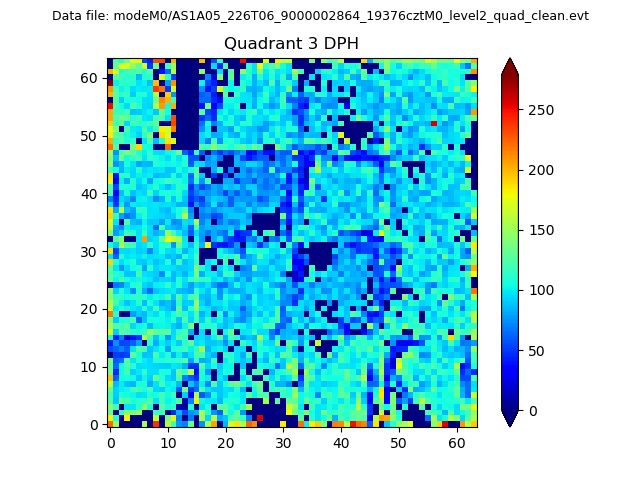 |
 |
Quadrant C |
| Plot type | Count rate plots | Images |
|---|---|---|
| Comparison with Poisson distribution Blue bars denote a histogram of data divided into 1 sec bins. Red curve is a Poisson curve with rate = median count rate of data. |
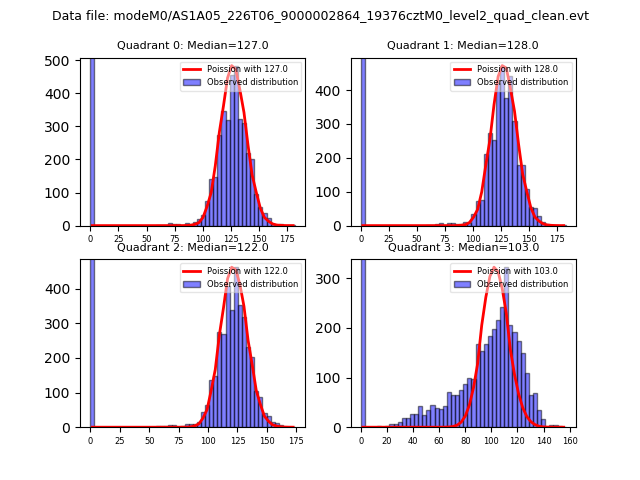 |
 |
| Quadrant-wise count rates Data is divided into 100 sec bins |
 |
|
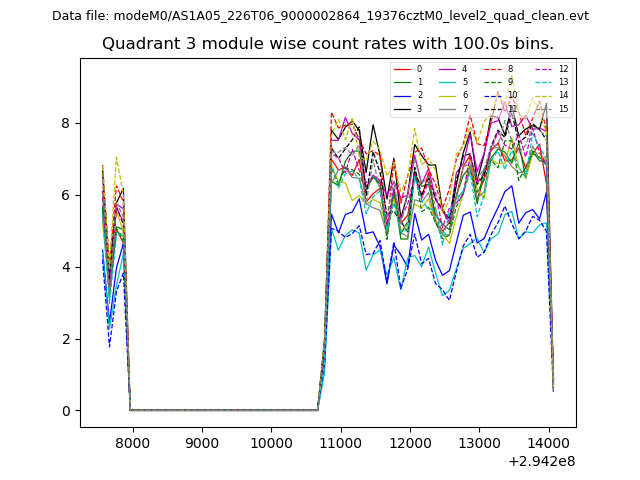
| Module-wise count rates for Quadrant A Data is divided into 100 sec bins |
 |
 |
| Module-wise count rates for Quadrant B Data is divided into 100 sec bins |
 |
 |
| Module-wise count rates for Quadrant C Data is divided into 100 sec bins |
 |
 |
| Module-wise count rates for Quadrant D Data is divided into 100 sec bins |
 |
 |
| Parameter | Plot |
|---|---|
| CZT HV Monitor |  |
| D_VDD | 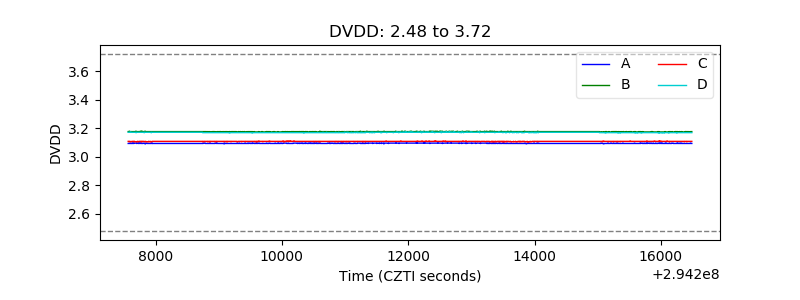 |
| Temperature 1 | 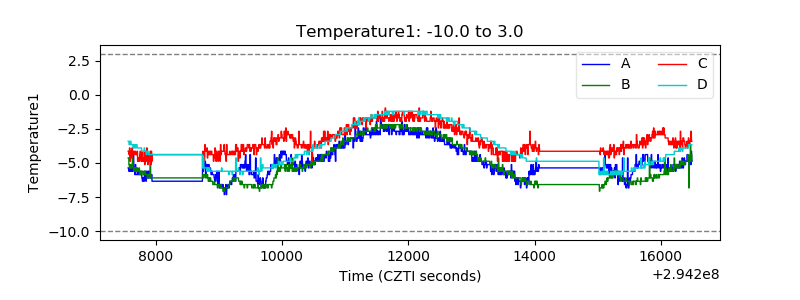 |
| Veto HV Monitor | 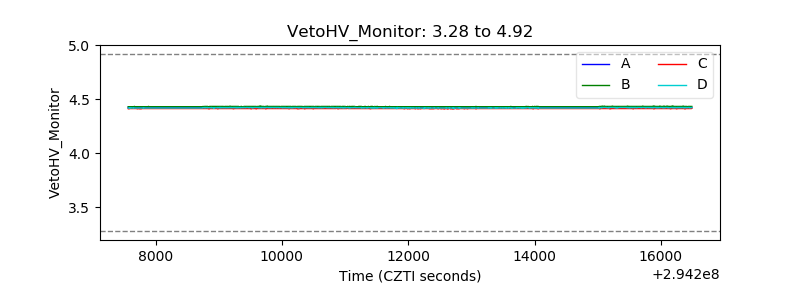 |
| Veto LLD | 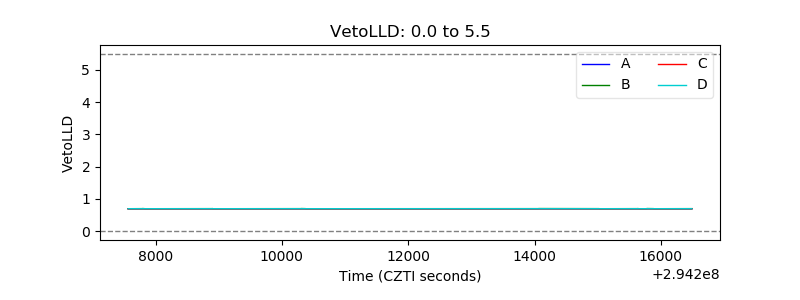 |
| Alpha Counter | 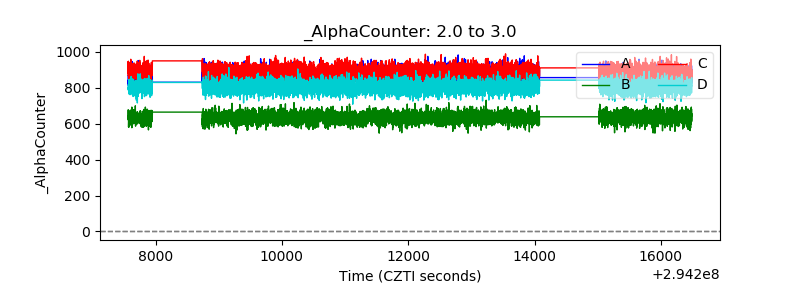 |
| _CPM_Rate | 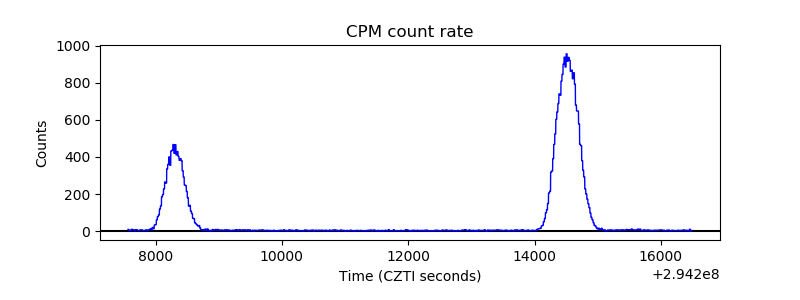 |
| CZT Counter | 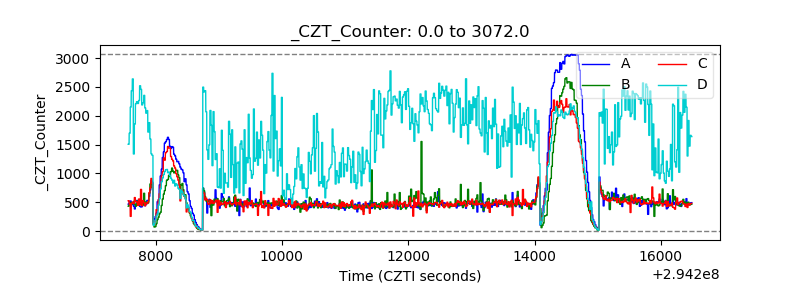 |
| +2.5 Volts monitor |  |
| +5 Volts monitor |  |
| _ROLL_ROT | 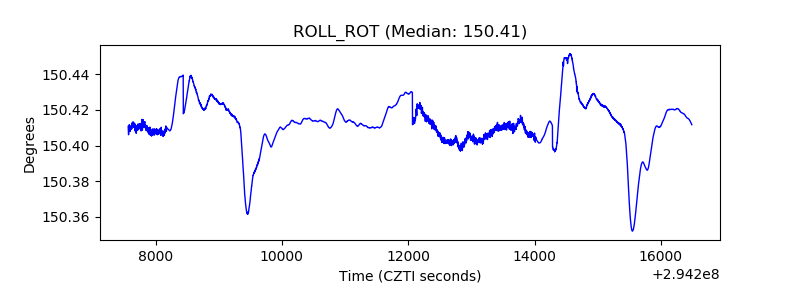 |
| _Roll_DEC | 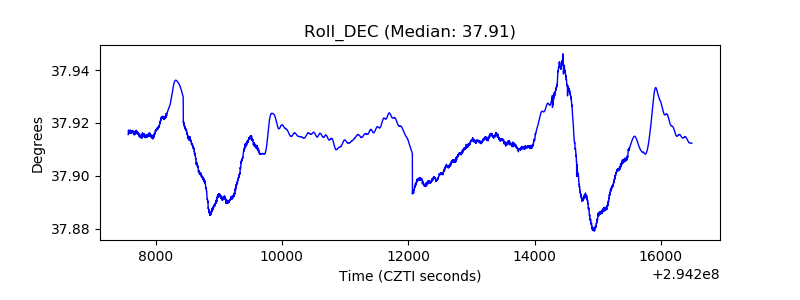 |
| _Roll_RA | 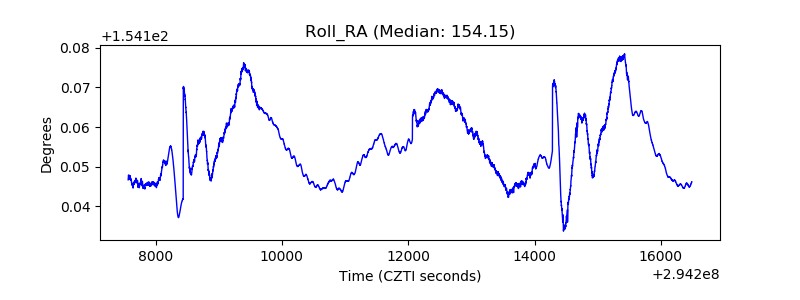 |
| Veto Counter |  |