| Param | Original file | Final file |
|---|---|---|
| Filename | modeM0/AS1A05_226T06_9000002864_19378cztM0_level2.evt | modeM0/AS1A05_226T06_9000002864_19378cztM0_level2_quad_clean.evt |
| Size (bytes) | 422,795,520 | 44,870,400 |
| Size | 403.2 MB | 42.8 MB |
| Events in quadrant A | 1,873,964 | 287,634 |
| Events in quadrant B | 2,031,311 | 287,564 |
| Events in quadrant C | 1,855,705 | 272,352 |
| Events in quadrant D | 6,777,809 | 234,636 |
| Mode M0 | |||
|---|---|---|---|
| Quadrant | BADHDUFLAG | Total packets | Discarded packets |
| A | 0 | 7974 | 1 |
| B | 0 | 8411 | 1 |
| C | 0 | 7949 | 1 |
| D | 0 | 22838 | 1 |
| Mode M9 | |||
|---|---|---|---|
| Quadrant | BADHDUFLAG | Total packets | Discarded packets |
| A | 0 | 3 | 0 |
| B | 0 | 4 | 0 |
| C | 0 | 4 | 0 |
| D | 0 | 4 | 0 |
| Mode SS | |||
|---|---|---|---|
| Quadrant | BADHDUFLAG | Total packets | Discarded packets |
| A | 0 | 78 | 0 |
| B | 0 | 78 | 0 |
| C | 0 | 78 | 0 |
| D | 0 | 78 | 0 |
| Quadrant | Total seconds | Saturated seconds | Saturation percentage |
|---|---|---|---|
| A | 3905 | 17 | 0.435339% |
| B | 3905 | 32 | 0.819462% |
| C | 3905 | 18 | 0.460948% |
| D | 3905 | 1473 | 37.720871% |
Noise dominated data is calculated using 1-second bins in cleaned event files. If a bin has >2000 counts, and if more than 50% of those come from <1% of pixels, then it is considered to be noise-dominated and hence unusable.
| Quadrant | # 1 sec bins | Bins with >0 counts | Bins with >2000 counts | High rate bins dominated by noise | Noise dominated (total time) | Noise dominated (detector-on time) | Marked lightcurve |
|---|---|---|---|---|---|---|---|
| A | 3905 | 3905 | 0 | 0 | 0.00% | 0.00% | 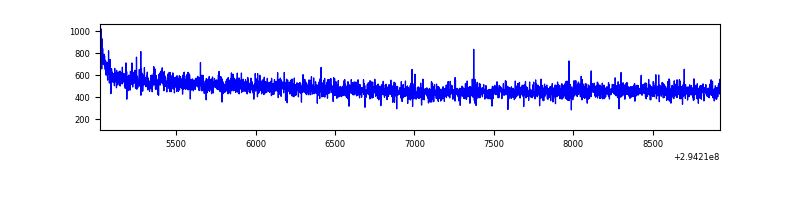 |
| B | 3905 | 3905 | 15 | 15 | 0.38% | 0.38% | 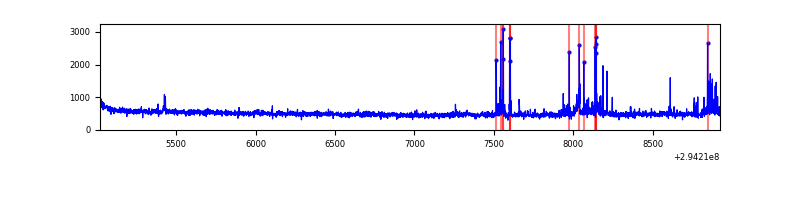 |
| C | 3905 | 3905 | 0 | 0 | 0.00% | 0.00% | 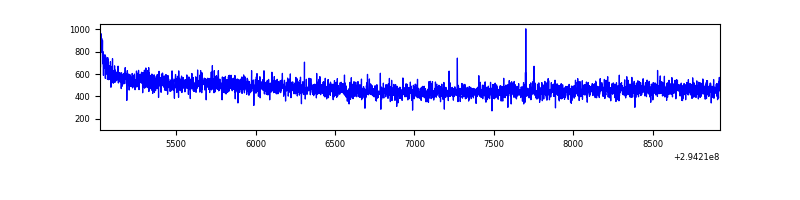 |
| D | 3904 | 3904 | 1361 | 1361 | 34.86% | 34.86% | 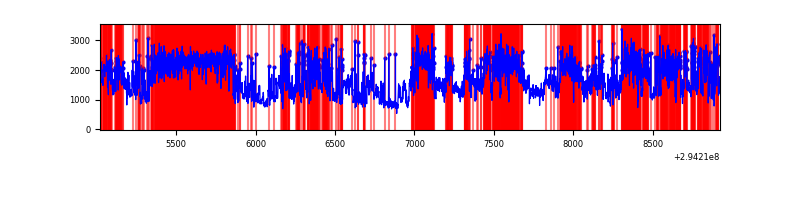 |
Top three noisy pixels from each quadrant. If the there are fewer than three noisy pixels in the level2.evt file, extra rows are filled as -1
| Pixel properties | Quadrant properties | ||||||
|---|---|---|---|---|---|---|---|
| Quadrant | DetID | PixID | Counts | Sigma | Mean | Median | Sigma |
| A | 0 | 226 | 4143 | 37.02 | 486 | 476 | 99.1 |
| A | 3 | 137 | 3781 | 33.36 | 486 | 476 | 99.1 |
| A | 12 | 194 | 3538 | 30.91 | 486 | 476 | 99.1 |
| B | 7 | 220 | 75526 | 810.39 | 480 | 469 | 92.6 |
| B | 3 | 64 | 15718 | 164.64 | 480 | 469 | 92.6 |
| B | 15 | 32 | 15133 | 158.33 | 480 | 469 | 92.6 |
| C | 14 | 238 | 71319 | 659.5 | 455 | 458 | 107.4 |
| C | 3 | 233 | 8800 | 77.64 | 455 | 458 | 107.4 |
| C | 13 | 61 | 3167 | 25.21 | 455 | 458 | 107.4 |
| D | 10 | 66 | 4754919 | 46917.74 | 417 | 406 | 101.3 |
| D | 11 | 176 | 182885 | 1800.71 | 417 | 406 | 101.3 |
| D | 7 | 238 | 118472 | 1165.08 | 417 | 406 | 101.3 |
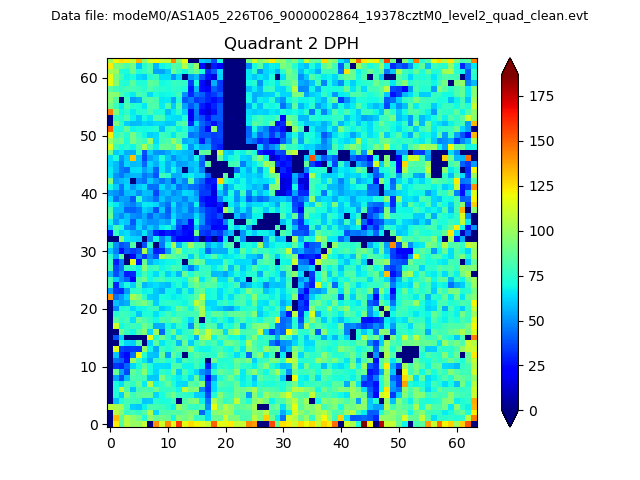
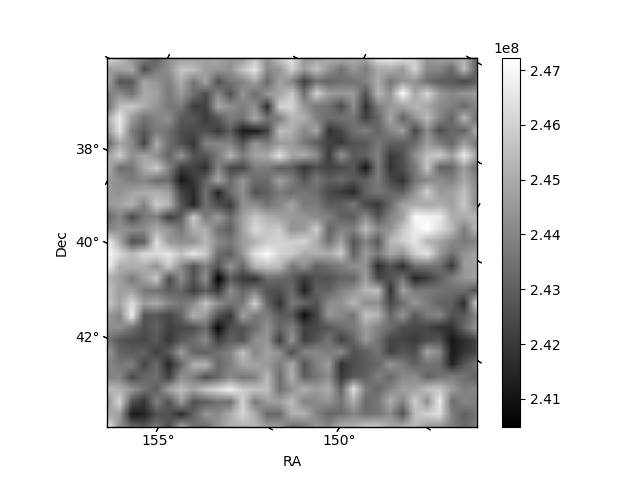
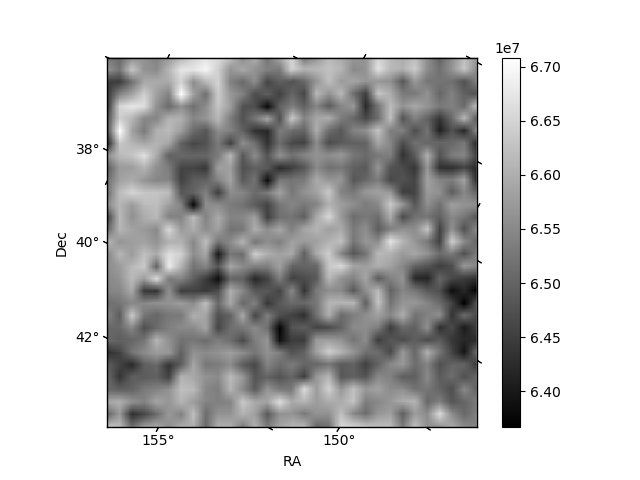
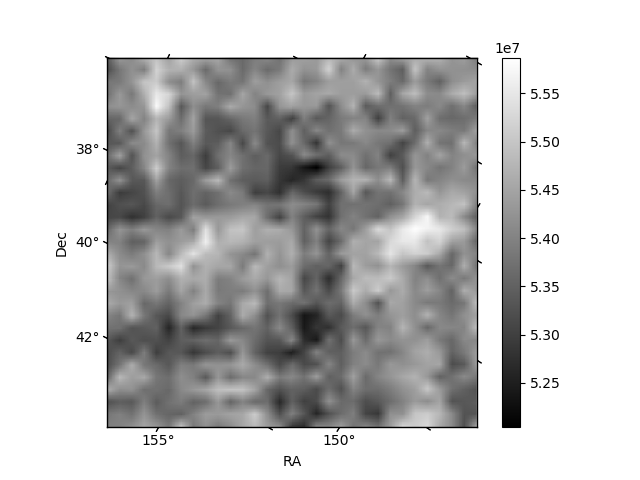
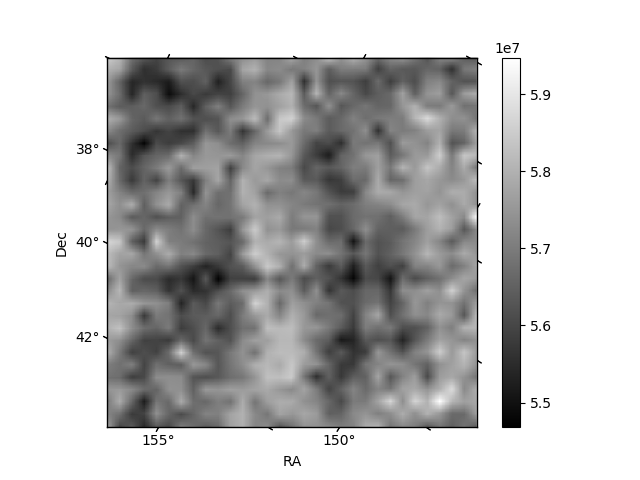
Histogram calculated using DETX and DETY for each event in the final _common_clean file
| Quadrant A | 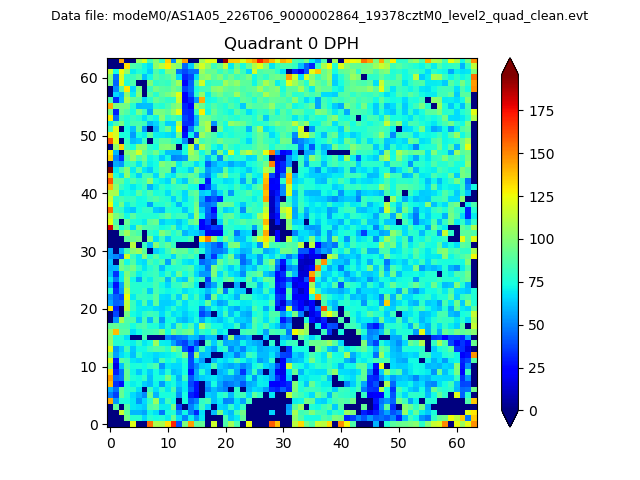 |
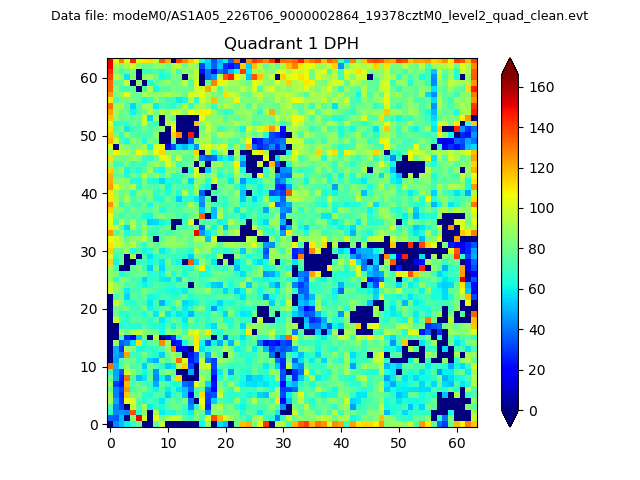 |
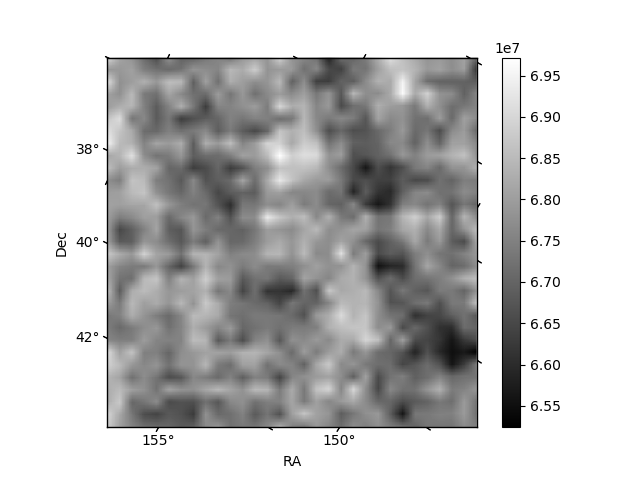
Quadrant B |
|---|---|---|---|
| Quadrant D | 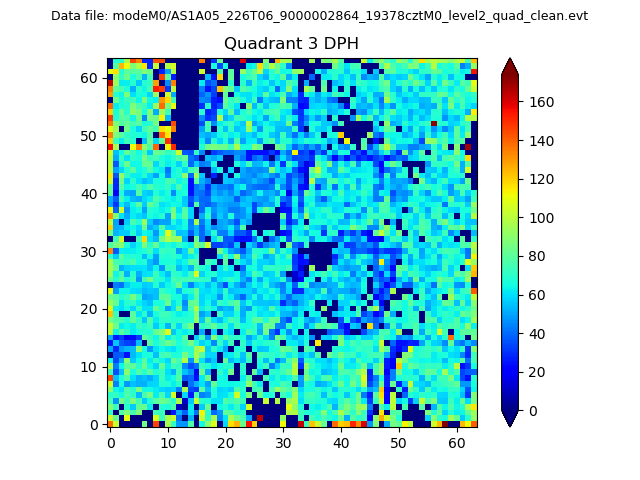 |
 |
Quadrant C |
| Plot type | Count rate plots | Images |
|---|---|---|
| Comparison with Poisson distribution Blue bars denote a histogram of data divided into 1 sec bins. Red curve is a Poisson curve with rate = median count rate of data. |
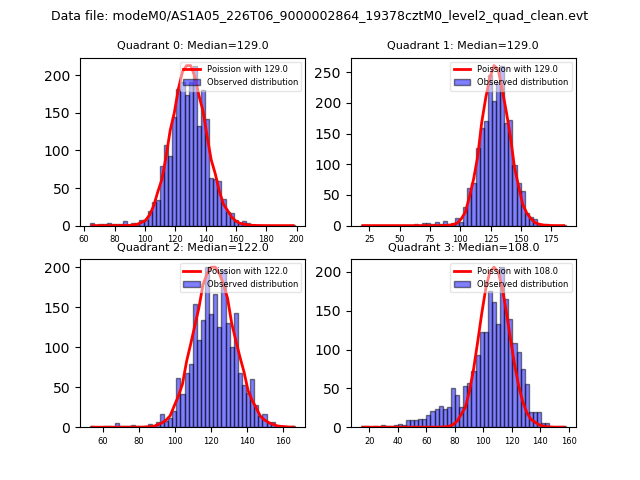 |
 |
| Quadrant-wise count rates Data is divided into 100 sec bins |
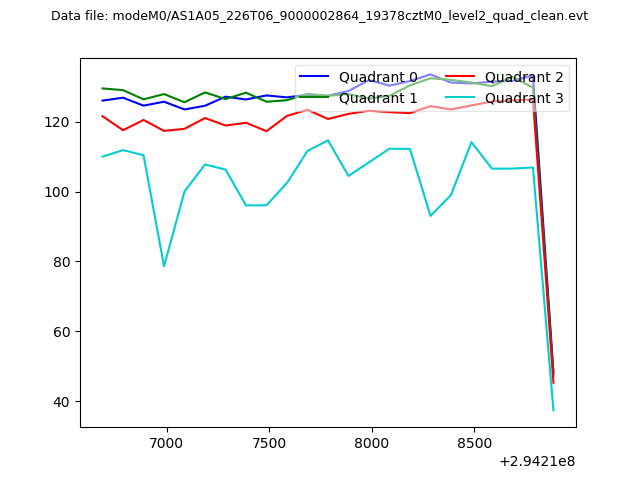 |
|
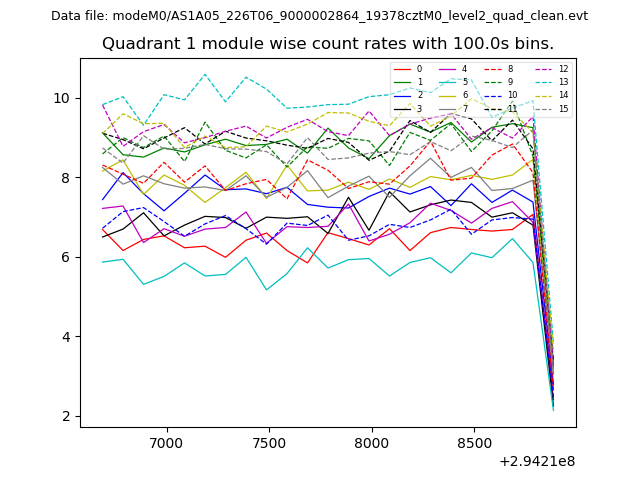
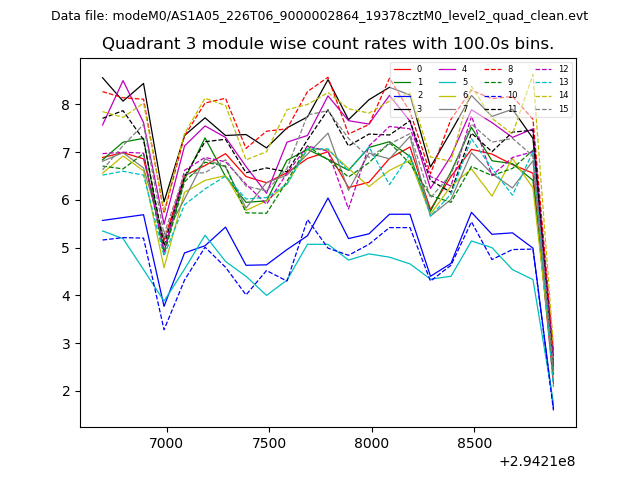
| Module-wise count rates for Quadrant A Data is divided into 100 sec bins |
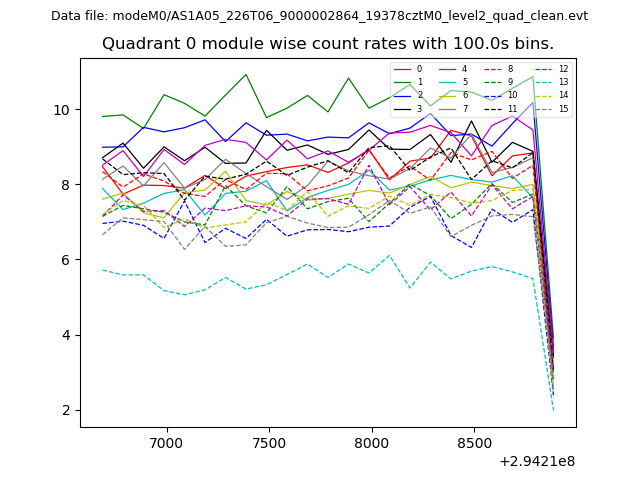 |
 |
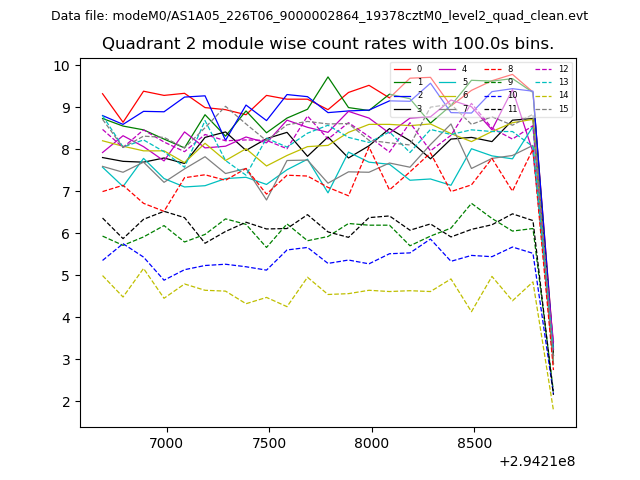
| Module-wise count rates for Quadrant B Data is divided into 100 sec bins |
 |
 |
| Module-wise count rates for Quadrant C Data is divided into 100 sec bins |
 |
 |
| Module-wise count rates for Quadrant D Data is divided into 100 sec bins |
 |
 |
| Parameter | Plot |
|---|---|
| CZT HV Monitor | 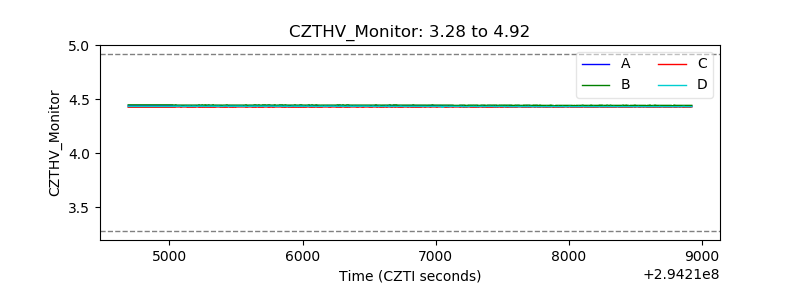 |
| D_VDD | 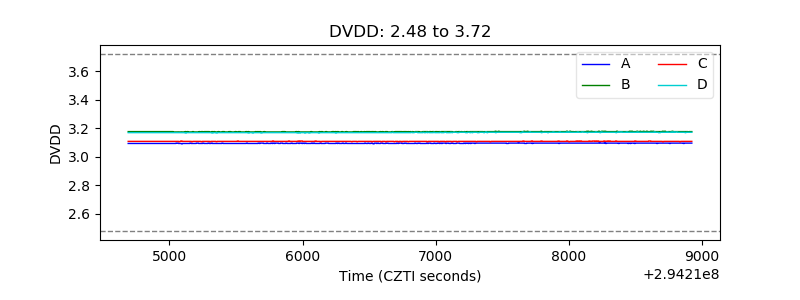 |
| Temperature 1 | 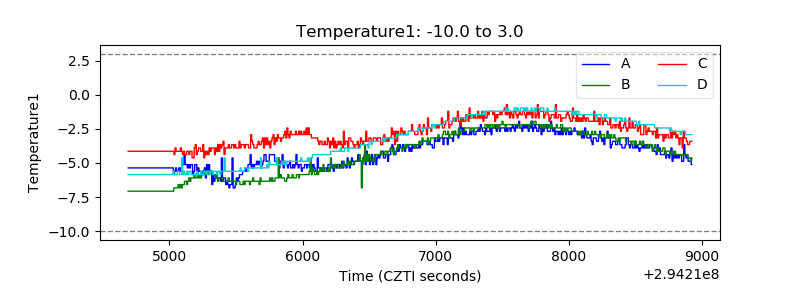 |
| Veto HV Monitor | 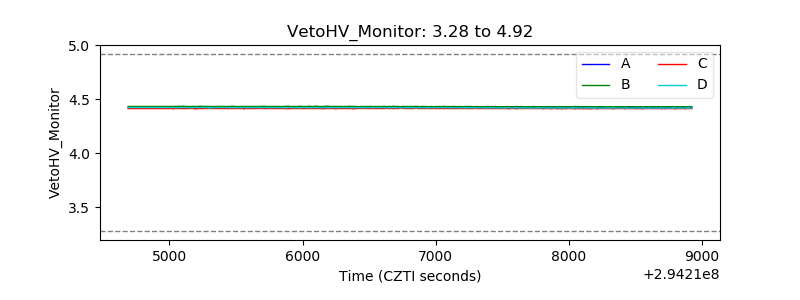 |
| Veto LLD | 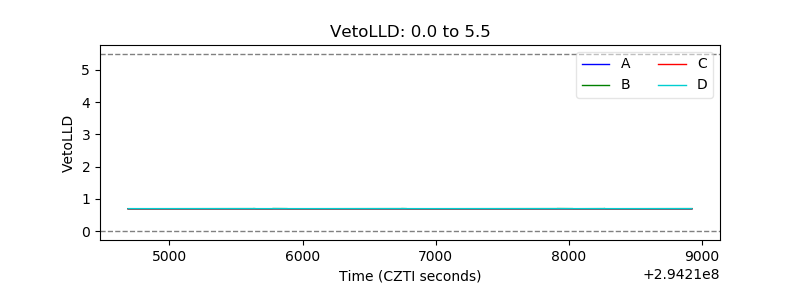 |
| Alpha Counter |  |
| _CPM_Rate | 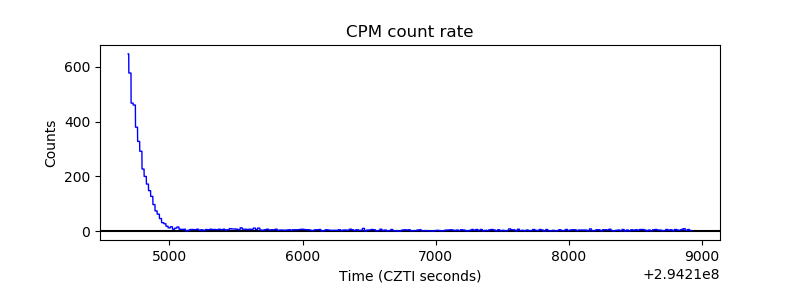 |
| CZT Counter | 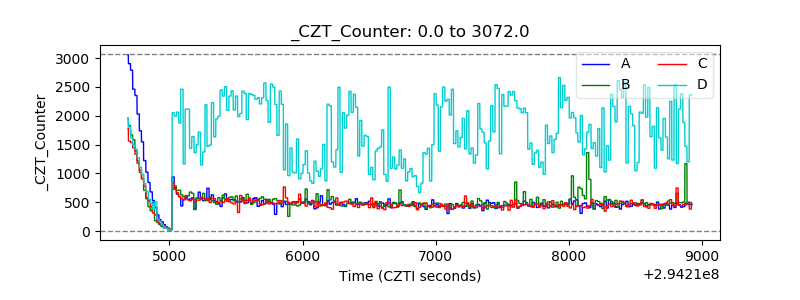 |
| +2.5 Volts monitor | 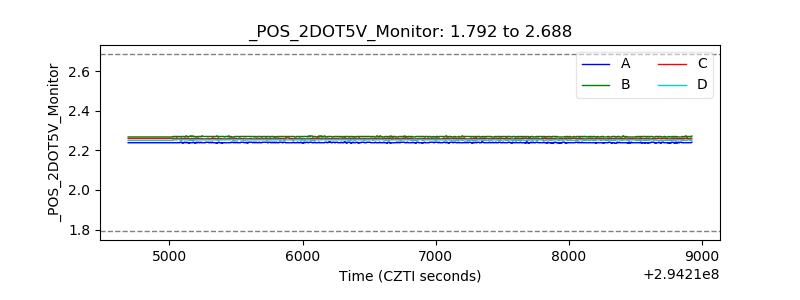 |
| +5 Volts monitor |  |
| _ROLL_ROT | 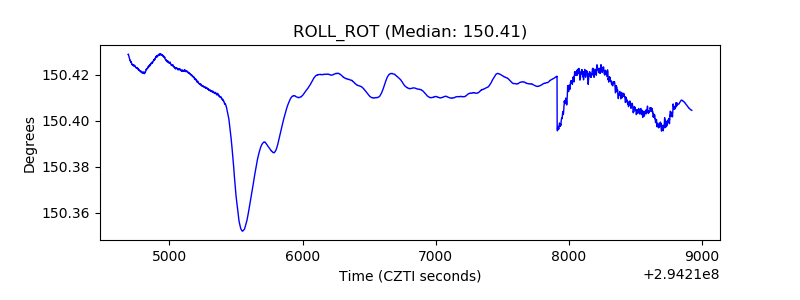 |
| _Roll_DEC | 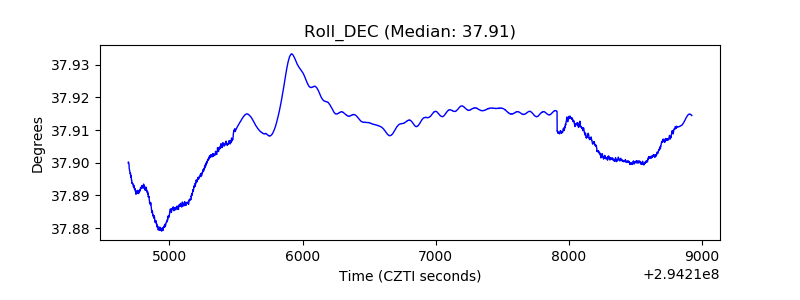 |
| _Roll_RA | 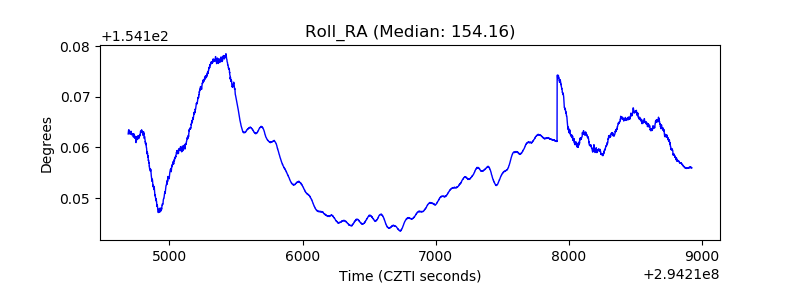 |
| Veto Counter | 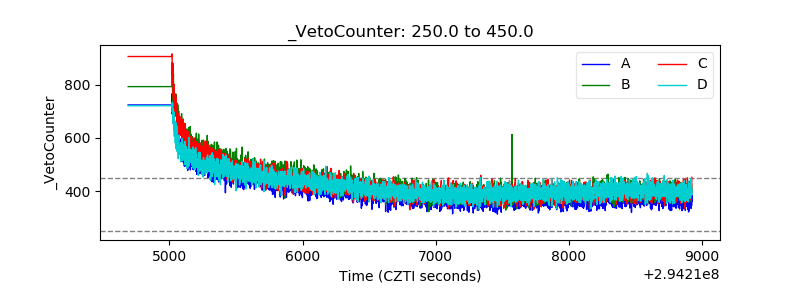 |