| Param | Original file | Final file |
|---|---|---|
| Filename | modeM0/AS1A05_227T03_9000002862_19369cztM0_level2.evt | modeM0/AS1A05_227T03_9000002862_19369cztM0_level2_quad_clean.evt |
| Size (bytes) | 254,727,360 | 35,429,760 |
| Size | 242.9 MB | 33.8 MB |
| Events in quadrant A | 1,305,526 | 232,822 |
| Events in quadrant B | 1,453,085 | 236,573 |
| Events in quadrant C | 1,327,732 | 225,840 |
| Events in quadrant D | 3,452,839 | 193,730 |
| Mode M0 | |||
|---|---|---|---|
| Quadrant | BADHDUFLAG | Total packets | Discarded packets |
| A | 0 | 5412 | 1 |
| B | 0 | 5849 | 1 |
| C | 0 | 5527 | 1 |
| D | 0 | 12068 | 3 |
| Mode M9 | |||
|---|---|---|---|
| Quadrant | BADHDUFLAG | Total packets | Discarded packets |
| A | 0 | 10 | 0 |
| B | 0 | 10 | 0 |
| C | 0 | 10 | 0 |
| D | 0 | 10 | 0 |
| Mode SS | |||
|---|---|---|---|
| Quadrant | BADHDUFLAG | Total packets | Discarded packets |
| A | 0 | 52 | 0 |
| B | 0 | 52 | 0 |
| C | 0 | 52 | 0 |
| D | 0 | 52 | 0 |
| Quadrant | Total seconds | Saturated seconds | Saturation percentage |
|---|---|---|---|
| A | 2560 | 37 | 1.445312% |
| B | 2560 | 71 | 2.773438% |
| C | 2560 | 56 | 2.187500% |
| D | 2559 | 732 | 28.604924% |
Noise dominated data is calculated using 1-second bins in cleaned event files. If a bin has >2000 counts, and if more than 50% of those come from <1% of pixels, then it is considered to be noise-dominated and hence unusable.
| Quadrant | # 1 sec bins | Bins with >0 counts | Bins with >2000 counts | High rate bins dominated by noise | Noise dominated (total time) | Noise dominated (detector-on time) | Marked lightcurve |
|---|---|---|---|---|---|---|---|
| A | 3575 | 2560 | 0 | 0 | 0.00% | 0.00% | 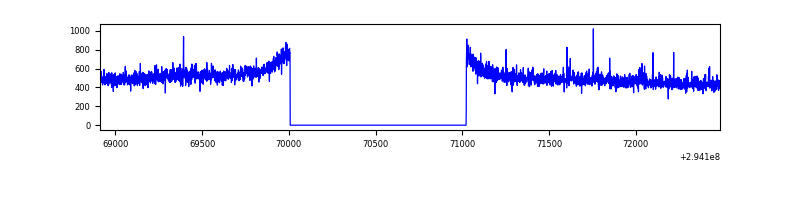 |
| B | 3575 | 2561 | 14 | 14 | 0.39% | 0.55% | 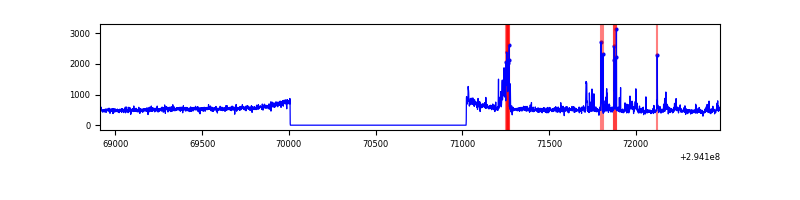 |
| C | 3575 | 2560 | 0 | 0 | 0.00% | 0.00% | 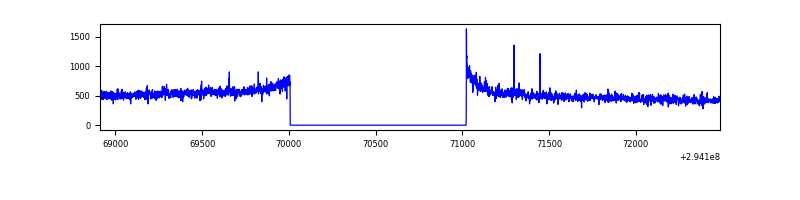 |
| D | 3574 | 2559 | 258 | 258 | 7.22% | 10.08% | 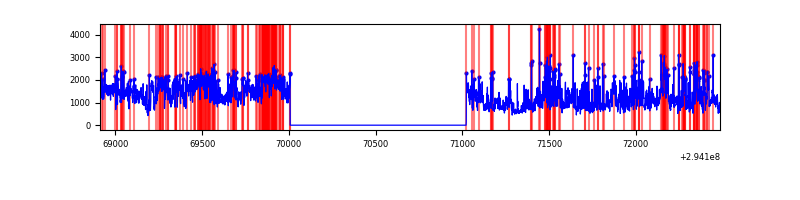 |
Top three noisy pixels from each quadrant. If the there are fewer than three noisy pixels in the level2.evt file, extra rows are filled as -1
| Pixel properties | Quadrant properties | ||||||
|---|---|---|---|---|---|---|---|
| Quadrant | DetID | PixID | Counts | Sigma | Mean | Median | Sigma |
| A | 5 | 16 | 4080 | 53.9 | 337 | 329 | 69.6 |
| A | 0 | 226 | 2933 | 37.42 | 337 | 329 | 69.6 |
| A | 3 | 137 | 2579 | 32.33 | 337 | 329 | 69.6 |
| B | 6 | 36 | 48432 | 728.56 | 335 | 326 | 66.0 |
| B | 4 | 216 | 36200 | 543.31 | 335 | 326 | 66.0 |
| B | 15 | 32 | 21254 | 316.95 | 335 | 326 | 66.0 |
| C | 14 | 238 | 49867 | 655.91 | 319 | 321 | 75.5 |
| C | 3 | 233 | 29915 | 391.78 | 319 | 321 | 75.5 |
| C | 13 | 61 | 2230 | 25.27 | 319 | 321 | 75.5 |
| D | 10 | 66 | 1297120 | 18145.0 | 289 | 281 | 71.5 |
| D | 1 | 52 | 489760 | 6848.65 | 289 | 281 | 71.5 |
| D | 7 | 238 | 375212 | 5245.93 | 289 | 281 | 71.5 |
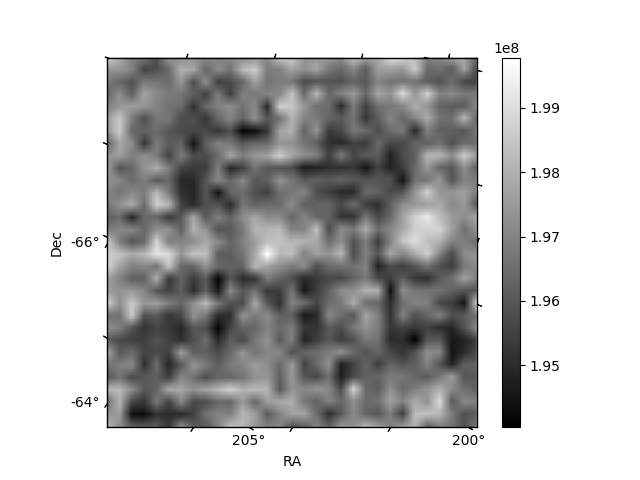
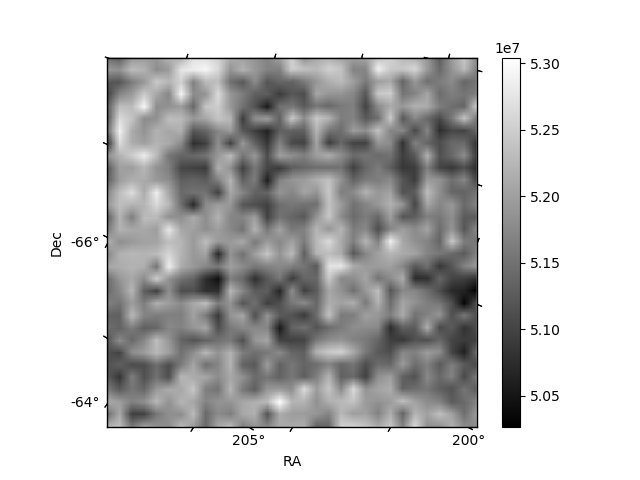
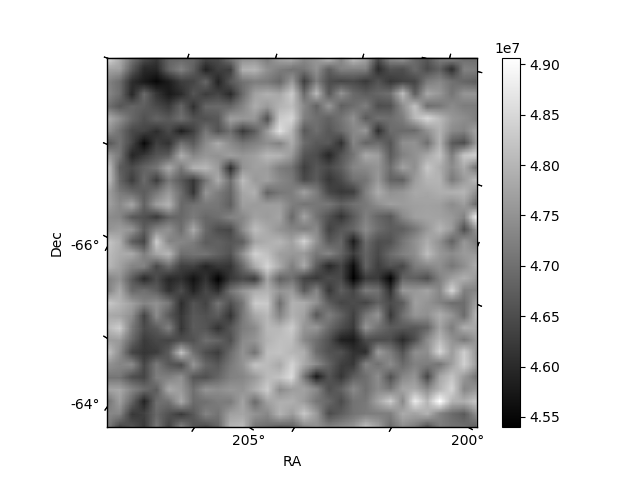
Histogram calculated using DETX and DETY for each event in the final _common_clean file
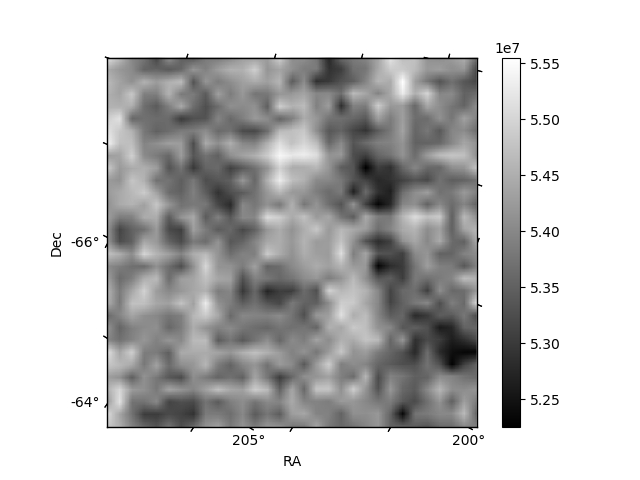
| Quadrant A | 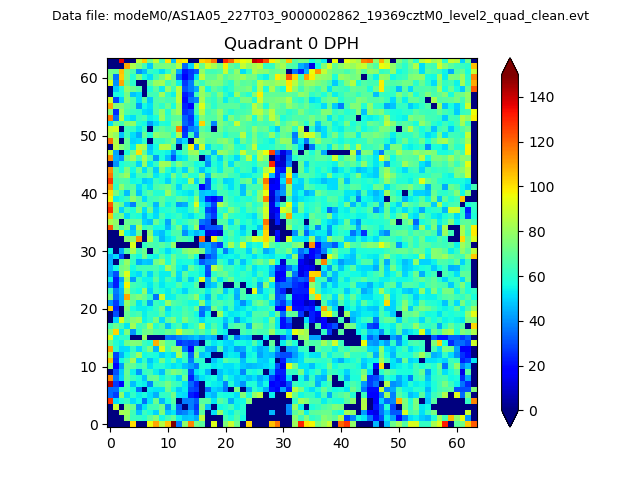 |
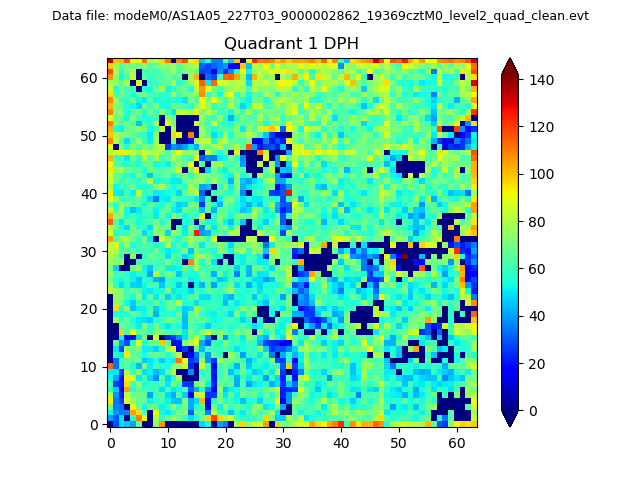 |
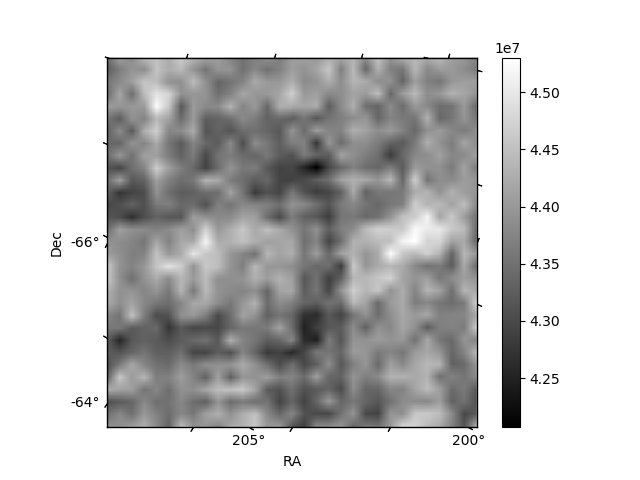
Quadrant B |
|---|---|---|---|
| Quadrant D | 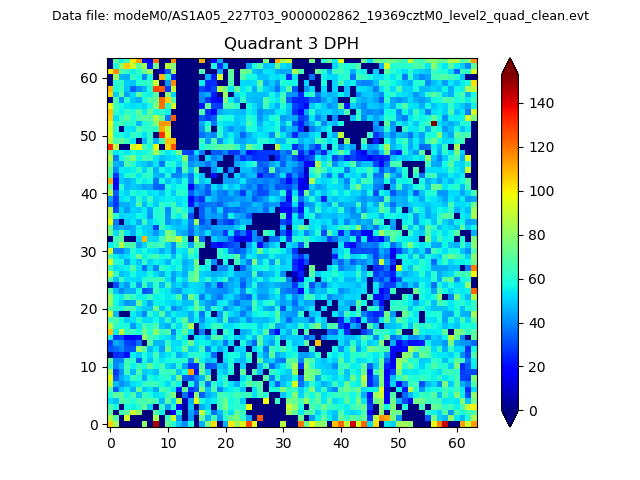 |
 |
Quadrant C |
| Plot type | Count rate plots | Images |
|---|---|---|
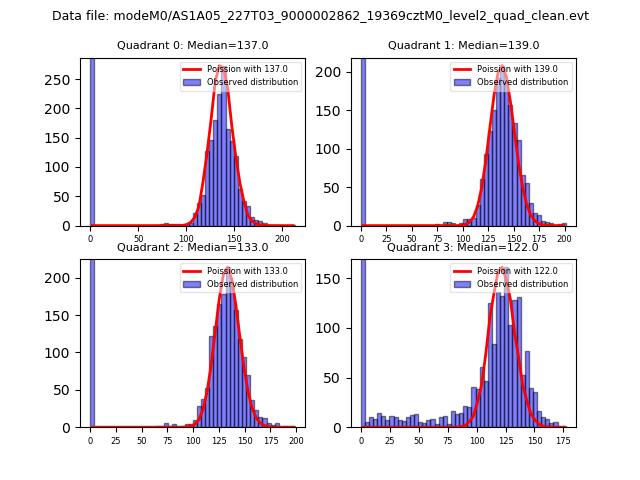
| Comparison with Poisson distribution Blue bars denote a histogram of data divided into 1 sec bins. Red curve is a Poisson curve with rate = median count rate of data. |
 |
 |
| Quadrant-wise count rates Data is divided into 100 sec bins |
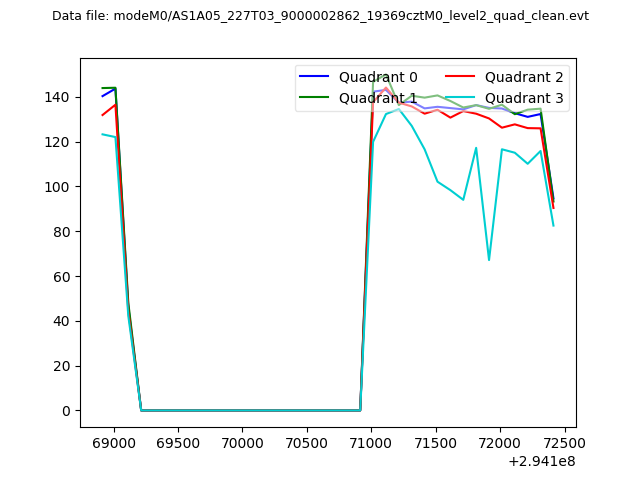 |
|
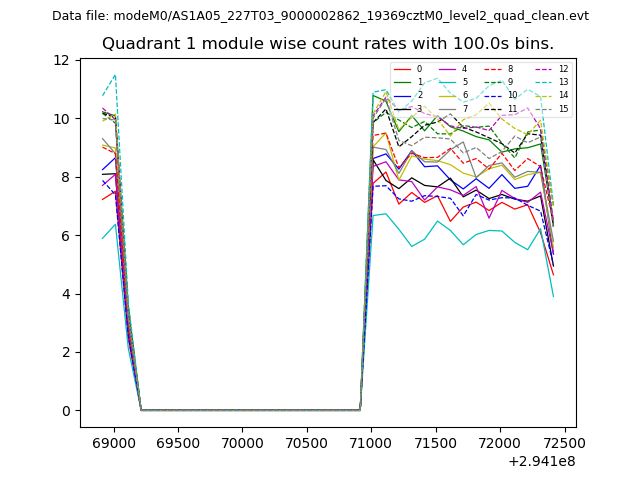
| Module-wise count rates for Quadrant A Data is divided into 100 sec bins |
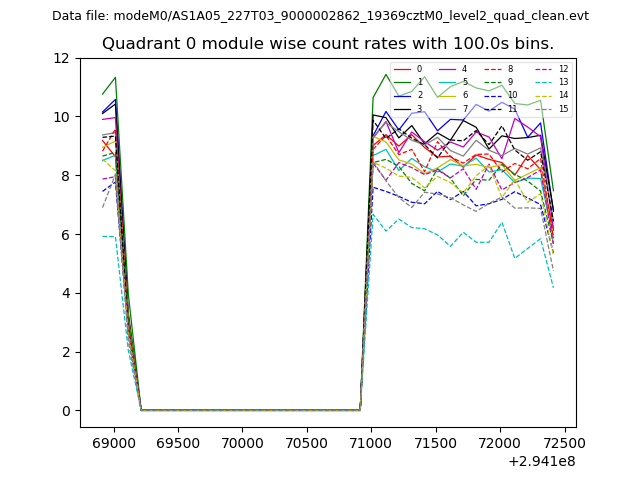 |
 |
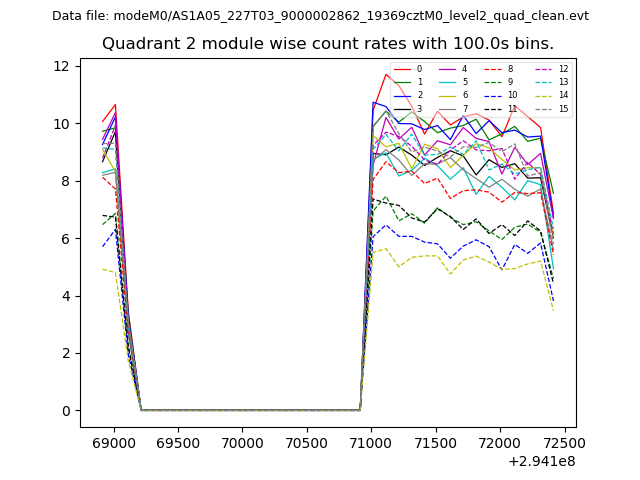
| Module-wise count rates for Quadrant B Data is divided into 100 sec bins |
 |
 |
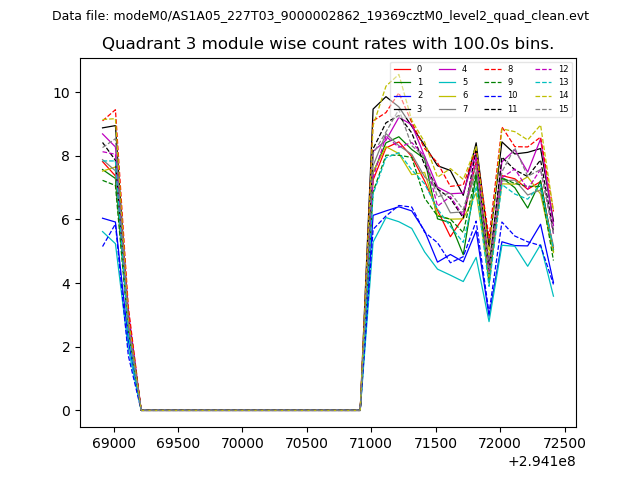
| Module-wise count rates for Quadrant C Data is divided into 100 sec bins |
 |
 |
| Module-wise count rates for Quadrant D Data is divided into 100 sec bins |
 |
 |
| Parameter | Plot |
|---|---|
| CZT HV Monitor | 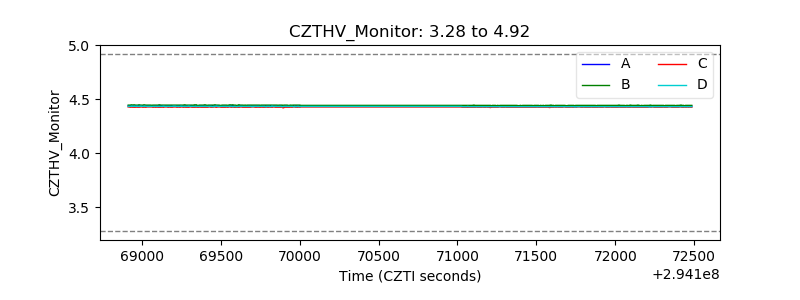 |
| D_VDD | 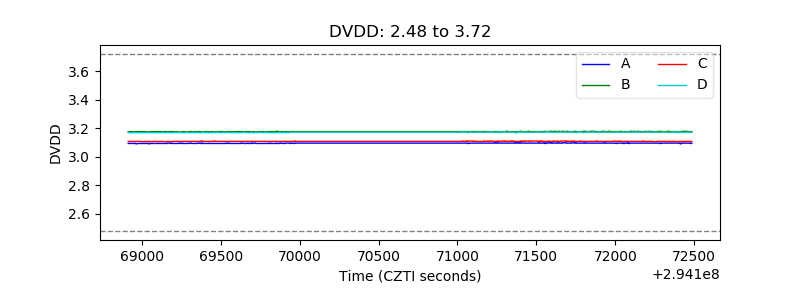 |
| Temperature 1 | 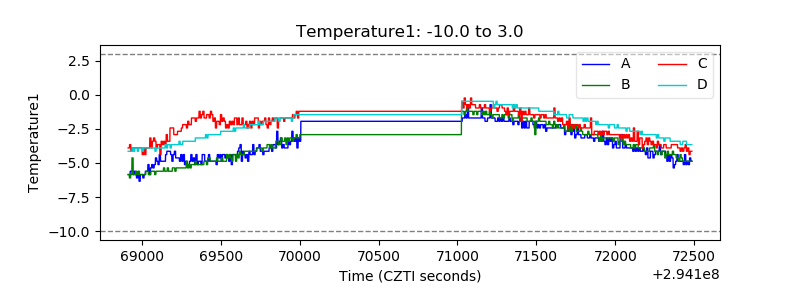 |
| Veto HV Monitor | 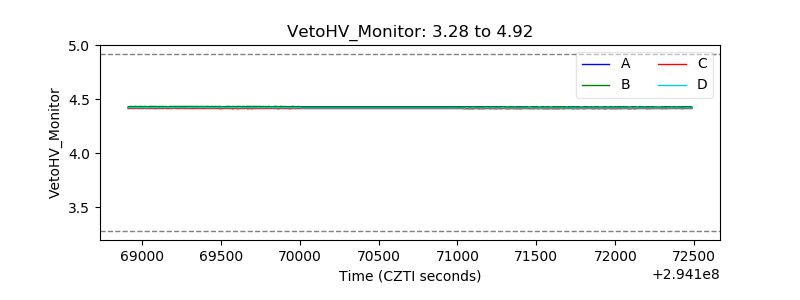 |
| Veto LLD | 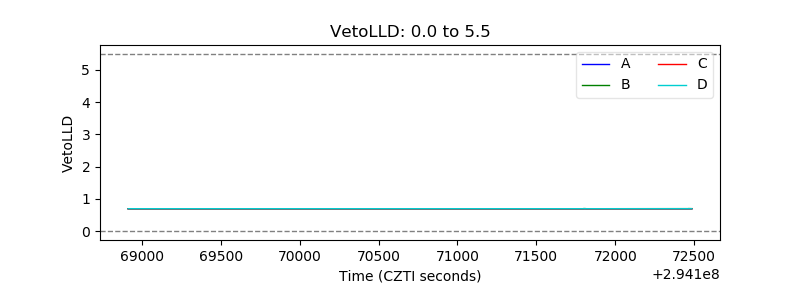 |
| Alpha Counter | 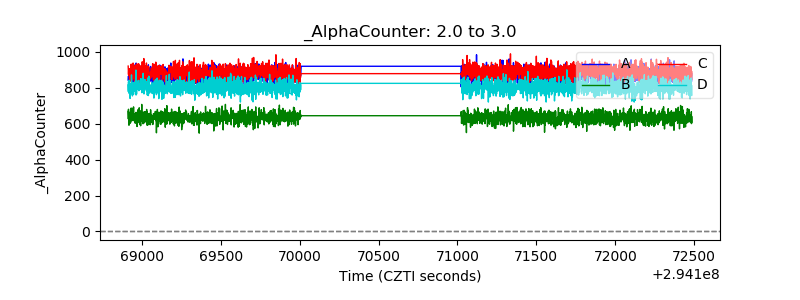 |
| _CPM_Rate | 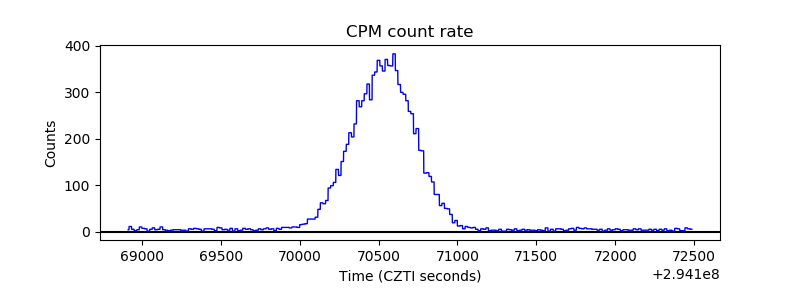 |
| CZT Counter | 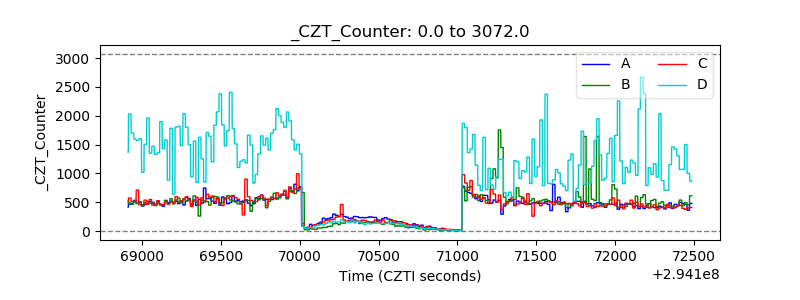 |
| +2.5 Volts monitor |  |
| +5 Volts monitor |  |
| _ROLL_ROT | 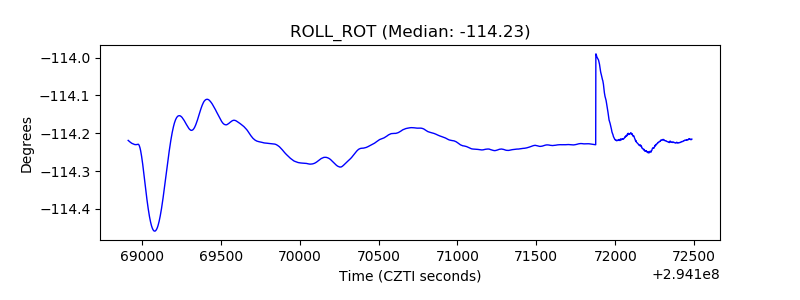 |
| _Roll_DEC | 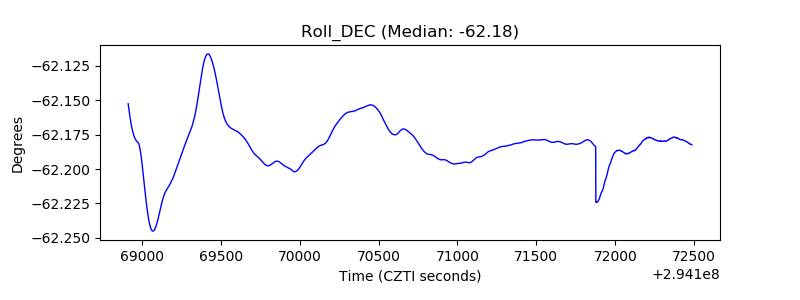 |
| _Roll_RA | 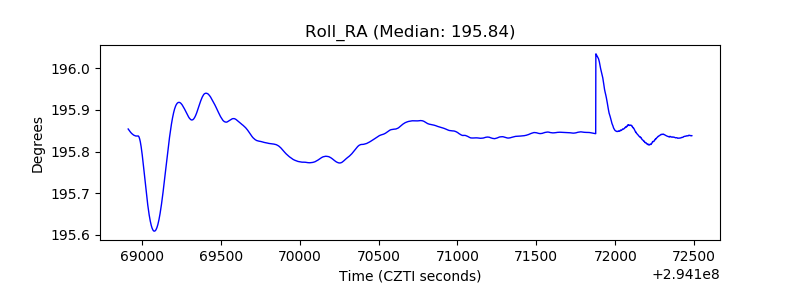 |
| Veto Counter | 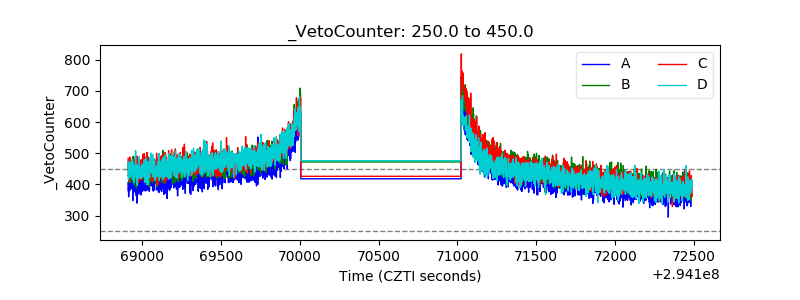 |