| Param | Original file | Final file |
|---|---|---|
| Filename | modeM0/AS1A05_227T03_9000002862_19370cztM0_level2.evt | modeM0/AS1A05_227T03_9000002862_19370cztM0_level2_quad_clean.evt |
| Size (bytes) | 306,864,000 | 68,875,200 |
| Size | 292.6 MB | 65.7 MB |
| Events in quadrant A | 1,607,217 | 478,810 |
| Events in quadrant B | 1,781,790 | 483,268 |
| Events in quadrant C | 1,625,904 | 455,562 |
| Events in quadrant D | 4,030,453 | 410,855 |
| Mode M0 | |||
|---|---|---|---|
| Quadrant | BADHDUFLAG | Total packets | Discarded packets |
| A | 0 | 7391 | 1 |
| B | 0 | 7826 | 1 |
| C | 0 | 7430 | 1 |
| D | 0 | 14532 | 1 |
| Mode M9 | |||
|---|---|---|---|
| Quadrant | BADHDUFLAG | Total packets | Discarded packets |
| A | 0 | 5 | 0 |
| B | 0 | 6 | 0 |
| C | 0 | 6 | 0 |
| D | 0 | 6 | 0 |
| Mode SS | |||
|---|---|---|---|
| Quadrant | BADHDUFLAG | Total packets | Discarded packets |
| A | 0 | 72 | 0 |
| B | 0 | 72 | 0 |
| C | 0 | 72 | 0 |
| D | 0 | 72 | 0 |
| Quadrant | Total seconds | Saturated seconds | Saturation percentage |
|---|---|---|---|
| A | 3635 | 10 | 0.275103% |
| B | 3635 | 39 | 1.072902% |
| C | 3635 | 31 | 0.852820% |
| D | 3635 | 456 | 12.544704% |
Noise dominated data is calculated using 1-second bins in cleaned event files. If a bin has >2000 counts, and if more than 50% of those come from <1% of pixels, then it is considered to be noise-dominated and hence unusable.
| Quadrant | # 1 sec bins | Bins with >0 counts | Bins with >2000 counts | High rate bins dominated by noise | Noise dominated (total time) | Noise dominated (detector-on time) | Marked lightcurve |
|---|---|---|---|---|---|---|---|
| A | 3635 | 3635 | 0 | 0 | 0.00% | 0.00% | 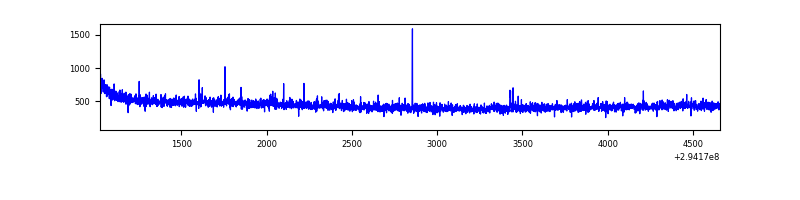 |
| B | 3635 | 3635 | 14 | 14 | 0.39% | 0.39% | 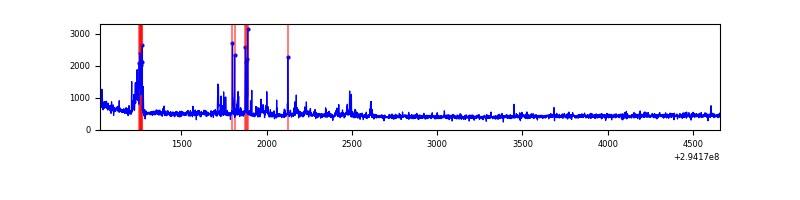 |
| C | 3635 | 3635 | 0 | 0 | 0.00% | 0.00% | 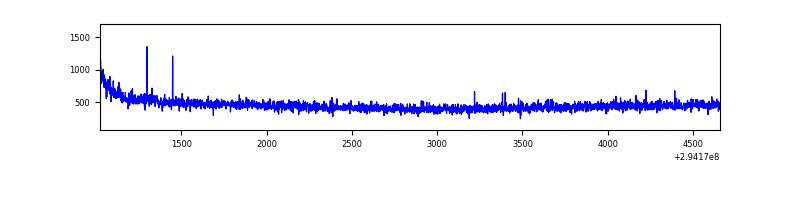 |
| D | 3635 | 3635 | 284 | 284 | 7.81% | 7.81% | 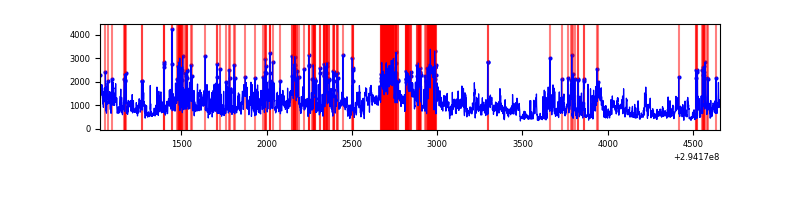 |
Top three noisy pixels from each quadrant. If the there are fewer than three noisy pixels in the level2.evt file, extra rows are filled as -1
| Pixel properties | Quadrant properties | ||||||
|---|---|---|---|---|---|---|---|
| Quadrant | DetID | PixID | Counts | Sigma | Mean | Median | Sigma |
| A | 5 | 16 | 4215 | 44.93 | 414 | 406 | 84.8 |
| A | 13 | 254 | 4106 | 43.65 | 414 | 406 | 84.8 |
| A | 4 | 2 | 3525 | 36.79 | 414 | 406 | 84.8 |
| B | 6 | 36 | 49267 | 607.46 | 416 | 407 | 80.4 |
| B | 4 | 216 | 36712 | 451.37 | 416 | 407 | 80.4 |
| B | 15 | 32 | 21697 | 264.69 | 416 | 407 | 80.4 |
| C | 14 | 238 | 62258 | 676.73 | 392 | 396 | 91.4 |
| C | 3 | 233 | 29300 | 316.19 | 392 | 396 | 91.4 |
| C | 13 | 61 | 2827 | 26.59 | 392 | 396 | 91.4 |
| D | 10 | 66 | 1316744 | 14421.15 | 371 | 361 | 91.3 |
| D | 7 | 238 | 677961 | 7423.2 | 371 | 361 | 91.3 |
| D | 1 | 52 | 415518 | 4548.1 | 371 | 361 | 91.3 |
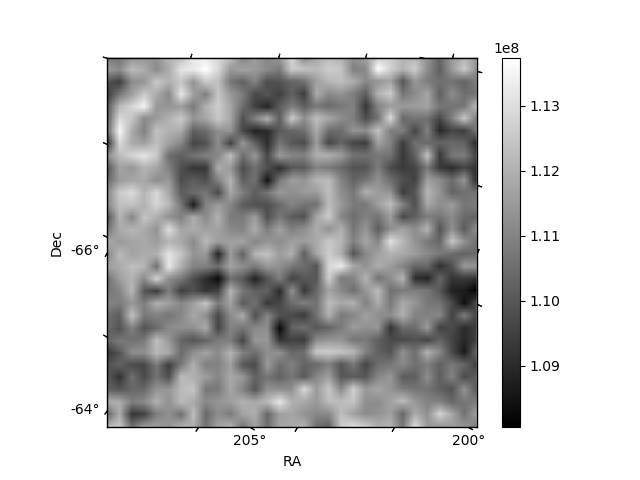
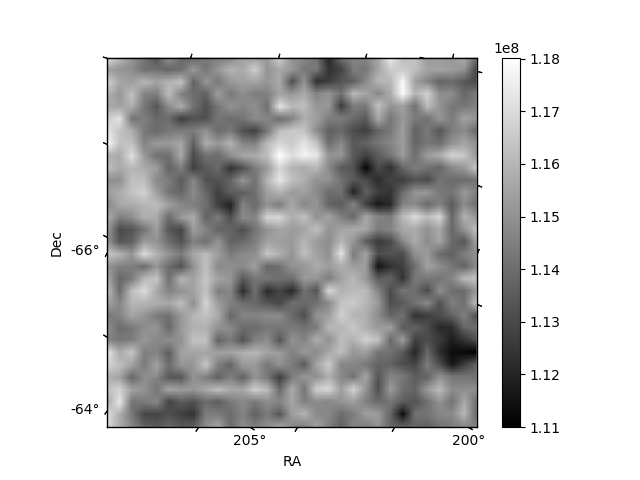
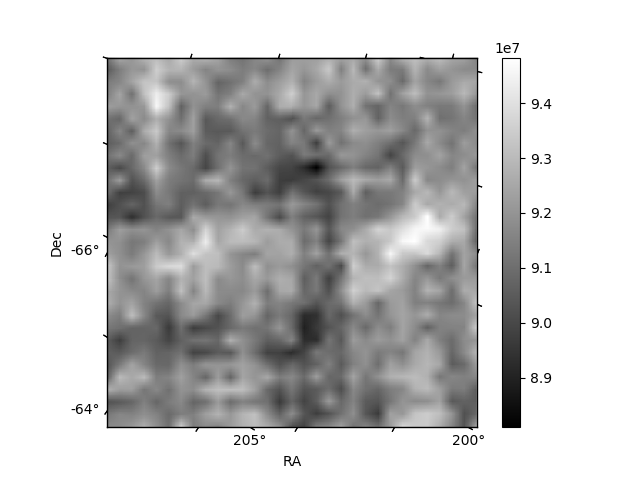
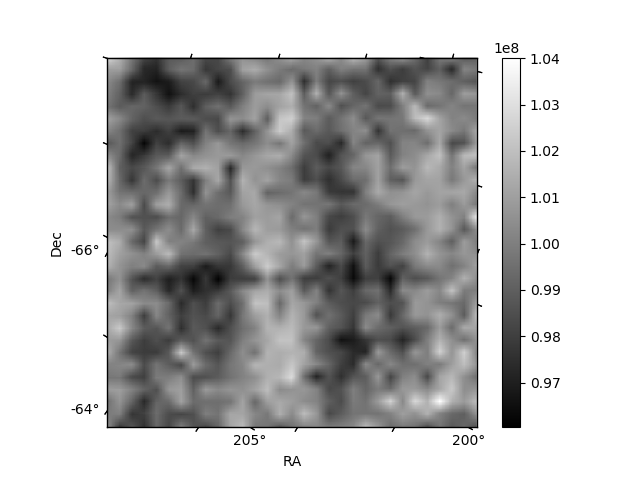
Histogram calculated using DETX and DETY for each event in the final _common_clean file
| Quadrant A | 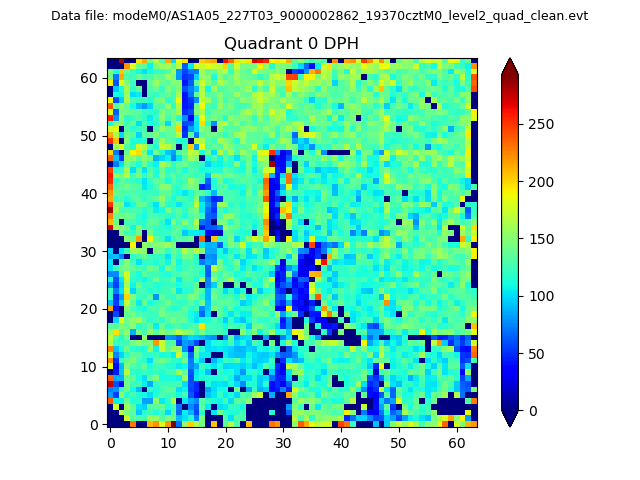 |
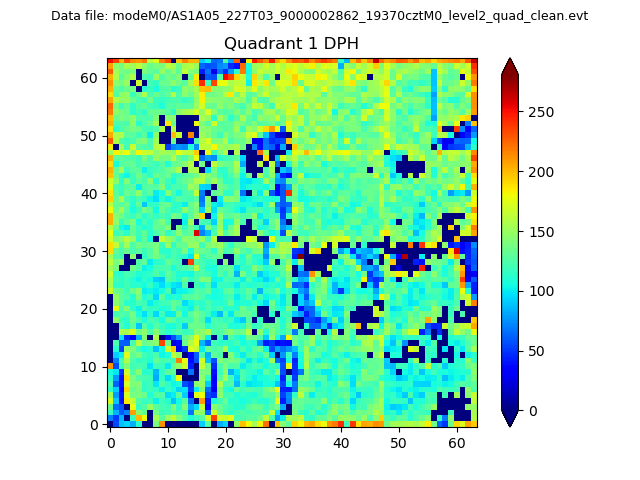 |
Quadrant B |
|---|---|---|---|
| Quadrant D | 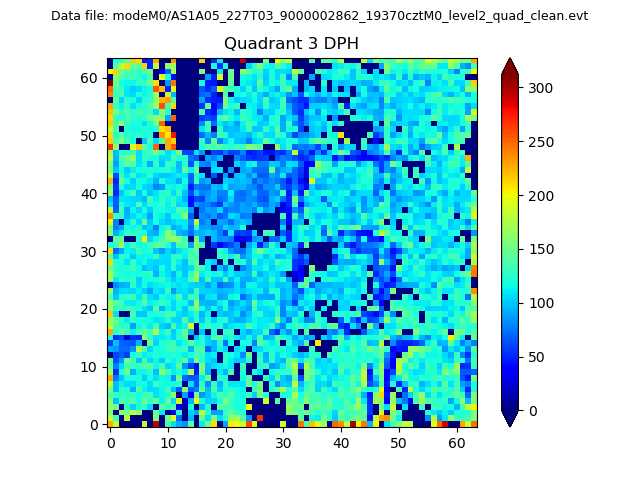 |
 |
Quadrant C |
| Plot type | Count rate plots | Images |
|---|---|---|
| Comparison with Poisson distribution Blue bars denote a histogram of data divided into 1 sec bins. Red curve is a Poisson curve with rate = median count rate of data. |
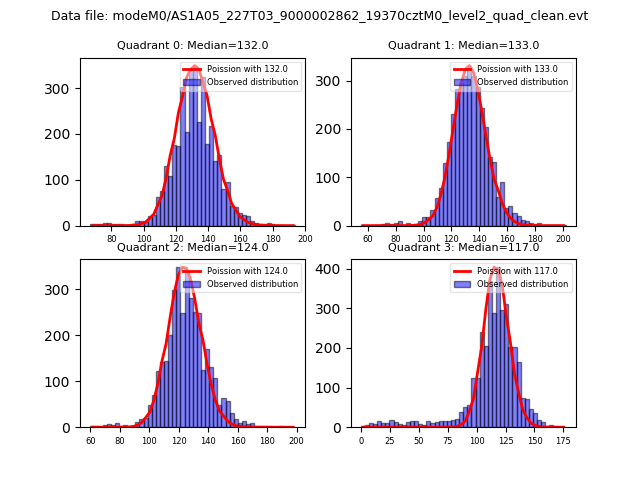 |
 |
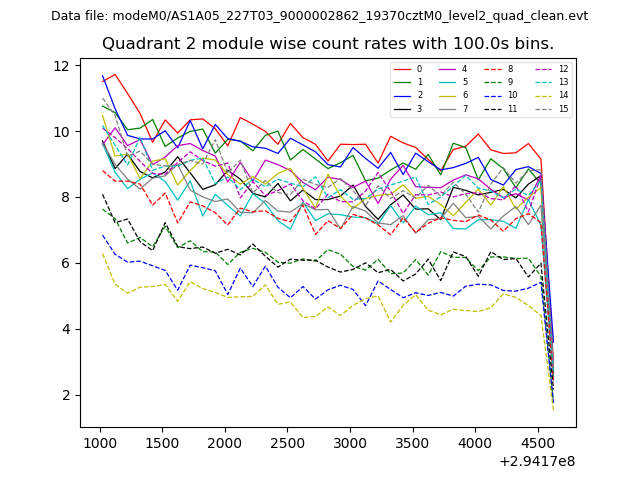
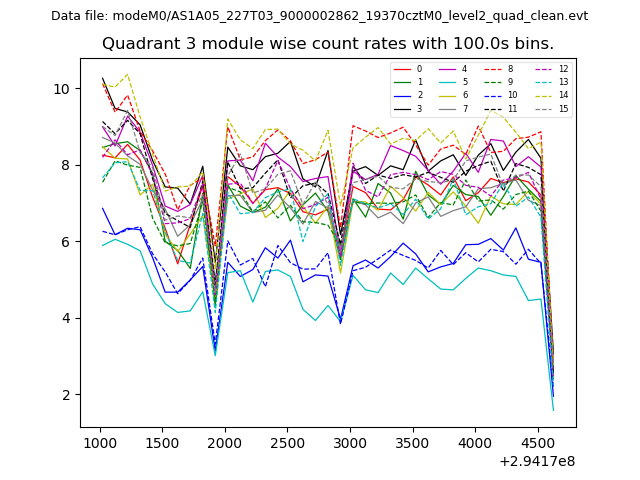
| Quadrant-wise count rates Data is divided into 100 sec bins |
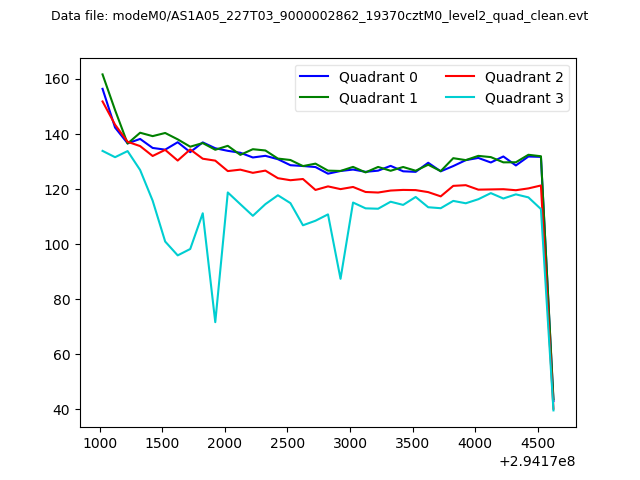 |
|
| Module-wise count rates for Quadrant A Data is divided into 100 sec bins |
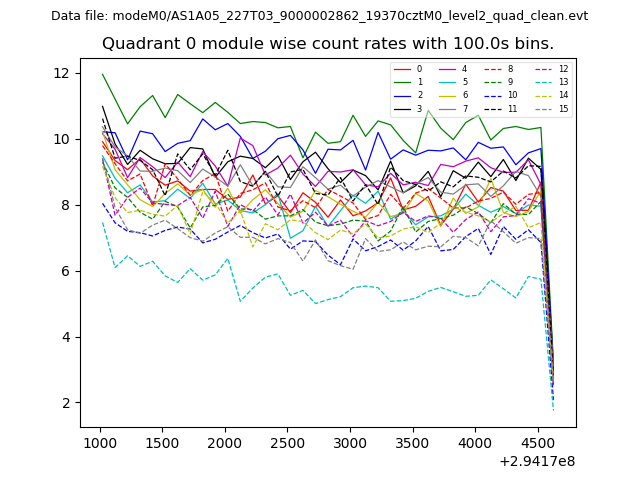 |
 |
| Module-wise count rates for Quadrant B Data is divided into 100 sec bins |
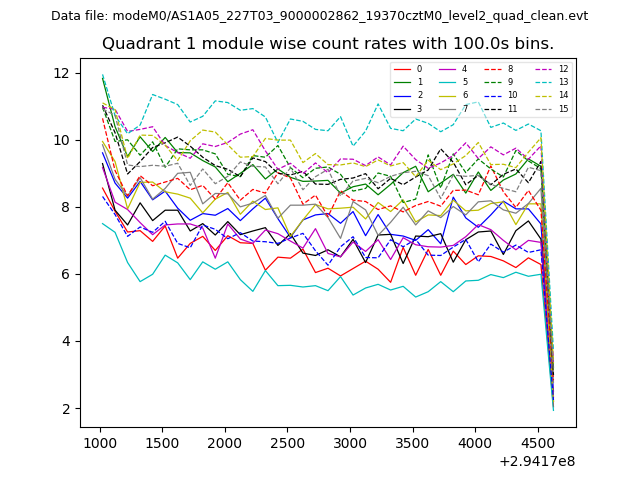 |
 |
| Module-wise count rates for Quadrant C Data is divided into 100 sec bins |
 |
 |
| Module-wise count rates for Quadrant D Data is divided into 100 sec bins |
 |
 |
| Parameter | Plot |
|---|---|
| CZT HV Monitor | 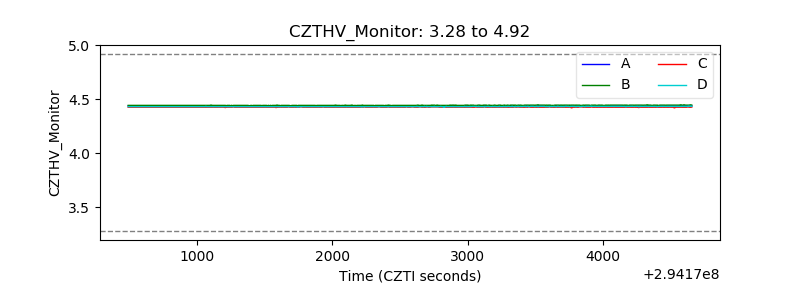 |
| D_VDD | 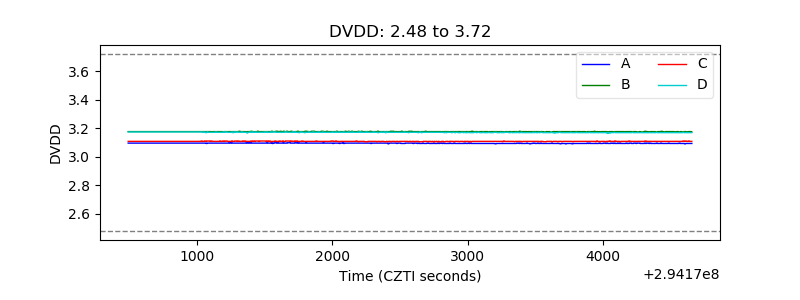 |
| Temperature 1 | 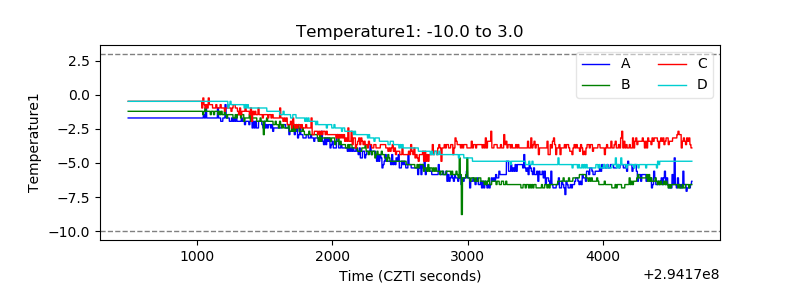 |
| Veto HV Monitor | 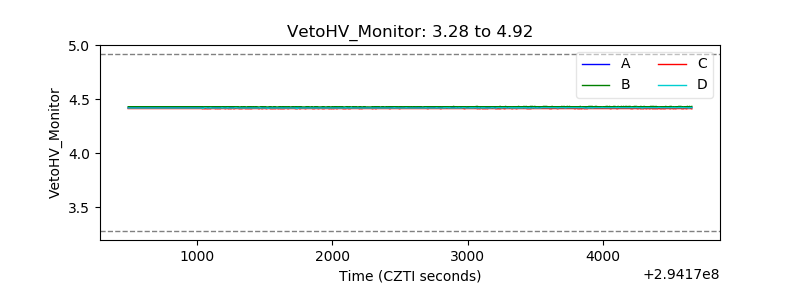 |
| Veto LLD | 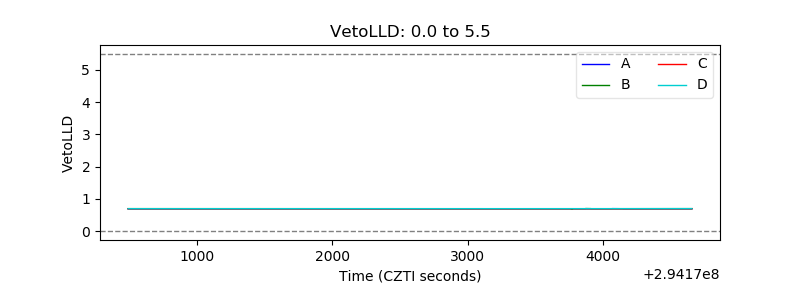 |
| Alpha Counter | 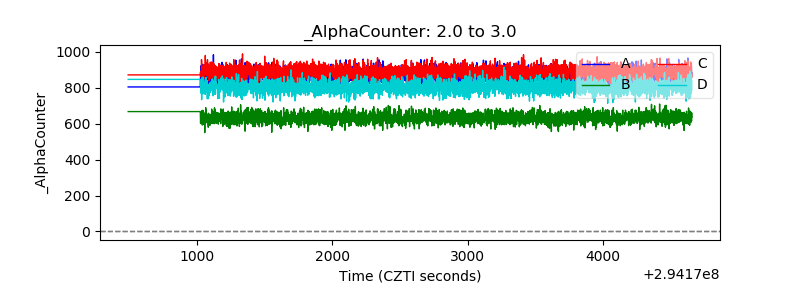 |
| _CPM_Rate | 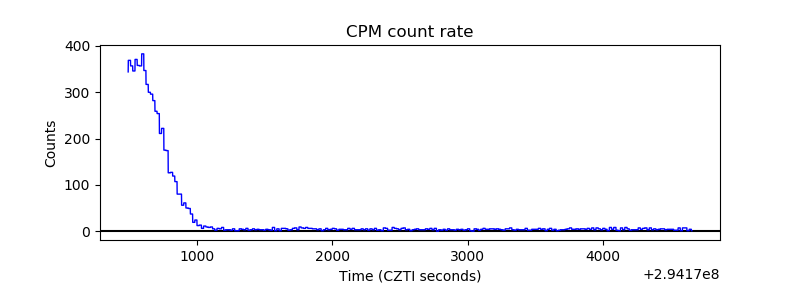 |
| CZT Counter |  |
| +2.5 Volts monitor |  |
| +5 Volts monitor |  |
| _ROLL_ROT | 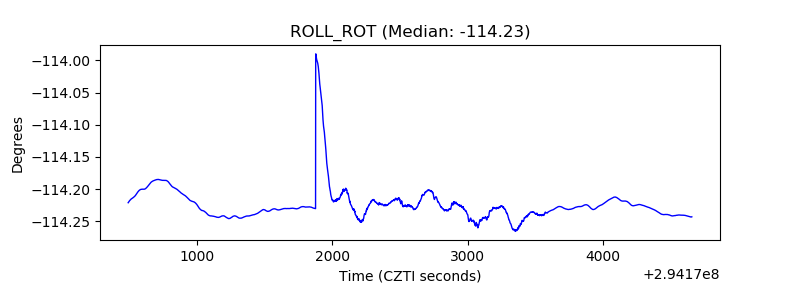 |
| _Roll_DEC | 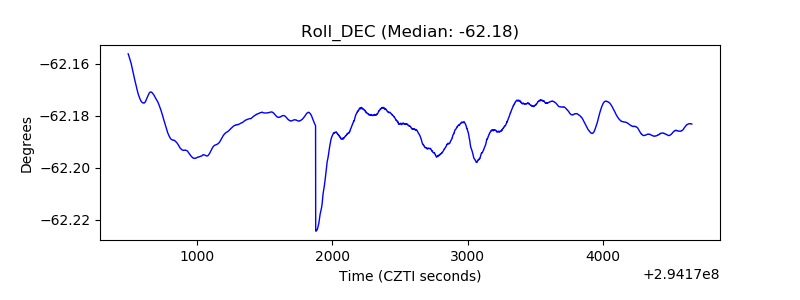 |
| _Roll_RA |  |
| Veto Counter | 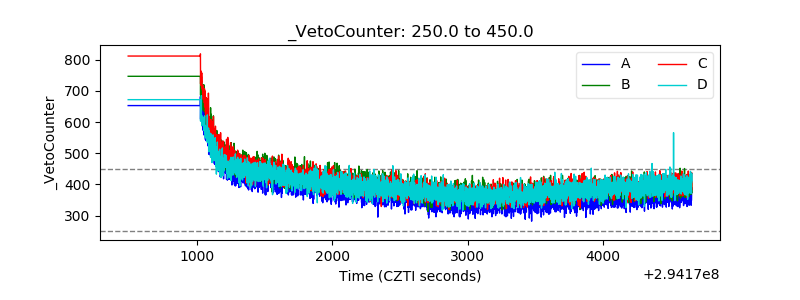 |