| Param | Original file | Final file |
|---|---|---|
| Filename | modeM0/AS1A05_025T17_9000002868cztM0_level2.fits | modeM0/AS1A05_025T17_9000002868cztM0_level2_quad_clean.evt |
| Size (bytes) | 135,512,640 | 109,840,320 |
| Size | 129.2 MB | 104.8 MB |
| Events in quadrant A | 939,158 | 743,322 |
| Events in quadrant B | 888,532 | 731,256 |
| Events in quadrant C | 880,192 | 677,160 |
| Events in quadrant D | 483,968 | 265,867 |
| Mode M0 | |||
|---|---|---|---|
| Quadrant | BADHDUFLAG | Total packets | Discarded packets |
| A | 0 | 28767 | 0 |
| B | 0 | 29143 | 0 |
| C | 0 | 28238 | 0 |
| D | 0 | 92797 | 0 |
| Mode SS | |||
|---|---|---|---|
| Quadrant | BADHDUFLAG | Total packets | Discarded packets |
| A | 0 | 268 | 0 |
| B | 0 | 268 | 0 |
| C | 0 | 268 | 0 |
| D | 0 | 268 | 0 |
| Mode M9 | |||
|---|---|---|---|
| Quadrant | BADHDUFLAG | Total packets | Discarded packets |
| A | 0 | 39 | 0 |
| B | 0 | 39 | 0 |
| C | 0 | 39 | 0 |
| D | 0 | 39 | 0 |
| Quadrant | Total seconds | Saturated seconds | Saturation percentage |
|---|---|---|---|
| A | 13137 | 304 | 2.314075% |
| B | 13137 | 329 | 2.504377% |
| C | 13137 | 358 | 2.725128% |
| D | 13137 | 10001 | 76.128492% |
Noise dominated data is calculated using 1-second bins in cleaned event files. If a bin has >2000 counts, and if more than 50% of those come from <1% of pixels, then it is considered to be noise-dominated and hence unusable.
| Quadrant | # 1 sec bins | Bins with >0 counts | Bins with >2000 counts | High rate bins dominated by noise | Noise dominated (total time) | Noise dominated (detector-on time) | Marked lightcurve |
|---|---|---|---|---|---|---|---|
| A | 17042 | 13134 | 0 | 0 | 0.00% | 0.00% |  |
| B | 17042 | 13134 | 0 | 0 | 0.00% | 0.00% | 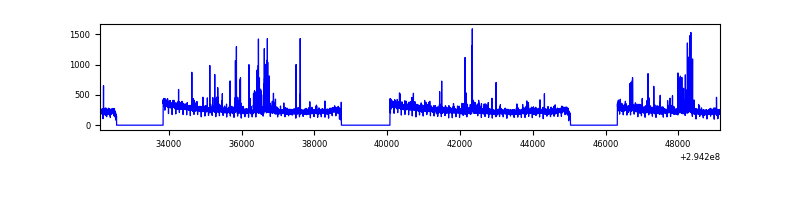 |
| C | 17042 | 13134 | 0 | 0 | 0.00% | 0.00% | 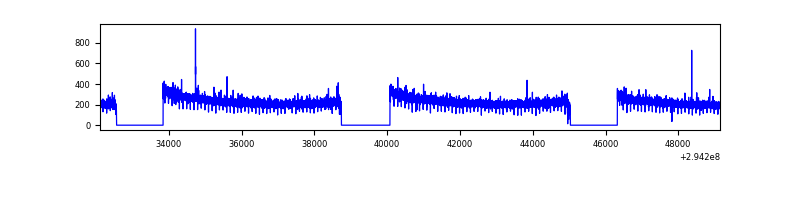 |
| D | 17042 | 13008 | 0 | 0 | 0.00% | 0.00% |  |
Top three noisy pixels from each quadrant. If the there are fewer than three noisy pixels in the level2.evt file, extra rows are filled as -1
| Pixel properties | Quadrant properties | ||||||
|---|---|---|---|---|---|---|---|
| Quadrant | DetID | PixID | Counts | Sigma | Mean | Median | Sigma |
| A | 0 | 29 | 936 | 11.87 | 245 | 233 | 59.2 |
| A | 7 | 110 | 770 | 9.07 | 245 | 233 | 59.2 |
| A | 9 | 19 | 736 | 8.5 | 245 | 233 | 59.2 |
| B | 2 | 9 | 653 | 8.87 | 236 | 227 | 48.0 |
| B | 5 | 128 | 597 | 7.71 | 236 | 227 | 48.0 |
| B | 2 | 8 | 573 | 7.2 | 236 | 227 | 48.0 |
| C | 1 | 80 | 664 | 7.37 | 232 | 220 | 60.2 |
| C | 1 | 81 | 642 | 7.01 | 232 | 220 | 60.2 |
| C | 9 | 188 | 610 | 6.47 | 232 | 220 | 60.2 |
| D | 4 | 246 | 385 | 6.7 | 138 | 126 | 38.7 |
| D | 3 | 14 | 358 | 6.0 | 138 | 126 | 38.7 |
| D | 6 | 83 | 351 | 5.82 | 138 | 126 | 38.7 |
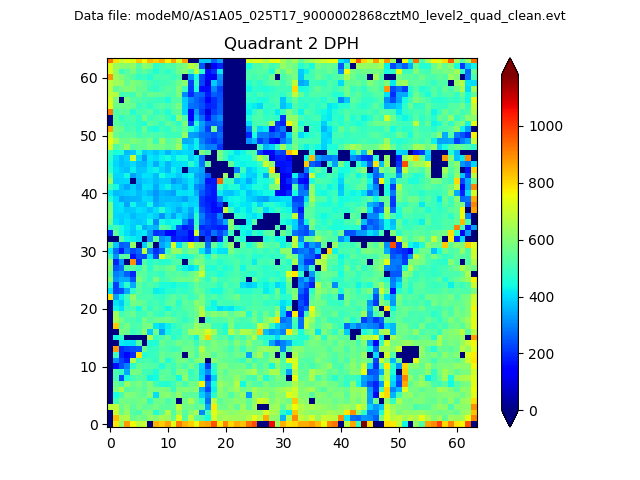
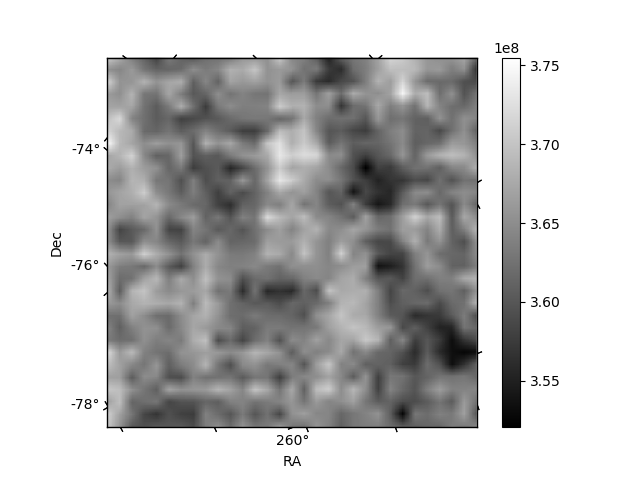
Histogram calculated using DETX and DETY for each event in the final _common_clean file
| Quadrant A | 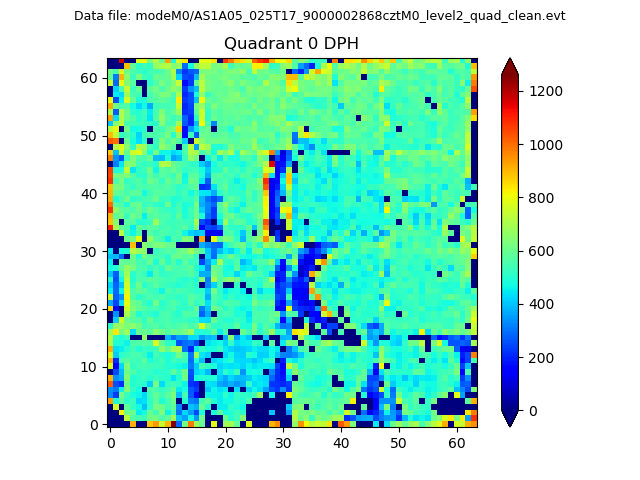 |
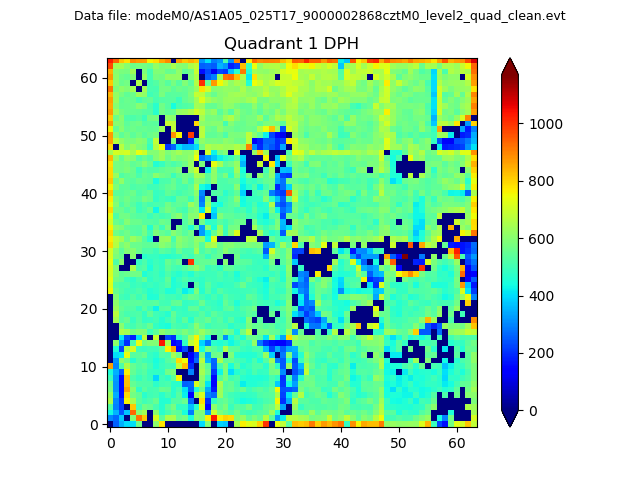 |
Quadrant B |
|---|---|---|---|
| Quadrant D | 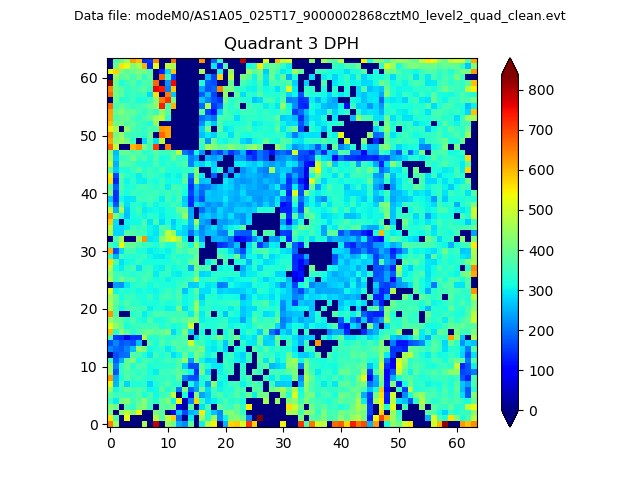 |
 |
Quadrant C |
| Plot type | Count rate plots | Images |
|---|---|---|
| Comparison with Poisson distribution Blue bars denote a histogram of data divided into 1 sec bins. Red curve is a Poisson curve with rate = median count rate of data. |
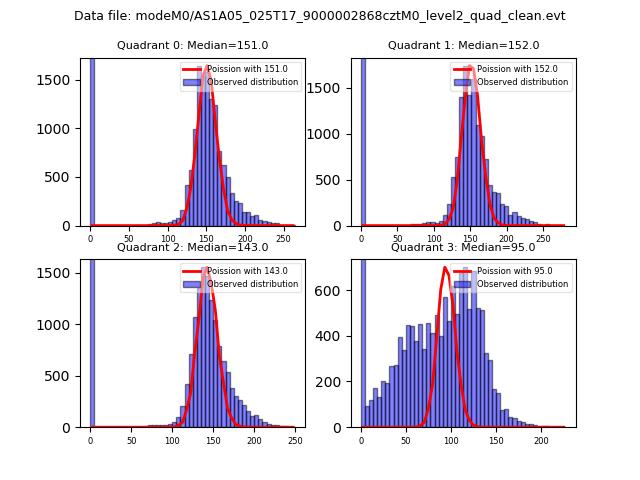 |
 |
| Quadrant-wise count rates Data is divided into 100 sec bins |
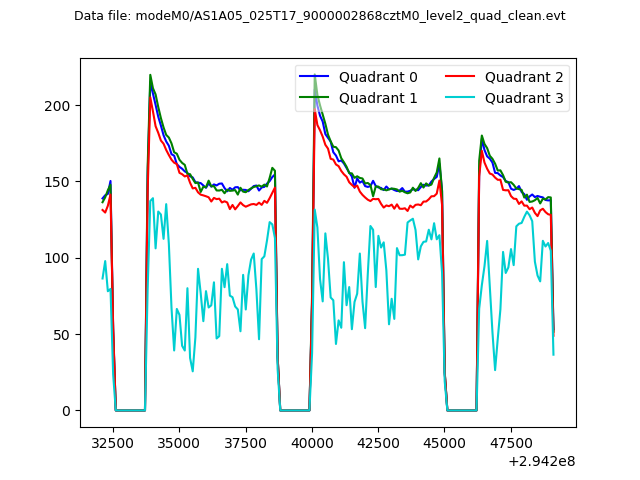 |
|
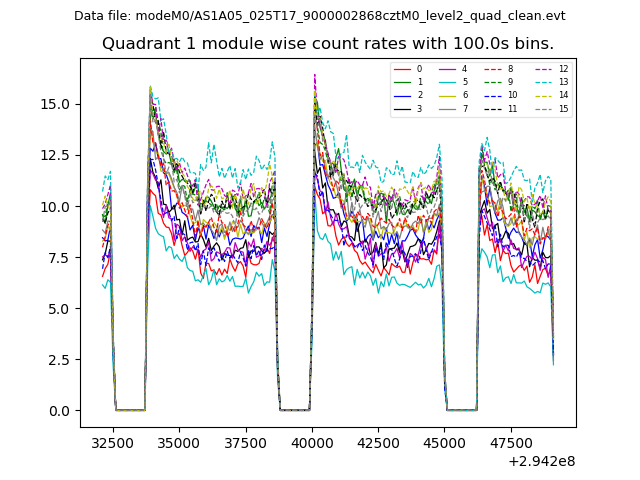
| Module-wise count rates for Quadrant A Data is divided into 100 sec bins |
 |
 |
| Module-wise count rates for Quadrant B Data is divided into 100 sec bins |
 |
 |
| Module-wise count rates for Quadrant C Data is divided into 100 sec bins |
 |
 |
| Module-wise count rates for Quadrant D Data is divided into 100 sec bins |
 |
 |
| Parameter | Plot |
|---|---|
| CZT HV Monitor |  |
| D_VDD | 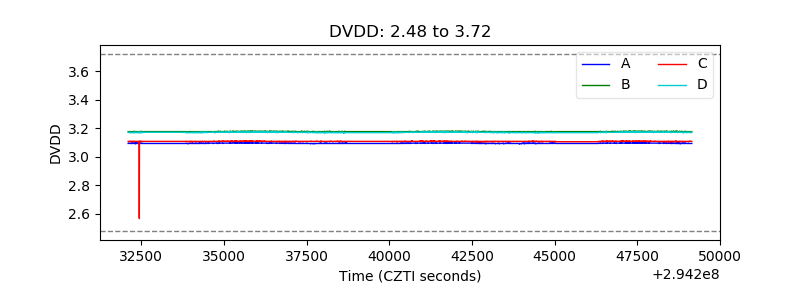 |
| Temperature 1 |  |
| Veto HV Monitor | 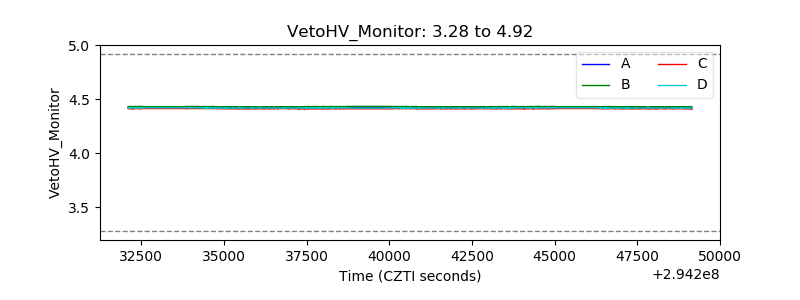 |
| Veto LLD | 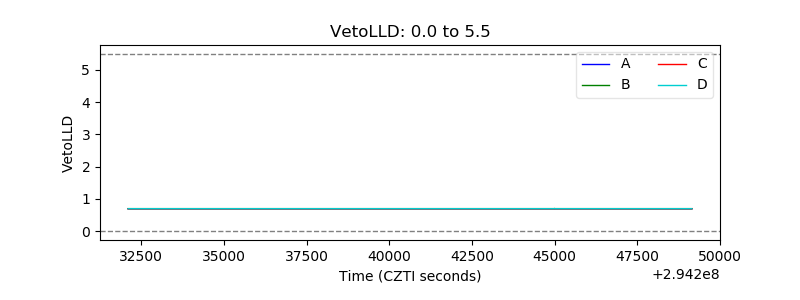 |
| Alpha Counter | 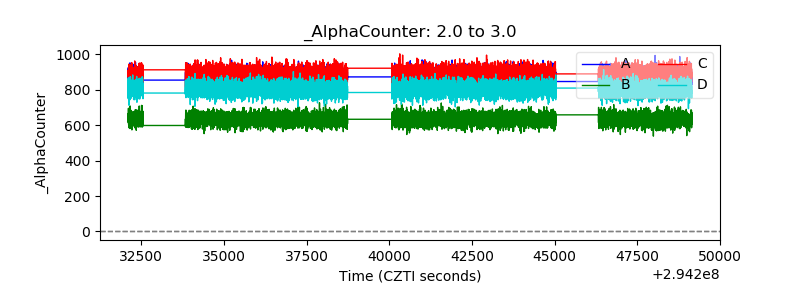 |
| _CPM_Rate |  |
| CZT Counter |  |
| +2.5 Volts monitor |  |
| +5 Volts monitor |  |
| _ROLL_ROT | 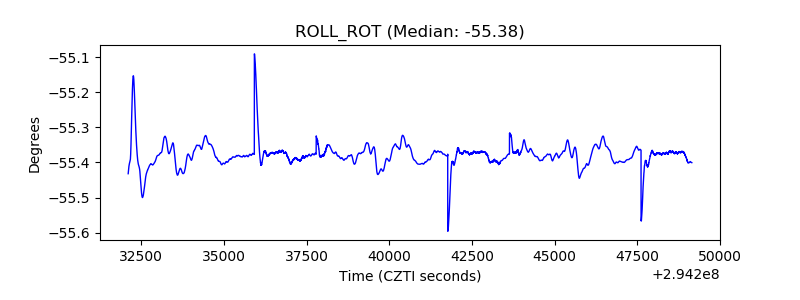 |
| _Roll_DEC | 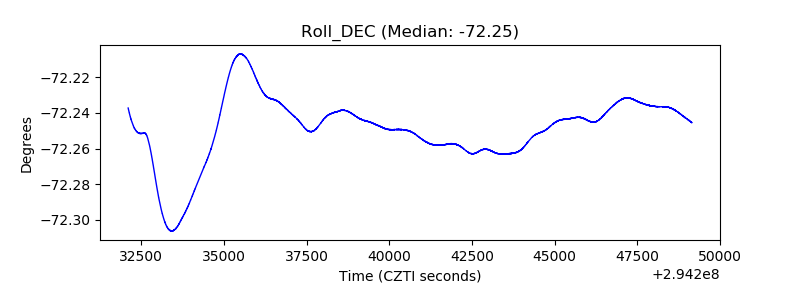 |
| _Roll_RA | 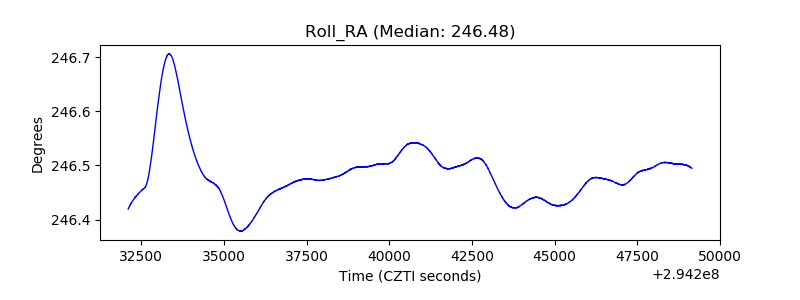 |
| Veto Counter | 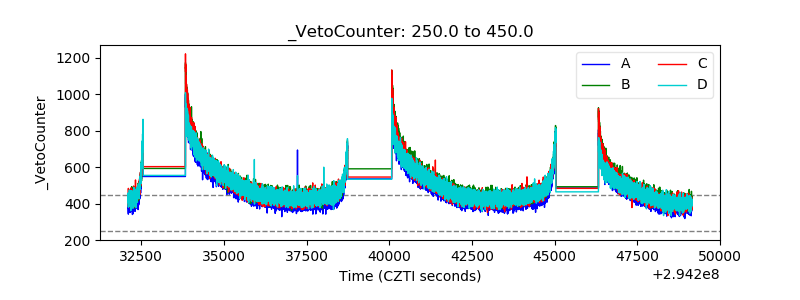 |