| Param | Original file | Final file |
|---|---|---|
| Filename | modeM0/AS1A05_025T17_9000002868_19380cztM0_level2.evt | modeM0/AS1A05_025T17_9000002868_19380cztM0_level2_quad_clean.evt |
| Size (bytes) | 271,008,000 | 45,109,440 |
| Size | 258.5 MB | 43.0 MB |
| Events in quadrant A | 1,182,132 | 346,415 |
| Events in quadrant B | 1,188,896 | 354,065 |
| Events in quadrant C | 1,178,456 | 331,452 |
| Events in quadrant D | 4,517,688 | 185,376 |
| Mode M0 | |||
|---|---|---|---|
| Quadrant | BADHDUFLAG | Total packets | Discarded packets |
| A | 0 | 4854 | 1 |
| B | 0 | 4878 | 1 |
| C | 0 | 4845 | 1 |
| D | 0 | 14799 | 1 |
| Mode SS | |||
|---|---|---|---|
| Quadrant | BADHDUFLAG | Total packets | Discarded packets |
| A | 0 | 42 | 0 |
| B | 0 | 42 | 0 |
| C | 0 | 42 | 0 |
| D | 0 | 42 | 0 |
| Mode M9 | |||
|---|---|---|---|
| Quadrant | BADHDUFLAG | Total packets | Discarded packets |
| A | 0 | 13 | 0 |
| B | 0 | 13 | 0 |
| C | 0 | 13 | 0 |
| D | 0 | 13 | 0 |
| Quadrant | Total seconds | Saturated seconds | Saturation percentage |
|---|---|---|---|
| A | 2036 | 76 | 3.732809% |
| B | 2035 | 82 | 4.029484% |
| C | 2035 | 97 | 4.766585% |
| D | 2035 | 1845 | 90.663391% |
Noise dominated data is calculated using 1-second bins in cleaned event files. If a bin has >2000 counts, and if more than 50% of those come from <1% of pixels, then it is considered to be noise-dominated and hence unusable.
| Quadrant | # 1 sec bins | Bins with >0 counts | Bins with >2000 counts | High rate bins dominated by noise | Noise dominated (total time) | Noise dominated (detector-on time) | Marked lightcurve |
|---|---|---|---|---|---|---|---|
| A | 3316 | 2036 | 0 | 0 | 0.00% | 0.00% | 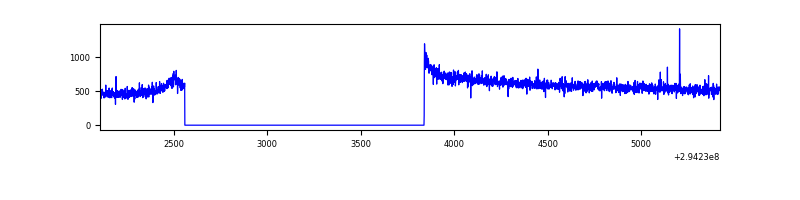 |
| B | 3315 | 2035 | 0 | 0 | 0.00% | 0.00% | 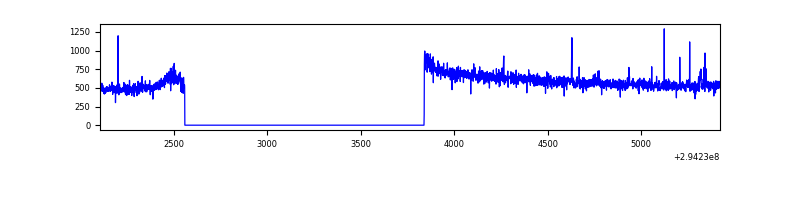 |
| C | 3315 | 2035 | 0 | 0 | 0.00% | 0.00% | 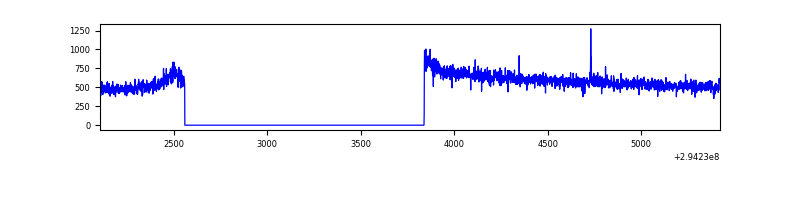 |
| D | 3314 | 2034 | 1561 | 1561 | 47.10% | 76.75% | 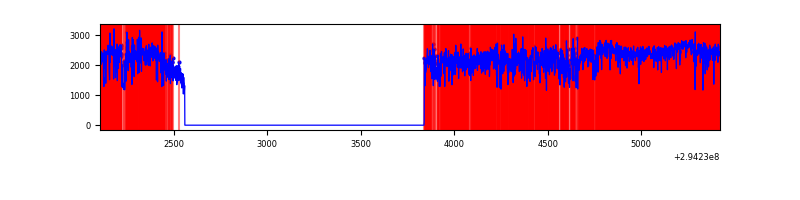 |
Top three noisy pixels from each quadrant. If the there are fewer than three noisy pixels in the level2.evt file, extra rows are filled as -1
| Pixel properties | Quadrant properties | ||||||
|---|---|---|---|---|---|---|---|
| Quadrant | DetID | PixID | Counts | Sigma | Mean | Median | Sigma |
| A | 0 | 226 | 2827 | 41.06 | 306 | 301 | 61.5 |
| A | 5 | 16 | 2323 | 32.87 | 306 | 301 | 61.5 |
| A | 12 | 194 | 2222 | 31.23 | 306 | 301 | 61.5 |
| B | 4 | 216 | 6790 | 115.02 | 300 | 294 | 56.5 |
| B | 12 | 111 | 5858 | 98.52 | 300 | 294 | 56.5 |
| B | 11 | 111 | 5339 | 89.33 | 300 | 294 | 56.5 |
| C | 14 | 238 | 46751 | 699.9 | 288 | 290 | 66.4 |
| C | 5 | 4 | 3366 | 46.34 | 288 | 290 | 66.4 |
| C | 13 | 61 | 2084 | 27.03 | 288 | 290 | 66.4 |
| D | 10 | 66 | 2683270 | 59286.84 | 186 | 180 | 45.3 |
| D | 7 | 238 | 1024803 | 22640.56 | 186 | 180 | 45.3 |
| D | 12 | 218 | 69455 | 1530.73 | 186 | 180 | 45.3 |
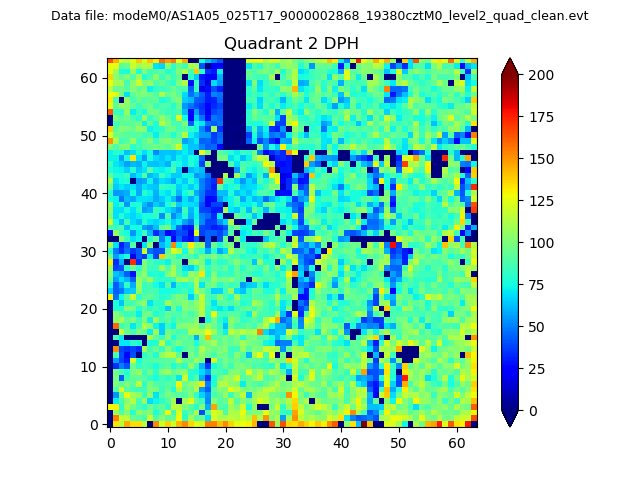
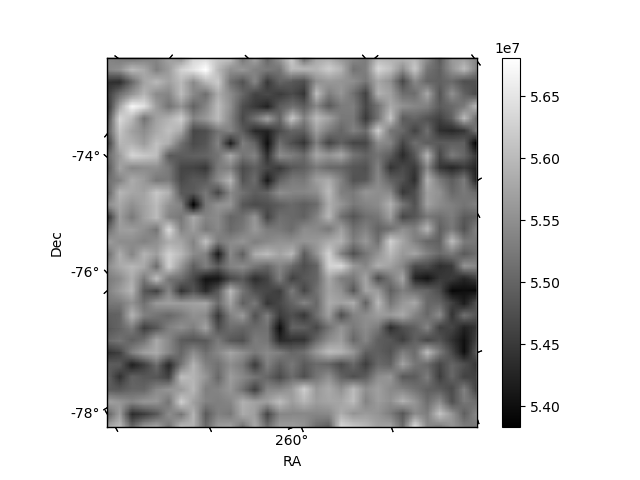
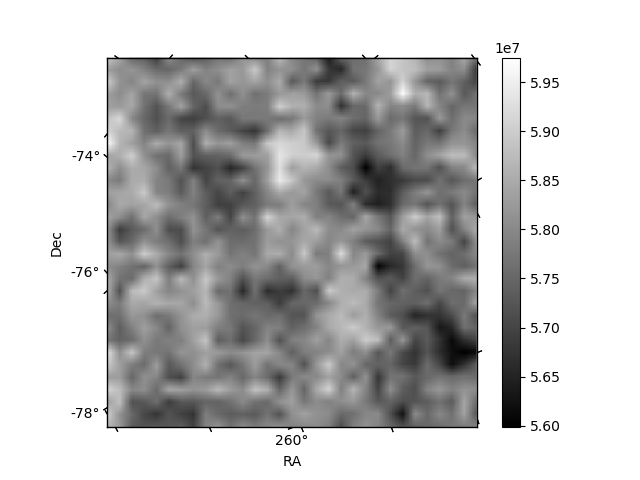
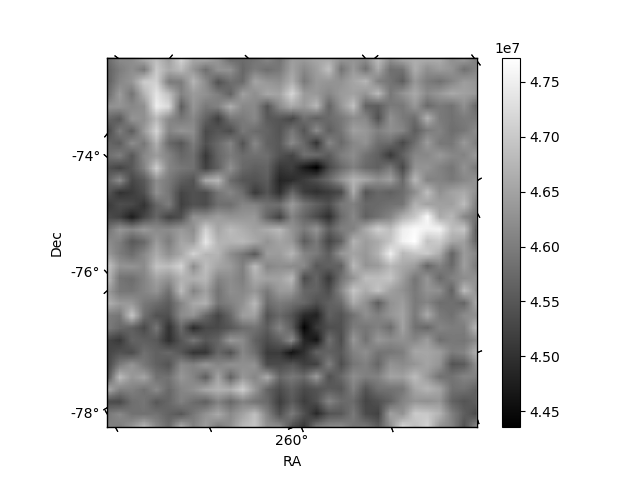
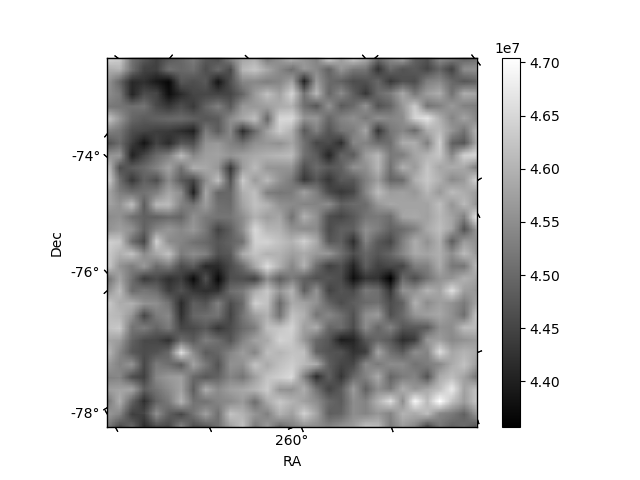
Histogram calculated using DETX and DETY for each event in the final _common_clean file
| Quadrant A | 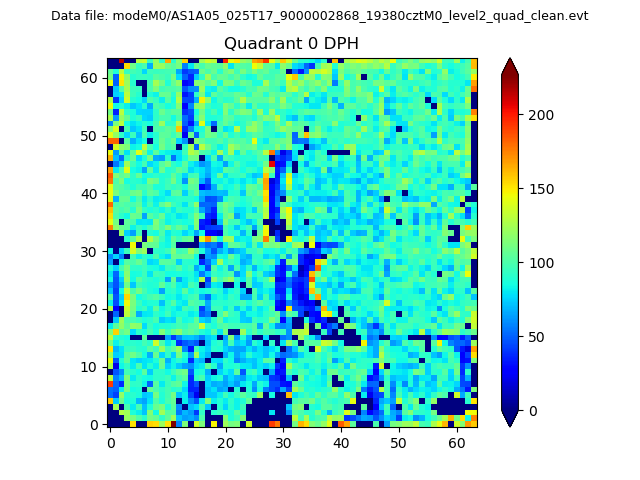 |
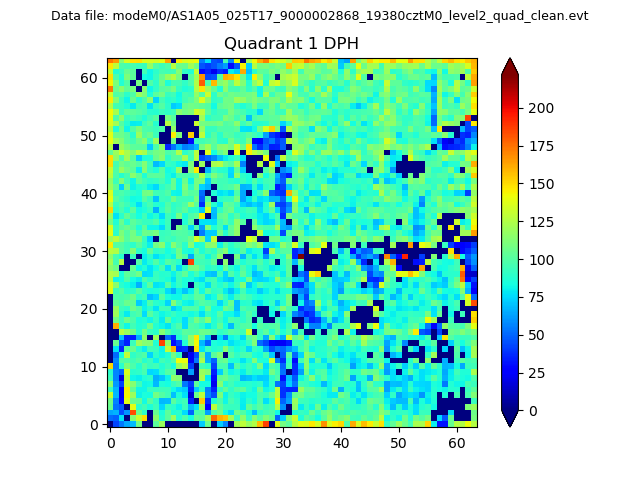 |
Quadrant B |
|---|---|---|---|
| Quadrant D | 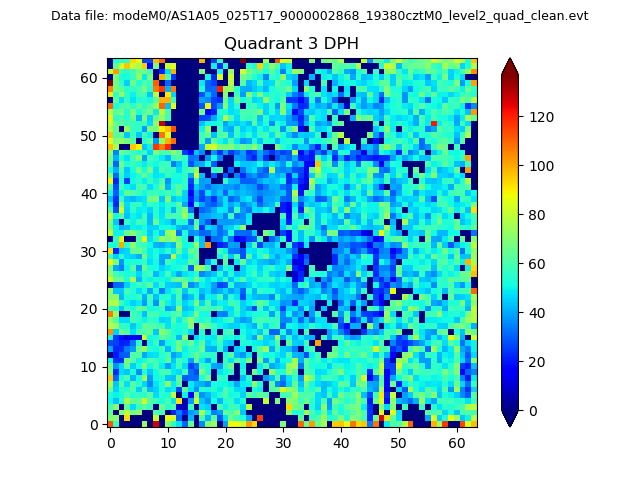 |
 |
Quadrant C |
| Plot type | Count rate plots | Images |
|---|---|---|
| Comparison with Poisson distribution Blue bars denote a histogram of data divided into 1 sec bins. Red curve is a Poisson curve with rate = median count rate of data. |
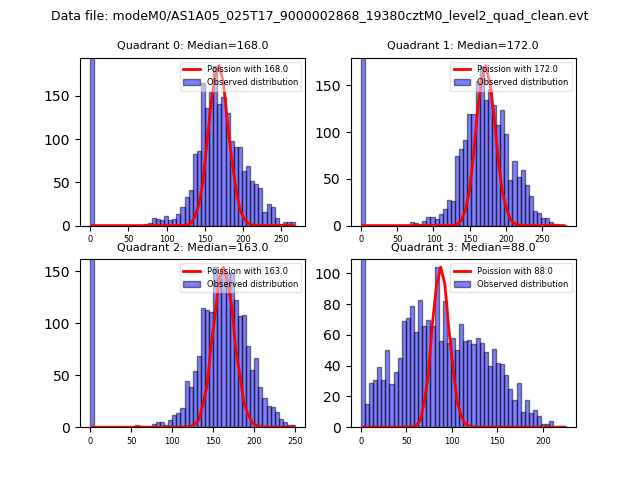 |
 |
| Quadrant-wise count rates Data is divided into 100 sec bins |
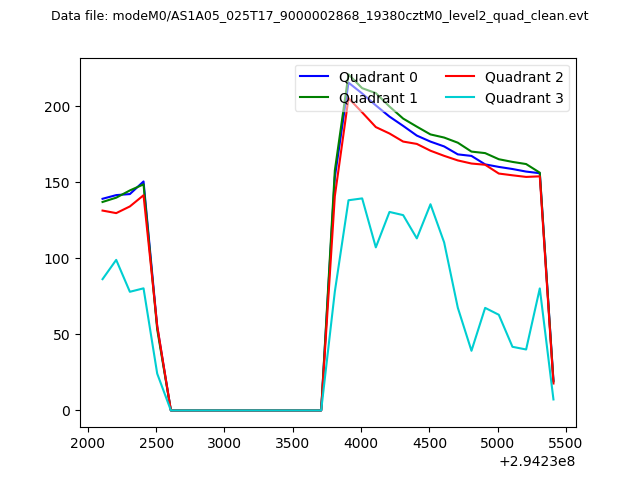 |
|
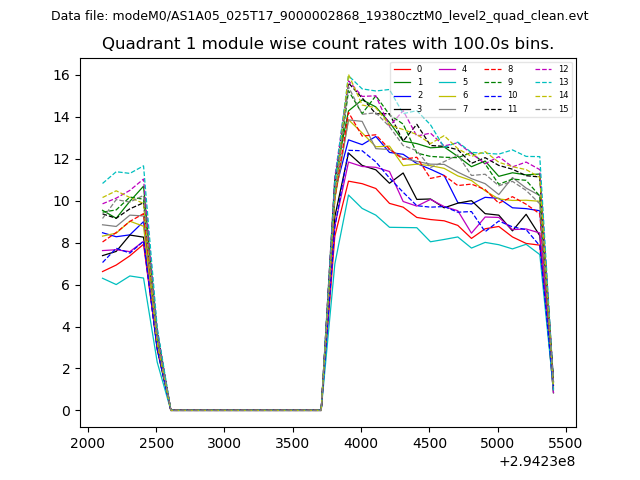
| Module-wise count rates for Quadrant A Data is divided into 100 sec bins |
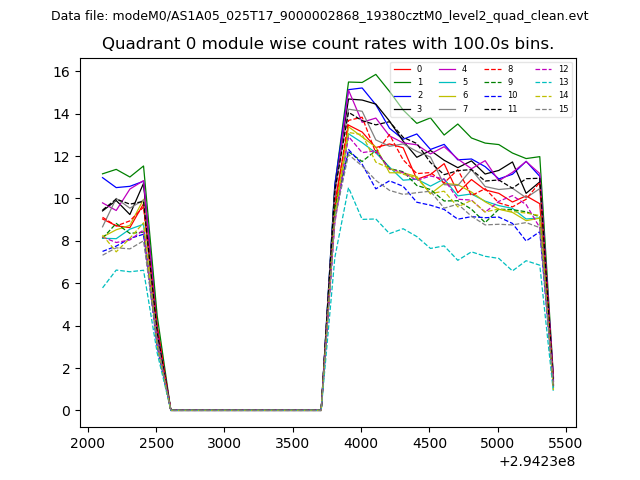 |
 |
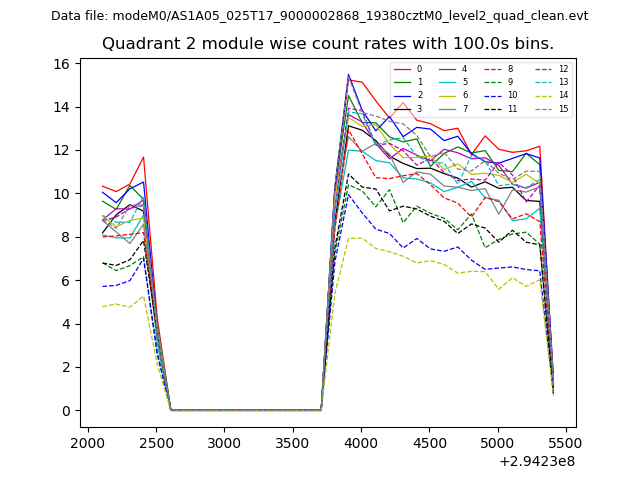
| Module-wise count rates for Quadrant B Data is divided into 100 sec bins |
 |
 |
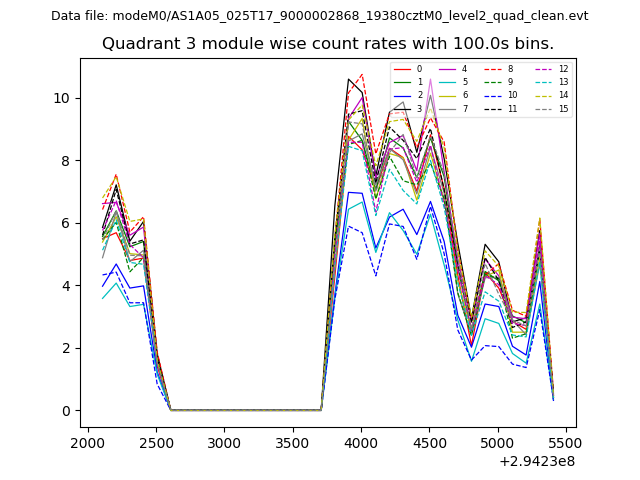
| Module-wise count rates for Quadrant C Data is divided into 100 sec bins |
 |
 |
| Module-wise count rates for Quadrant D Data is divided into 100 sec bins |
 |
 |
| Parameter | Plot |
|---|---|
| CZT HV Monitor | 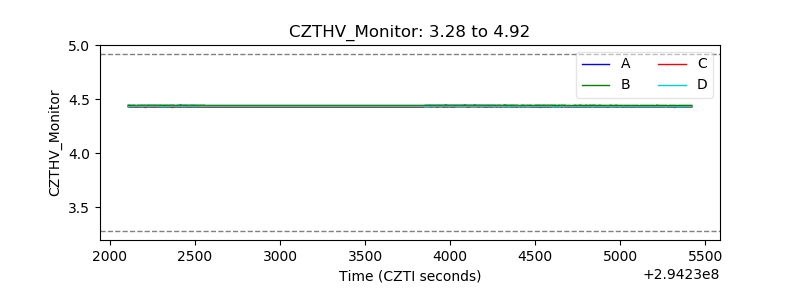 |
| D_VDD | 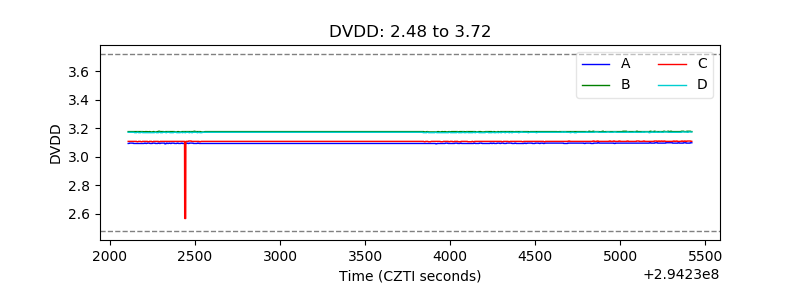 |
| Temperature 1 | 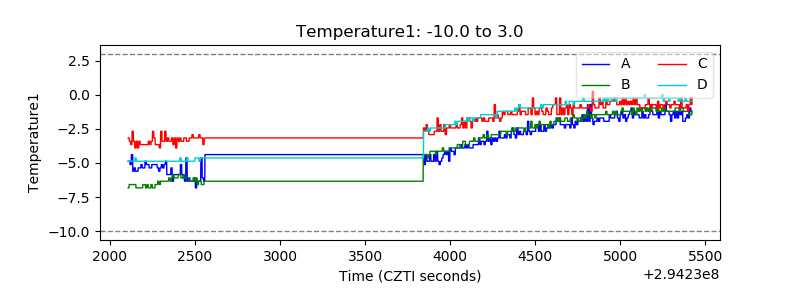 |
| Veto HV Monitor | 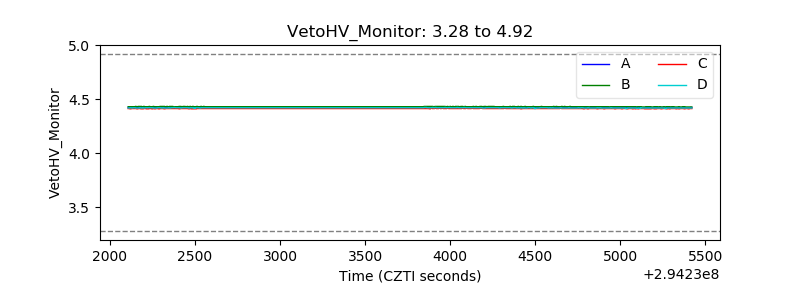 |
| Veto LLD | 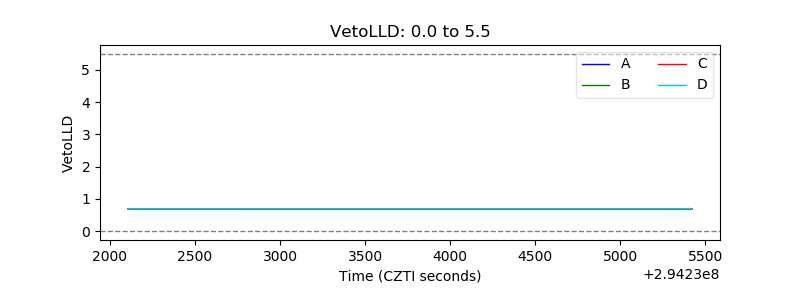 |
| Alpha Counter | 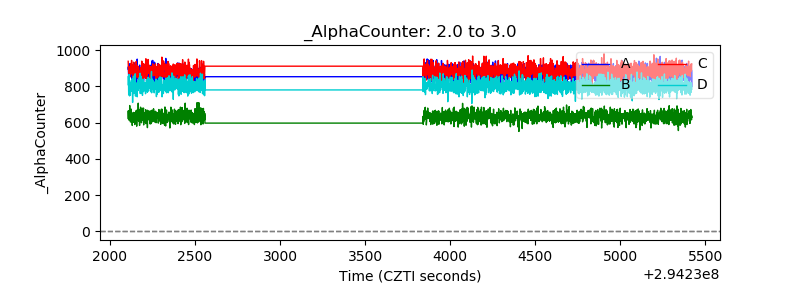 |
| _CPM_Rate | 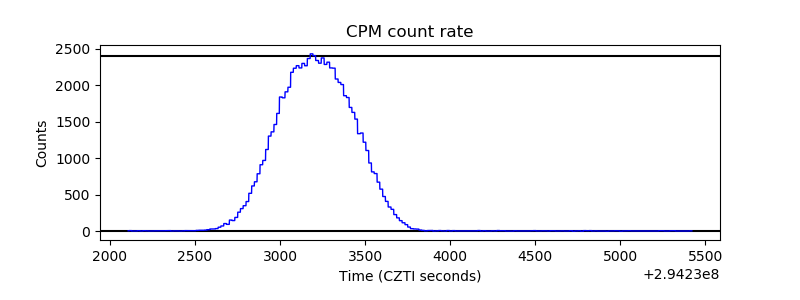 |
| CZT Counter | 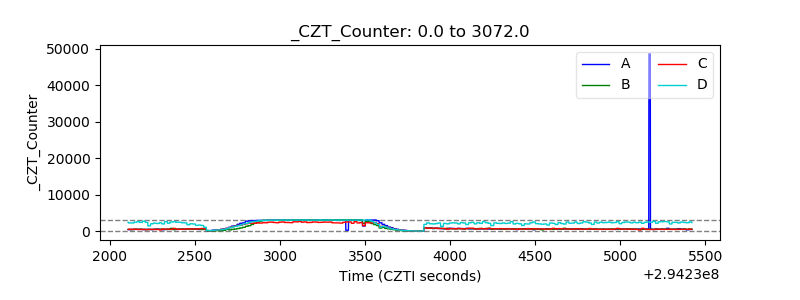 |
| +2.5 Volts monitor |  |
| +5 Volts monitor |  |
| _ROLL_ROT | 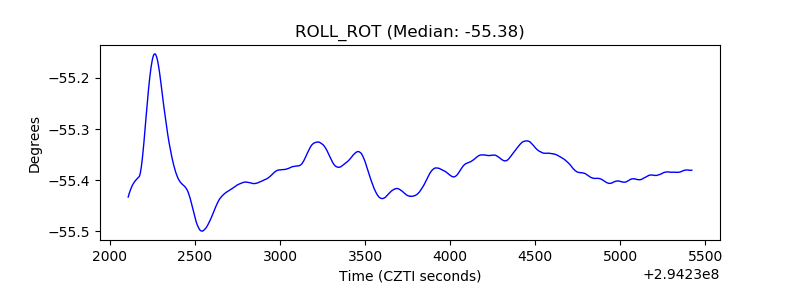 |
| _Roll_DEC | 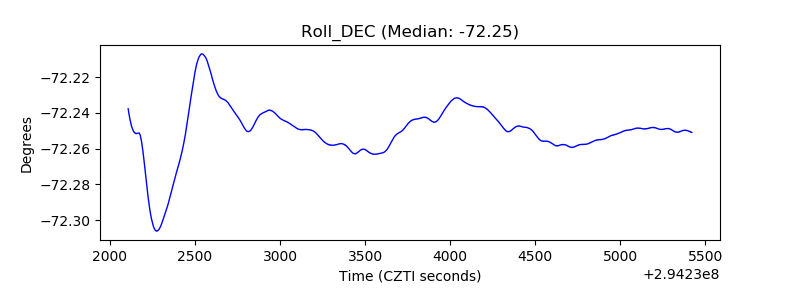 |
| _Roll_RA |  |
| Veto Counter | 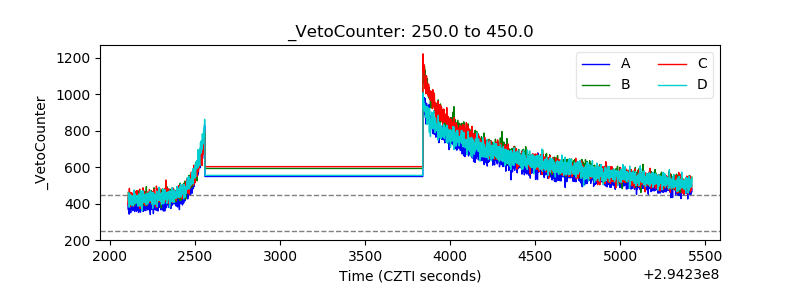 |